
A Case Study in A3 Problem-Solving
Long Patient Transportation Times
The Context
At Community Medical Center (CMC), two types of patients are sent to the diagnostic departments for the procedures: outpatients and inpatients. The outpatients come to the hospital, register, complete the procedure, and leave on the same day. The inpatients reside in the clinical departments overnight and are sent to the diagnostic departments for various procedures depending on the medical necessity. Once the procedure is complete, s/he is returned to the clinical department.
Some of the outpatients who come for the procedures are old and frail and therefore unable to walk to the diagnostic department. It is the responsibility of the transportation department to provide a transporter to transport the patient to the appropriate department for procedures. Similarly, it is the responsibility of the transporter to transport the inpatients to the diagnostic department from the clinical departments as and when they are scheduled for a procedure.
The diagnostic departments (Operating Room, Radiology, Nuclear Medicine, Cardiology, Endoscopy, and Emergency Room) in CMC regularly complained that patient transporters took an exceedingly long time causing delays in treatment and patient waits, and they blamed the transporters for the delays. Many thought that the transporters were having long coffee breaks and did not transport. They sometimes called the manager of transportation and complained, “We called 35 minutes ago and the patient is not here…” The transportation manager became exasperated with the influx of complaints and decided to address the issue with an A3 process and report.
The A3 Process
A group of individuals representing the diagnostic departments (Radiology, Endoscopy, Special Procedures, Cardiology), Nursing, Transportation, and Quality Risk Management met to discuss the issue and initiate the A3 problem solving method. These individuals formed the core A3 problem solving team.
To understand the problem first hand, the transportation manager and four transporters observed the current process. They observed the patient request to transportation process as it unfolded every day for10 hours for 10 days. He also contacted and interviewed different individuals in the diagnostic departments and the clinical departments to get first hand information about the process. The transportation manager said, “We observed all nursing stations and procedure areas, and noted a process full of miscommunications. For example, I observed the ward secretary… She said she would call [a transporter] right away. She actually made the call 37 minutes later, 3 minutes before the procedure. This happened frequently. The procedure department and the nursing station never communicated as to the expected patient transport times or procedure times. The patient’s nurse often did not even know the patient was going to a procedure so the patient medications were not always met for the procedure….”
In addition, using a self-devised form, the manager of transportation completed a patient transportation survey. In his survey, he measured the time difference between the transporters receiving a beep (a request from the diagnostic department) to the time the patient was transported (delivered) to the diagnostic department or the procedure area. The results of 23 patients surveyed over a three-day period (1/15/03- 1/17/03) showed an average request to delivery time of 56 minutes. The actual patient transport time was only 5 minutes and the rest was preparation time and delays in communication. The communication delays caused delays in timely procedures, resulting in unhappy patients, clinical workers, and physicians.
In the current state, somebody from the diagnostic department, usually a technician called or paged the transporter. At other times, somebody from the diagnostic department called the ward secretary on the floors who then called the RN and the transporter. The transporter did not know who was paging. Sometimes the message the transporter received said, “Bring down John Doe to Radiology.” There was no information on the room number, bed number, floor, or area. The transporter did not know from where the person was paging and did not always know whom to call to clarify. She only knew a patient needed to be transported. A great deal of time was thus expended by the transporter on patient search.
If the information was complete and the patient was ready for the procedure, the transporter reached the patient and transported him or her to the diagnostic department. However, in many situations when the transporter reached the patient (usually inpatients), s/he was not ready and was in need of medications, Magnetic Resonance Imaging (MRI) screen, bathroom, IV change or other needs. In those situations, as the patient was not ready for transport, the transporter contacted the nurse. The transporter left the room and waited for the call from the nurse when the patient was ready for the procedure.
The transportation manager drew the current state (patient ready for transport) drawing on the A3 Report with appropriate icons and arrows to indicate the flow of information and patient through the system (see diagram below). On the current state drawing, he recorded the shortest (9 minutes), longest (177 minutes), and average transportation time (56 minutes) from the data collected earlier. The problems he identified were no written message to request a transporter and late arrival by the patients at the diagnostic departments. These are depicted as storm clouds on the current state diagram.
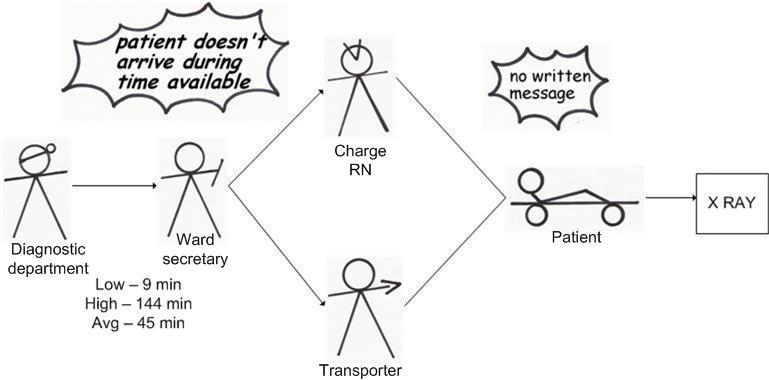
The A3 problem solving team brainstormed the root causes to the problems using the “5-Whys” approach. The analysis of the first storm cloud revealed that the staff members calling from the diagnostic department were often too busy to send written messages to the transporter or to the floors and therefore the message lacked complete information causing delays. The analysis of the second storm cloud revealed that as the RNs or the ward secretaries were sometimes not aware that a patient needed a procedure, and therefore, they failed to prepare the patient on time which eventually led to late arrival of the patient at the diagnostic department.
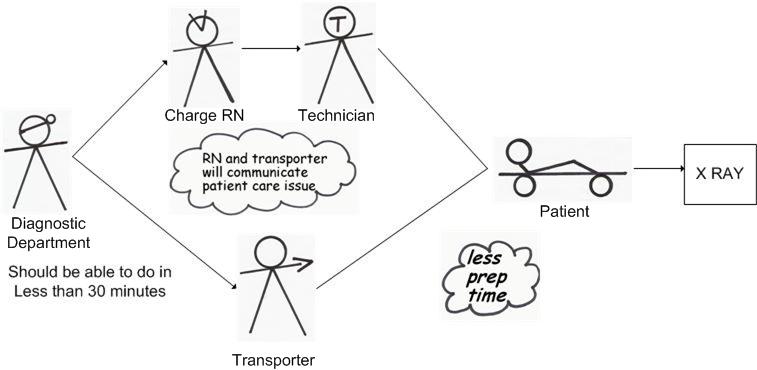
Based on the understanding of the current state and the associated root causes, the team embarked on devising the target state. The transportation manager termed the problem solving as “Road to Recovery”. In the target state, the staff in the diagnostic department (usually a technician in Radiology or Endoscopy, or ward secretary in Surgery) will page both the charge RN and the transporter at the same time. The information included in the page is complete information for effective transport of the patient to the diagnostic department (i.e. patients first and last name, medical record number, room number, destination, etc.). The charge RN will attend to the nursing care needs of the patient and the transporter will attend to the comforts during transport such as shoes, blankets, chairs/stretcher etc. If everything is found in order, the patient will be transported to the diagnostic department for the procedure. On completion of the procedure, the diagnostic department will page the transporter who will return the patient back to his/her room.
The transportation manager drew the target state drawing on the A3 report as illustrated below:
The specific countermeasures to achieve the target state, then, were:
- Diagnostic departments will beep the charge RN and the transporter at the same time
- The page will include specific information, and a reference card
- The charge RN (or a person designated by the charge RN) and the transporter will attend the patient, with specific responsibilities
- Make the patient aware of the ensuing procedure
As part of the implementation plan, the team created a specific action plan. First a designated transporter and a staff responsible for communications in CMC developed a “group page” whereby two or more people could be paged simultaneously by the diagnostic departments. Second, the transportation manager and the charge RNs met and developed a patient tracking sheet (a log sheet for the floor staff to sign off when the patient is transported). Third, the transportation manager and the designated transporter developed a reference card that contains the pager numbers of the charge RNs of each clinical department (Obstetrics, Medical Surgical Floor, Intensive Care Unit, Orthopedic, Rehab Nursing Unit, etc.), and the transport pager number that the diagnostic departments should page. It contains the information that needs to be paged by the diagnostic department when asking for a patient transport. This information includes:
- Name of the department from where the message is paged
- First and last name of the patient
- Patient's Medical Record #
- Room #
- Patient's destination
- Preferred mode of transport (chair, stretcher)
The reference card also contains the step-by-step procedure for requesting a transporter by the diagnostic departments. The transportation manager sent copies of the cheat sheet to every department to ensure safe, accurate, and efficient transport of patients.
To ensure smooth implementation of the improved process, the transportation manager met with key individuals in all clinical departments on a one-on-one basis, explained to them about the necessity of the new process and got their feedback on the new process and how it could be improved. He also had couple of meetings with the house supervisors to get them on board with the new process. The transportation manager mentioned that the ward secretaries were tough to deal with initially. But the house supervisors were very supportive. “They hit the nail. They made the ward secretaries conform to the policies,” said the transportation manager. The procedural departments were very supportive as well.
The transportation manager set the target time from request to delivery at 30 minutes. When asked about the rationale for setting such a high time, he responded, “The procedural departments were happy with 30 minutes. They were tickled to death. Moreover, most procedure departments schedule in 30 minutes increments.” He carried out follow-up surveys at regular intervals to continue to assess transport time. The following table presents the collected data:
| Survey Date | Time (In Mins) |
|---|---|
|
March, 2003 |
14.7 |
|
April, 2004 |
11 |
|
September, 2004 |
11.5 |
|
May, 2005 |
9.15 |
Reactions to the A3 Process
The transportation manager felt the A3 process was every effective for problem solving in healthcare. He wrote, “I find the [A3 Process] a very important tool for evaluating problems and/or processes. It allows a person or team to look at how a process flows and where the problem or work around area may be. It promotes team work on solving problems by giving a global and unbiased look into procedures. It involves a positive thought process and invigorates the mind to think in alternative ways of problem solving by including all aspects of a process. It gives all parties involved a way to express and present their perceptions, fact or data on a process/problem. The end result is a quantitative measure if there is an improvement and if it can be sustained. On a scale of 1-10, ten being the highest, I would rate the [A3 Process] at a 10. In my case it has given me the tool for myself and staff to become involved in a data driven process that can prove perceived outcomes. Without TPS process it would be very difficult to outline how an improvement plan will really be effective.”