
The A3 Report
the A3 Report goes hand-in-hand with steps 0-6 of the A3 Process. The purpose of the A3 Report is to:
- Document the learning, decisions, and planning involved with solving a problem
- Facilitate communication with people in other departments
- Provide structure to problem-solving so as to maximize learning
The report (template) is designed to be printed on 11x17 inch paper (or two pieces of 8.5x11 inch paper) as shown in the diagram below. For additional explanations of the individual parts of the report, click on the title box for that part. You can also download an A3 Report template in MS Word format; however, remember this is a flexible tool and can be adapted to specific situations-just don't short circuit the process!
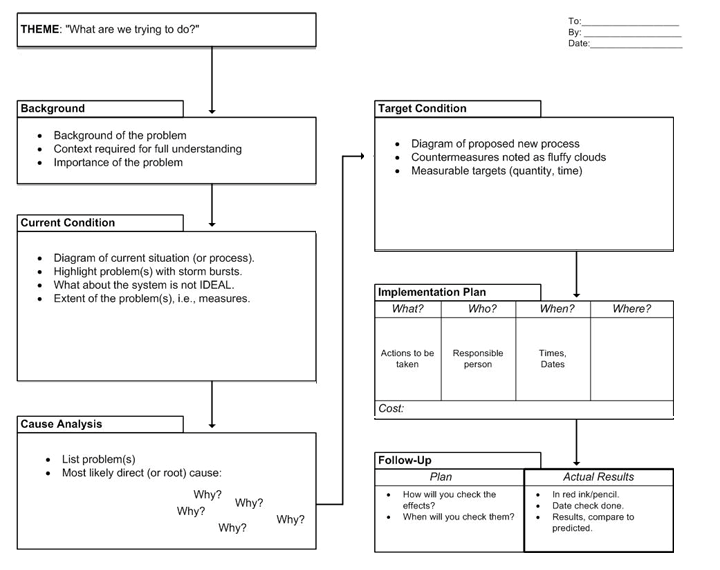
Theme:
The theme of your A3 report should be a concise statement of what the A3 report is about. It should answer the question, "What are we trying to do here?"
An example of a theme might be, "Decrease patient transport time to diagnostic department."
Background:
The background section includes any contextual or background information necessary to fully understand the issue. it's also important to indicate how this problem relates to the company's goals or values.
Example:
The transportation department regularly receives complaints from diagnostic departments that patients arrive late for their appointments. This causes delays in patient treatment, idle time for diagnostic department staff members, and backups in the diagnostic areas resulting in long patient wait times.
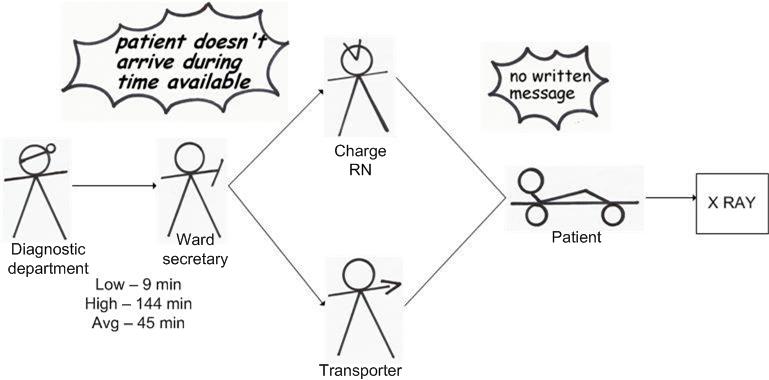
Current Condition:
For the A3 report, the current condition needs to be an image illustrating how the current process works. It's important to label the diagram so that anyone knowledgeable about the process will be able to understand it. major problems also need to be included. Put them in storm bursts so they are set apart from the diagram. Hand-drawn diagrams (in pencil) are often the most effective because they can be done quickly and changed easily on-the-spot.
Cause Analysis:
To start your root cause analysis, make a list of the main problem(s). Next ask the appropriate "why?" questions until you reach the root cause. A good rule-of-thumb is that you haven't reached the root cause until you've asked "why?" at least five times. Record the casual chain(s) on the A3 report.
Example:
Problem: Backups in diagnostic departments
Why?:
- Patients arriving late
- Transporter not called on time
- Ward secretaries are busy and often forget
- No written message
- No protocol
- Transport unable to locate patient
- Page does not include patient location (name only)
- No standard protocol for transport paging
- Patient not ready for transport
- Nurses unaware of prescribed test
- No mechanism to inform RN of scheduled procedure
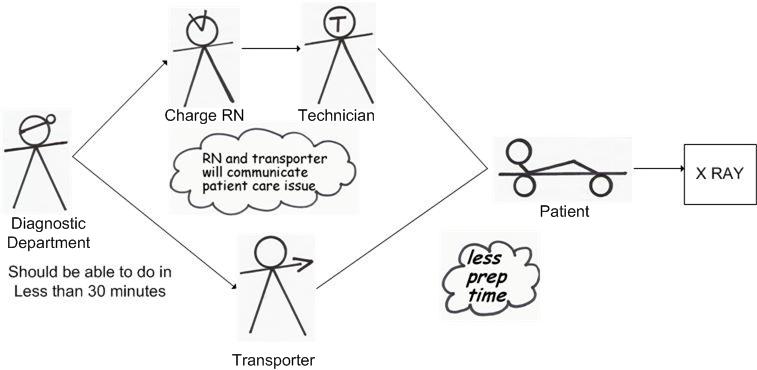
Target Condition:
Comparable to the current condition, the target condition diagram should illustrate how the proposed process will work with the countermeasures in place, with appropriate labels. It's also important to note or list the specific countermeasures that will address the root cause(s). Finally, the problem-solver (or team) should predict the expected specifically and quantitatively, and note it.
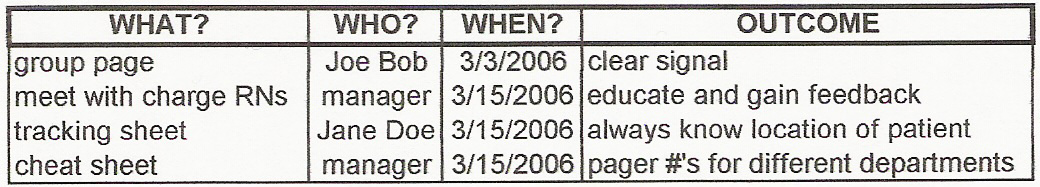
Implementation Plan:
The implementation plan is the set of tasks required to develop the countermeasures, put them in place, and realize the target condition. For each task, a person responsible for that task is listed along with a deadline for task completion. It may also be helpful to list the expected outcome of each task, as shown below.
Follow-up Plan and Results:
In the left-hand side, record the plan to measure the effectiveness of the proposed change: what will be measured, when, and who will do the measuring. Leave the right-hand side blank for recording the actual results. Then, after implementation, complete the follow-up plan and record the results of implementation and dates of the actual follow-up.