
Economic Impact of Agriculture
Granite County
Granite County is a rural sparsely populated county located in the western part of the state. Over 25% of land in Granite County is classified as farm land.
Overview
|
|
|
|
|
|
|
|
|
|
|
|
| Median Farm Size (acres) | 540 |
| Average Farm Size (acres) | 1,892 |
Source: Census of Agriculture: Table 1: County Summary Highlights: 2017
Farm Revenue
Farm revenues (which includes the market value of products sold, government payments,
and farm-related income) were over $19 million while production expenses were nearly
$16 million. Government payments were 1.4% of farm revenues.
|
|
|
|
|
|
|
|
|
|
|
|
| Net Farm Cash Income | $3,606,000 |
Source: Census of Agriculture: Tables 2, 3, 4, 5 and 6: 2017
Taxation
The market value of all property in Granite County was approximately $698 million
in 2019. The taxable value assigned by the Montana Department of Revenue was $14
million. Agricultural Property (as defined by Montana Department of Revenue as Class
3 property) comprised 5.10% of the county's taxable value.
|
|
|
2014 |
| Market Value of Property | $698,875,695 | $671,458,216 |
| Taxable Value of All Property | $14,190,036 | $10,750,945 |
| Taxable Value ofAgricultural Property | $723,062 | $680,451 |
| Ag Taxable Value as % of All Property | 5.10% | 6.33% |
Source: Montana Dept. of Rev. Montana Taxes by County in2018and Montana Taxes by County in2014
Market Value of Crops and Livestock
After adjusting for inflation, the market value of crops increased by 34%, while the
market value of livestock increased by 20%, from 1997 to 2017.
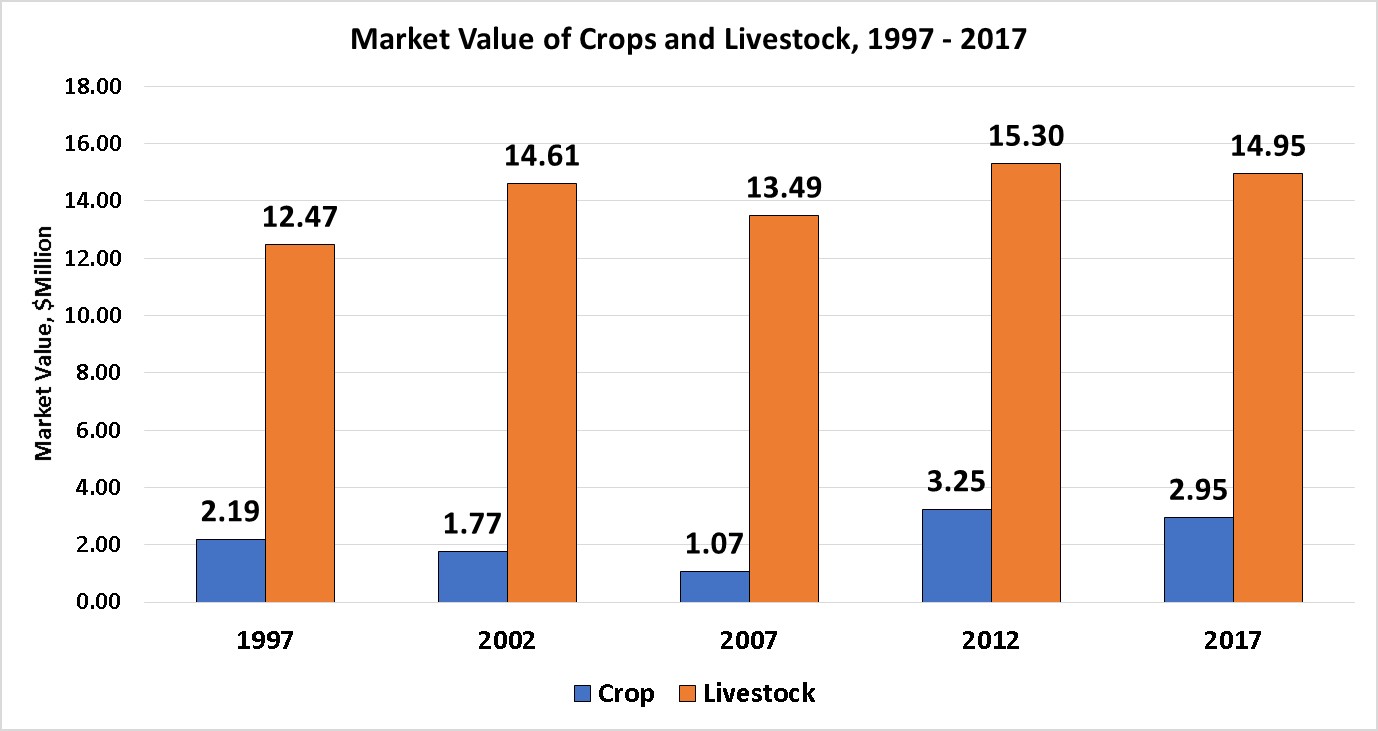
Sources: Census of Agriculture: Table 1: County Summary Highlights: 2017 and St. Louis Fed Producer Price Index
Crops and Livestock
Cattle (80%) and other crops and hay (15%) comprised 95% of total crop and livestock
sales in 2017.
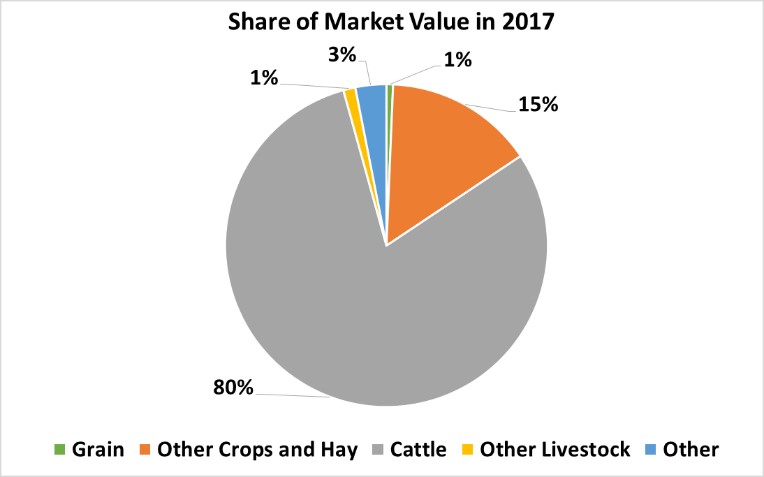
Source: Census of Agriculture: Table 2: County Summary Highlights: 2017
Farm Size by Acres
The percentage of smaller farms, less than 500 acres, increased slightly from 47%
to 48%, while the percentage of larger farms, 500 acres or more, decreased slightly
from 53% to 52% from 2012 to 2017.
|
by Acres |
2017
|
2012
|
||
|
Farms |
% |
Number of
Farms |
% |
|
|
1 to 9
|
11
|
7
|
11
|
7
|
|
10 to 49
|
15
|
10
|
14
|
9
|
|
50 to 179
|
16
|
11
|
28
|
17
|
|
180 to 499
|
31
|
21
|
24
|
15
|
|
500 to 999
|
15
|
10
|
18
|
11
|
|
1,000 or more
|
63
|
42
|
68
|
42
|
|
TOTAL
|
151
|
100
|
163
|
100
|
Farm Size by Sales
The proportion of total sales from smallest farms with less than $100,000 in sales decreased from 67% to 64%, while the proportion of total sales from the largest farms with sales of $100,000 or more increased from 33% to 36% from 2012 to 2017.
|
by Sales |
2017
|
2012
|
||
|
Farms |
% |
Number of
Farms |
% |
|
|
Less than 2,500
|
50
|
33
|
56
|
34
|
|
2,500 to 4,999
|
5
|
3
|
4
|
2
|
|
5,000 to 9,999
|
6
|
4
|
8
|
5
|
|
10,000 to 24,999
|
9
|
6
|
17
|
10
|
|
25,000 to 49,999
|
4
|
3
|
12
|
7
|
|
50,000 to 99,999
|
22
|
15
|
13
|
8
|
|
100,000 or more
|
55
|
36
|
53
|
33
|
|
TOTAL
|
151
|
100
|
163
|
100
|
Source: Census of Agriculture: Table 1: County Summary Highlights: 2017
Tillage and Land Use
The percentage of farms using no till or reduced tillage increased, while the percentage
of farms using intensive tillage or cover crops decreased from 2012 to 2017.
|
|
2017
|
2012
|
||
|
Farms |
% |
Number of
Farms |
% |
|
|
No tillage
|
6
|
4
|
1
|
1
|
|
Reduced tillage
|
5
|
3
|
3
|
2
|
|
Intensive tillage
|
11
|
7
|
17
|
10
|
|
Cover crops
|
2
|
1
|
10
|
6
|
|
TOTAL
|
151
|
|
163
|
|
Producer Profile
The county producer population was about the same age as the Montana producer population. Thirty-six percent of county producers were under 55 years of age, while 40% were over 65 years of age. Thirty-four percent of the Montana producer population were under 55, while 36% were over 65 years of age. Fifty-eight percent of producers in the county were males, while 60% of Montana producers were males. Farming was the primary occupation for 51% of county producers, while farming was the primary occupation for 50% of Montana producers.
|
|
County
|
State
|
||
|
Producers |
% |
Number of
Producers |
% |
|
|
Age
|
||||
|
18 -25
|
10
|
3
|
570
|
1
|
|
25 to 34
|
2
|
1
|
3,285
|
7
|
|
35 to 44
|
31
|
10
|
5,179
|
11
|
|
45 to 54
|
65
|
22
|
7,309
|
15
|
|
55 to 64
|
69
|
23
|
13,838
|
29
|
|
65 to 74
|
81
|
27
|
11,469
|
24
|
|
75 and older
|
38
|
13
|
5,587
|
12
|
|
Gender
|
||||
|
Male
|
173
|
58
|
28,563
|
60
|
|
Female
|
124
|
42
|
18,673
|
40
|
|
Primary Occupation
|
||||
|
Yes
|
151
|
51
|
23,847
|
50
|
|
No
|
146
|
49
|
24,314
|
50
|
|
TOTAL PRODUCERS
|
297
|
100
|
48,161
|
100
|
Source: Census of Agriculture: Table 45 Selected Operation and Producer Characteristics
Top Crops by Acre
The top crops were hay and haylage and spring wheat.
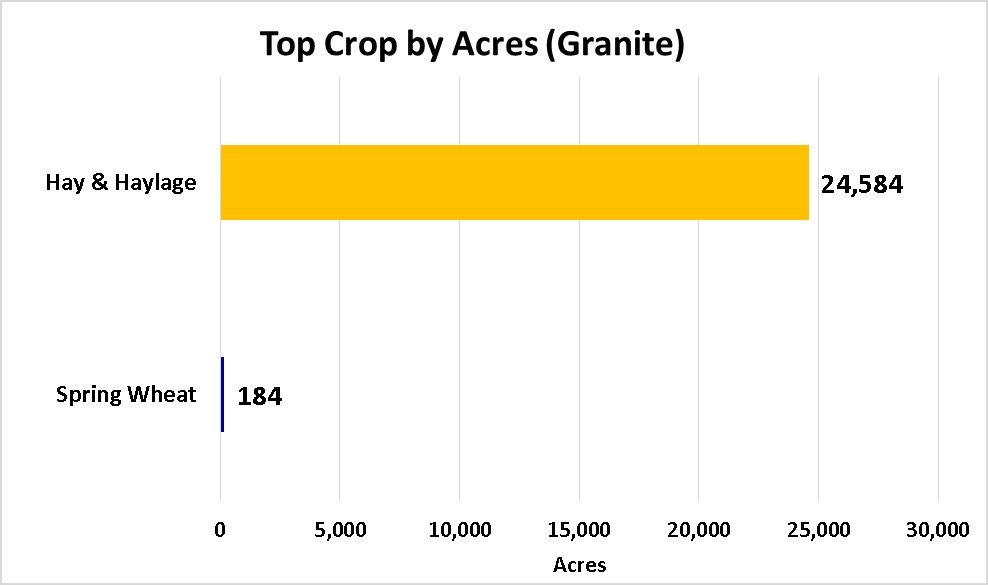
Source: Census of Agriculture: Table 1: County Summary Highlights: 2017
Top Livestock
The top livestock were cattle, sheep, and poultry (chickens-layers).
|
|
|
|
Cattle
|
19,392
|
|
Sheep
|
1,078
|
|
Chickens-Layers
|
174
|
Source: Census of Agriculture: Tables 11 (Cattle) and 13 (Sheep) and 19 (Poultry)
Employment Impact
Agricultural production employed 366 workers, or 23% of the county’s labor force.
According to IMPLAN, economic impact model, 240 of the workers were directly employed
in production agriculture. An additional 112 workers were employed in businesses
supporting agricultural production, such as feed and fertilizer dealers, and another
14 workers were employed in other related businesses, such as grocery and drugs stores.
For every 10 jobs on farms and ranches, 5 additional jobs are generated in the county.
|
|
|
Impact Multipliers |
| County Labor Force | 1,617 | |
| Direct Impact | 240 | |
| Indirect Impact | 112 | 0.47 |
| Induced Impact | 14 | 0.06 |
| Total Impact | 366 | 0.53 |
| Agriculture Share (%) | 23 |
Source: Bureau of Labor Statistics, www.bls.gov/#cntyaa and IMPLAN Estimates
Value Added Impacts
Farms and ranches generated $11.6 million of value-added, or 13% of the county’s total
gross domestic product of $90 million in 2017. According to IMPLAN, $7.6 million
was directly contributed by farmers and ranchers. An additional $3.2 million was
generated by businesses supporting agricultural production and $0.8 million was generated
by other related businesses. Each dollar of value-added in agriculture by a farmer
or rancher contributes an additional $0.52 of value-added in other sectors of the
county’s economy.
|
Impact Type |
($1 million) |
Impact Multipliers |
| County GDP* | 90.0 | |
| Direct Impact** | 7.6 | |
| Indirect Impact** | 3.2 | 0.42 |
| Induced Impact** | 0.8 | 0.10 |
| Total Impact** | 11.6 | 0.52 |
| Agriculture Share (%) | 13 |
Sources: * St. Louis Federal Reserve Bank, ** IMPLAN Estimates
References
- 2017 Census of Agriculture, National Agricultural Statistics Service, Montana, State and County Data, Volume 1, Geographic Area Series, part 26 https://www.nass.usda.gov/Publications/AgCensus/2017/Full_Report/Volume_1,_Chapter_1_State_Level/Montana/mtv1.pdf
- Department of Revenue “Montana Taxes by County in 2014“ https://mtrevenue.gov/wp-content/uploads/2018/01/2014-Taxes-by-County.pdf
- Department of Revenue “Montana Taxes by County in 2018” https://mtrevenue.gov/wp-content/uploads/2020/02/2018-Taxes-by-County.pdf
- St. Louis Federal Reserve Bank (2017). Current dollar gross domestic product by county
for Montana, retrieved from https://fred.stlouisfed.org/release/tables?rid=397&
eid=1062609&od=2017-01-01# - St. Louis Federal Reserve Bank (2020). Producer price index for all commodities, St. Louis Federal Reserve Bank, retrieved from https://fred.stlouisfed.org/series/PPIACO
- Bureau of Labor Statistics (2017), Montana labor force, retrieved from https://bls.gov/lau/#cntyaa
Montana State University Extension is an ADA/EO/AA/Veteran’s Preference
Employer and Provider of Educational Outreach.