
StreamTree
Software for mapping genetic differences between populations of freshwater organisms to the sections of streams that connect them.
Introduction
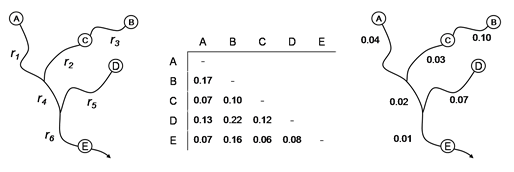
The stream tree algorithm is discussed extensively by Kalinowski et al. (2008), and I will refer the reader to the original manuscript for a complete description of the method. Here, I will briefly review the purpose of the algorithm. The left-hand panel of the figure below shows a watershed from which five populations (A, B, C, D, E) have been sampled. The sections of streams connecting these populations have been labeled (1 to 6). Genetic data was collected and a matrix of pairwise FST values was calculated (middle panel). The goal of the stream tree algorithm is to map these genetic distances onto the sections of streams connecting the populations. Results from this simple example are shown in the figure. Note that the sum of the genetic distances on the map between any two populations is equal to the observed genetic distance between the populations (e.g., DAB = 0.17 = 0.04 + 0.03 + 0.10).
Installation
Download the files here to obtain Streamtree. StreamTree runs on the Windows operating system, and requires the .NET framework to be installed. The .NET Framework is a component of the Microsoft Windows operating system used to build and run Windows-based applications. If you have a recent version of Windows, you probably already have .NET installed on your computer. You can check by clicking Start on your Windows desktop, selecting Control Panel, and then double-clicking the Add or Remove Programs icon. When that window appears, scroll through the list of applications. If you see Microsoft .NET Framework 2.0 listed, the latest version is already installed and you do not need to install it again.
If you do not have .NET already installed on your computer, the easiest way to install it is to update your operating system. This is relatively painless. To begin, open Microsoft Explorer, select Tools --> Windows Update, find Microsoft .NET framework 2.0 and install it (It will be listed under "Pick updates to install").
To “install” StreamTree download the file StreamTree.exe and the accompianying library of functions Kalinowski_library.dll. Place both of these files in a folder. Click on the StreamTree.exe file to run. To “uninstall,” simply delete both of these files.
Input files
StreamTree reads data contained in specially formatted text files. An input file for the example depicted in the figure above is shown below.
TITLE =  Example StreamTree data
SAMPLES = A, B, C, D, E
NSECTIONS = 6
A B   0.17        1     2     3
A C   0.07        1     2
A D   0.13        1     4     5
A E   0.07        1     4     6
B C   0.10        3
B D   0.22        2     3     4     5
B E   0.16        2     3     4     6
C D   0.12        2     4     5
C E   0.06        2     4     6
D E   0.08        4     5     6
The first line of the input file must begin with “TITLE = “. A brief description of the data can then follow. The second line of the file must begin with “SAMPLES = “ and must then list the samples, each separated with a comma. The order of the samples in this line is important, because it will determine the order in which StreamTree will expect the data to follow in the rest of the file. The third line of the file must begin with the text “NSECTIONS = “ and then list the number of stream sections labeled on the watershed. In this case, this is six.
The main body of the text file begins on line four. This section contains data for all of the pairwise comparisons in the data set. If there are N populations in the data, this section of the input file must contain N (N – 1) / 2 lines. Each of these lines begins with the names of the two samples being compared. Order is important here. The order of comparisons must follow the pattern used in the example above (e.g., the first comparison is between the first and second sample). The pairwise genetic distance between the two populations is listed after the names of the samples being compared (e.g., the genetic distance between populations A and B is 0.17). After that follows a list of all the stream sections that lie between the pair of populations (e.g., steam sections 1, 2, and 3 are between populations A and B). The stream sections between each pair of populations do not have to be listed in any specific order.
A few other conditions apply. Either tabs or spaces can be used to delimit data in the file. Sample names can not include spaces. There can be no extra lines in the file.
Making input files for any population genetics software is tedious. StreamTree provides a utility that takes some of the tedium out of this work. This file conversion utility is available in the Tools menu. It will open a GENEPOP file, calculate pairwise theta (Weir and Cockerham 1984) between each pair of population and create a partial input file. In the case of the example shown above, the partial input file would look like:
TITLE =  Example StreamTree data
SAMPLES = A, B, C, D, E
NSECTIONS = ???
A B   0.17
A C   0.07
A D   0.13
A E   0.07
B C   0.10
B D   0.22
B E   0.16
C D   0.12
C E   0.06
D E   0.08
The user then has to complete the file. This includes specifying the number of stream sections in line 3, and listing all of the stream sections that are between each pair of populations. This may still be a lot of work, but at least the pairwise comparisons will be in the correct order.
Common difficulties making input files
Making the input file is a lot of work, and it is easy to make mistakes while listing which sections of stream are between which populations. StreamTree can detect some errors by looking for logically impossible relationships among the populations. For example, consider populations A, B, and C. It is impossible for a section of stream to simultaneously: not be between A&B, not be between A&C, and also to not be between B&C. The following three conditions are also logiclaly impossible:
- A & B are not separated by stream section X
- B & C are not separated by stream section X
- A & C are separated by stream section X
StreamTree will give users a warning if such problems occur. Another error that is easy to make is to have two sections of stream arranged end-to-end in a tandom fashion.
Explanation of output
StreamTree performs three analyses, each of which are available from the Analysis menu. The main analysis performed by the program is to construct a stream tree. This analysis is available from the Construct Stream Tree item on the menu. An example of the output from this analysis is shown below. This example includes only part of the entire output; some output was omitted for brevity.
STREAM TREE OUTPUT

Date:  5/28/2008 12:09:39 PM
File:  STREAM TREE - Bulltrout 19.txt
Data:  Mike's bull trout data (including Clint's samples). Ten loci.


STREAM TREE

Stream      Genetic
Section     Distance

1           0.0922
2           0.0107
3           0.2925
4           0.0000
5           0.0197
6           0.0044
7           0.0658
8           0.0000
9           0.0591
10          0.0000
…

OBSERVED & FITTED GENETIC DISTANCES

            Obs D       Fitted D
AK    AR    0.3726      0.4435
AK    BO    0.1360      0.1249
AK    CE    0.2005      0.1735
AK    HA    0.3392      0.3195
AK    KI    0.0829      0.0809
AK    IS    0.2723      0.2772
AK    MC    0.1021      0.0877
AK    LI    0.1294      0.1544
AK    LO    0.1634      0.1360
AK    LQ    0.1525      0.1308
…

R squared = 0.954
The most important component of this output is the list of genetic distances for each stream section. These numbers are the genetic distances assigned to each section of stream listed under the header “STREAM TREE.” For example, stream section 1 was assigned a genetic distance of 0.0922.
The lower section of the output, headed by “OBSERVED & FITTED GENETIC DISTANCES,” lists the genetic distance observed for each pair of populations and the “fitted” genetic distance. This latter distance is the genetic distance between the populations through the stream tree. This number is calculated by summing all the genetic distances assigned to the stream sections that fall between the two populations. It probably would be a good to graph the observed and fitted genetic distances for all the pairs of populations and check to see if any populations show large differences between observed and fitted values.
The last piece of output is the R2 value for the stream tree. A value close to 1.0 indicates an excellent fit of the stream tree to the genetic distance matrix from with it was constructed.
StreamTree performs two more analyses. First, it will construct a neighbor-joining tree from the genetic distance data contained with the input file, and output this tree in a text file that can be read by the computer program TreeView (Page 1996). Second, it will compare the observed and fitted values for that neighbor-joining tree and calculate a R2 value for the tree.
Citation
The following citation should be used when citing StreamTree:
- Kalinowski ST, MH Meeuwig, SR Narum, ML Taper (2008) Stream trees: a statistical method for mapping genetic differences between populations of freshwater organisms to the sections of streams that connect them. Canadian Journal of Fisheries and Aquatic Sciences (65:2752-2760). pdf