Wool Analysis FAQ
Click here to download a pdf of this information.
How should I prepare my samples?
We need a sample, approximately 2 inches by 2 inches shorn close to the skin from the side of the animal. Put wool samples in individual Ziploc bags with animal identification/tag number, age, and breed written on the bag or on a sheet of paper in bag. Mail Ziploc bags in large envelope or box with the above submission form and ship them to the Montana Wool Lab.
What do you get with your wool analysis?
The OFDA 2000 results include data for the fiber diameter (micron average), the standard deviation for fiber diameter, coefficient of variation for the fiber diameter, comfort factor, and staple length.
What do the additional services provide?
The additional services we offer at low cost include sending the above results with a histogram and/or micron profile (see below for an explanation of these and examples). If you opt to get the additional service of having a laboratory technician measure staple length by ruler, results will include staple length measured in inches in replacement of the staple length measurement generated by the OFDA 2000 (in millimeters).
What is a Histogram?
A histogram is a graph that shows the individual fiber diameter measurements of a sample. The fiber diameter of each fiber measurement is put into “bars” on the chart, usually in one-micron groups. The higher the height of the bar the more fibers have been measured in that micron group. The histogram is a quick and easy way to view the variability of fiber diameter within a sample.
What is a Micron Profile?
The micron profile graphs the variation of the fiber diameter along the staple during the growing season. Individual wool fibers are measured every 5 millimeters along the fiber. The left side corresponds to the fiber tip; right side fiber base (closest to the skin). In addition, minimum and maximum micron, and finest point from the tip (FPFT) are reported.
This information is useful to determine how environment differences are affecting
the average fiber diameter during the growing season. Drastic changes in fiber diameter
often result in weak or tender wool that breaks easily when stretched or processed.
With the micron profile information, growers can make management decisions that benefit
wool growth throughout the year. A flat line indicates more uniform wool grown throughout
the year.
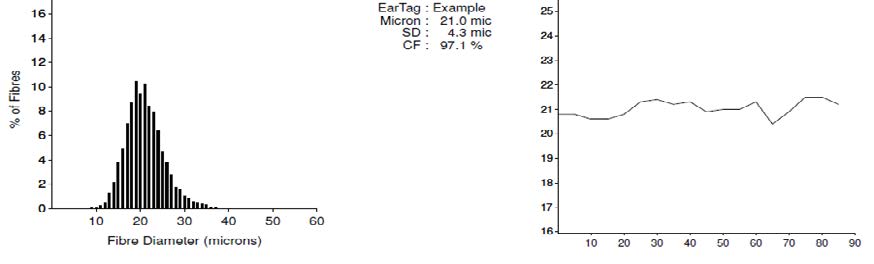
Example of a HIstogram Example of a Micron Profile