
Montana Movers Study 2021 Report

Funded By:


Executive Summary
Introduction
Research Design, Methods and Analysis
Description of Mailing List Sample
Population, Sample and Survey Administration
Limitations
Survey Structure and Content
Analytical Approach
Two Groups of Interest
Moved to New Zip Code
Rural and Metro/Micro
Workforce
Results
Respondent Characteristics
Reasons for Moving
Ratings of New Community
Use of Local Amenities
Engagement with New Community
Demographics
Metro/Micro compared to Rural
Analysis of MT Workforce Compared to MN
Appendix
Executive Summary
Montana has experienced some of the fastest growth of any state in the past decade.1 In-migration accelerated in response to the COVID-19 pandemic which has caught the attention of leaders and everyday citizens alike. Understanding more about who is moving in and why can help local leaders make decisions on how to allocate resources in response to the changes they see. This survey will give a more complete picture of who is moving to Montana communities, which we hope advances the discussion surrounding newcomers going forward.
We learned that people moved to enjoy the quality of life offered by Montana communities and movers seem to be quite satisfied with their new community. The top reasons given for moving include: to have better access to the outdoors, to live in a less congested place, to take advantage of a slower pace of life, and to live in a smaller community. A smaller number of people indicated that financial oriented reasons, such as a job, lower cost of living or lower priced housing, were important to their decision to move. Only about a third of people said they moved primarily for a job, which was similar to what was found in the original iteration of this study conducted in Minnesota in March and April of 2019.
Newcomers indicate that they frequently take advantage of the amenities of their new community such as rivers, trails, community events and the like. They report high levels of engagement in their new community, including volunteerism, attendance at public meetings and establishing social connections in their new community.
Housing availability is often a challenge in rural places as well as metro/micro communities. The availability of housing was one of the lowest ranked factors across all aspects of the survey. Only 32 percent said they moved to find lower cost housing which leads to the question, is lower cost housing not available in Montana?
Most people moving to Montana communities are new to that town, meaning they have never lived in the new community before. Contrary to common belief, people moving to rural communities are significantly less likely to have ever lived there before. People moving to metro/micro communities are significantly more likely to have lived there before.
The sense of welcoming a community provides has a significant impact on whether people think they will stay in a community. Those that rate a community low for welcoming say they are unlikely to stay in the community long-term, which has significant implications for recruiting workforce or remote workers for Montana employers. Being welcoming to newcomers is free and can have a significant impact on retaining workforce or new residents.
Not all movers to Montana communities are coming from out-of-state. In our study, about half of respondents moved from within the state and about half moved from outside of the state. Very few respondents (about 4 percent) said their move was impacted by the COVID-19 pandemic.
Respondents to this survey have higher incomes and higher levels of education than the median income and education level of Montana residents as measured by the U.S. Census Bureau. This is likely a result, in part, because our mailing list was drawn from property ownership records.
In summary, the data from this survey indicates that the people moving into Montana communities are moving for the same reasons long-time residents enjoy living here. Newcomers are seeking the quality of life that Montana communities offer, and they are actively taking advantage of the amenities that set life in Montana apart from other places.
Introduction
The story told about Montana’s rural small towns tends to be one of economic decline, population loss and despair. Despite the negative narrative, our rural communities remain intact, thanks to the many volunteers that run local government and civic organizations. Desire to escape cities has increased in recent years and anecdotal evidence of in-migration due to impacts of the COVID-19 pandemic has drawn even more attention to who is moving to Montana’s communities.2
Ben Winchester, Rural Sociologist at University of Minnesota Extension Center for Rural Vitality, presented the keynote at the first Reimagining Rural conference in the Fall 2019 hosted by Montana State University Extension, Montana Community Foundation, and the Governor’s Office. Winchester’s talk, “Rewriting the Rural Narrative”, highlighted positive stories about rural life including the data from his “Brain Gain” research that shows people are moving into rural communities to enjoy the quality of life these places offer. Hearing these positive stories of rural life had a significant impact on the audience in 2019 and audiences in the next two iterations of the Reimagining Rural program held virtually in 2020 and 2021.
Despite how welcome it was to hear this positive story of rural life, Montana audiences were skeptical that Winchester’s data from a study of rural Minnesota would hold true in Montana. After encountering resistance from some local leaders in rural communities about implementing changes based on Winchester's data, it became clear that replicating this research in Montana would be a worthy goal to show who is moving to rural communities, why they are moving there and how satisfied they are once they get there. It is clear from recent news reports of housing shortages and business relocations and expansions that people have been moving to Montana’s larger communities. It is less known that people are also moving to Montana’s rural communities, due in part to the dominant media stories of decline and despair surrounding Montana’s rural towns.
The Montana survey, which is a close replication of Winchester’s “Brain Gain” study, was sent to people moving to small and large communities across the state to find out if there are any differences between people moving to these communities. Winchester conducted his original “Brain Gain” study in 2010.3 A second study was conducted by Winchester and colleagues in the fall of 2019 which is the source of the Minnesota data included in this paper.4
We hope this research helps inform discussions about the role and value of newcomers, particularly in light of the increased in-migration observed since the pandemic. It should be noted that this survey was sent out in the spring of 2021 (late April and early May) at the end of the time when people were quarantining at home. The timing may have helped boost our response rate; however only about a quarter of respondents moved during the pandemic and most of them likely had their plans set prior to the full effect of the pandemic. We believe that the impact of the pandemic on the answers given to the survey is minimal.
A sincere thanks to Montana Community Foundation, our lead sponsor of this research for sharing the desire to execute our own “Brain Gain” study; and to the Montana Farm Bureau Foundation for supporting the study to help local leaders understand more about maintaining the vitality of our rural communities. We are thankful for the vision of these two organizations for making this study possible.
Research Design, Methods and Analysis
Study Design and Data Collection
The initial approach used for this study was the replication and extension of research done by the University of Minnesota Extension’s Center for Community Vitality. That research, which surveyed newcomers to rural communities throughout the state, sought information about the attributes of the movers and their households, the factors that contributed to their move into those rural communities, and their perceptions of the communities they moved into. Building on the research conducted in Minnesota, the primary component of the current research in Montana was a similar survey of newcomers to communities throughout Montana.
In late April and early May 2021, 9,000 paper surveys were sent to a mailing list that consisted of parcels with a home in Montana that had a change of ownership in the previous five years provided by the Montana Department of Revenue. Approximately two weeks after the survey was sent, a reminder postcard with an online link to complete the survey was sent to the same mailing list. Surveys were sent from the Human Ecology Learning & Problem Solving (HELPS) Lab at Montana State University-Bozeman with a return address from Montana State University Extension. Surveys were sent to all 56 counties in the state; however, no surveys were returned from Powder River and Petroleum counties. Of the surveys sent, 152 were unable to be delivered due to bad addresses.
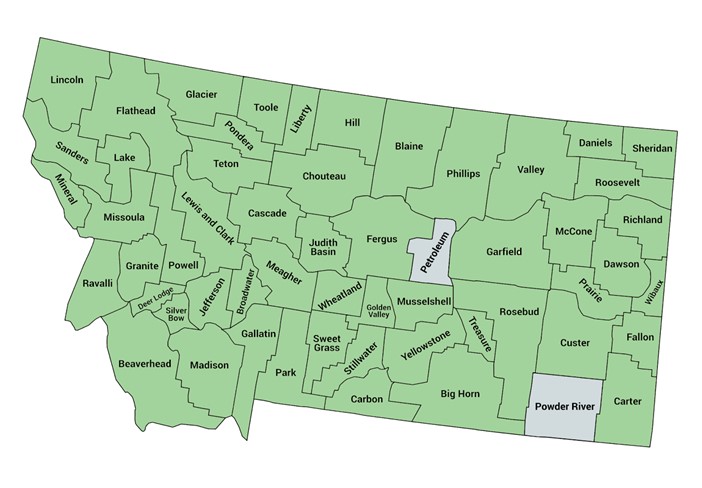
Table 1: Summary of Survey Responses
|
Total surveys mailed out |
9,000 |
|
Total undeliverable as addressed |
152 |
|
Total number of survey responses |
1,765 |
|
Response rate for all returned surveys |
19.9% |
|
Error for all returned responses |
+/-2.29% |
Description of Mailing List Sample
Montana’s relatively unique centralized system for property tax collection means that the Montana Department of Revenue has a centralized database of property owners. The Montana Department of Revenue created a mailing list for this research project in January 2021, which included parcels across the state with a residence and that had a change of ownership in the previous five years.
A total of 83,046 addresses were included in the original file from Revenue. Using the zip codes of the property address, the research team coded the addresses into rural or metropolitan/micropolitan areas using U.S. Census designations.5 Of all addresses in the original list from Montana Department of Revenue, 60,536 were in the state’s 10 counties that are included in the U. S. Census Bureau’s definition of Metropolitan and Micropolitan statistical areas. Only about one third or 22,610 residential properties were in the remaining 46 counties that make up Non-Metropolitan areas in Montana. When addresses were selected for mailing, an equal proportion of metropolitan/micropolitan and non-metropolitan were chosen. Overall, there were 907 responses from the rural addresses and 856 from the metropolitan/micropolitan addresses.
Population, Sample and Survey Administration
For this study, we’ve defined “newcomers” as anyone who moved into any community in Montana within the past five years. Although the focus of the study is on newcomers to rural communities, communities of all sizes were included in the study. Popular perceptions of what constitutes “rural” vary significantly within the public and can deviate substantially from technical definitions of the term, including that used by the Office of Management and Budget (OMB). OMB defines rural as areas which are outside existing metro- or micropolitan communities and/or have populations of fewer than 10,000 residents. Because there are relatively few metro- and micropolitan communities in Montana and because even those communities are often viewed as being “rural” by newcomers from much larger and densely populated areas, we have defined “newcomers” as anyone moving into a community in Montana within the last five years.
The population we drew our sample from was a comprehensive list of title transfers from the Montana Department of Revenue that had taken place within our designated time period. We did exclude “quick claim” title transfers on the assumption that those property transfers were likely to be between family members, rather than purchase by new owners. Our sampling strategy used households as the unit of analysis and focused on those households that have moved into a new or different zip code in Montana sometime in the last 5 years. We then weighted the sample to ensure sufficient presence of households from rural communities (based on Census designation codes) in the data, knowing that there would be more title transfers in larger communities simply based on the number of properties in those larger communities.
Our final sample was 9,000 households. The survey (described below) was distributed by mail and included a prepaid return envelope. Reminder postcards were sent to all recipients two weeks after the survey was sent. Based on the results of prior research conducted in Montana, we anticipated a likely response rate of roughly 12%, which would in turn result in a +/- 3% error rate. Once the survey was distributed, 152 of 9,000 surveys were returned as undeliverable. The actual response 1,765 partially or fully completed responses of 8,848 delivered surveys. This yielded a 19.9% response rate and a +/- 2.29% error rate for all responses received which included 561 responses from people that moved from within the same zip code. The primary group that was examined from this survey was the 1,204 responses that were from people that moved to a new zip code. Of this group, we received a 13.62 % response rate and a +/- 3.09% error rate.
Limitations
The sampling strategy utilized had two primary limitations. First, because it was based on title transfers, it did not have any systematic inclusion of renters. Further, reservation and tribal communities were not captured in this dataset because these addresses are not subject to Montana property tax and are not in the Department of Revenue’s centralized database. Moreover, as previously discussed the full impact of Covid-19 on decisions cannot be determined due to the timing of the survey.
Survey Structure and Content
The structure and content of the survey was designed to parallel and augment the prior research that had been conducted in Minnesota, but also to reflect Montana context and research team questions. The survey was structured around six categories of questions:
- Characteristics and attributes of the move - timing, prior residence based on zip code, personal or family history with the destination community, length of prior residence, Covid factors influencing the move;
- Factors considered before the move - economic, physical or environmental, social;
- Important features of the destination community - social, governance (local government or schools), infrastructure (housing, broadband, health care), natural environment, economic climate and conditions;
- Activities and features experienced since arrival - social, civic, recreational;
- Demographics - household characteristics, age, race, ethnicity, education, income;
- Workforce attributes - working/retired, physical or telecommuting, job type/industry.
A complete copy of the survey can be found in the Appendix.
Analytical Approach
The analytical approach used was primarily descriptive and focused on identifying trends and patterns within the overall sample of newcomers, but particularly within the workforce subgroup, those who moved to rural destination communities, and movers who came from outside Montana. The analysis also looked for patterns where subgroups intersected, for example within movers who are in the workforce and moved to rural communities.
Two Groups of Interest
The high response rate for this survey enabled a deeper analysis of specific groups of interest by the research team and other stakeholders. This report examines responses from individuals who indicated that they moved to a new zip code. An examination of these newcomers plus the additional 561 respondents that indicated they moved within the same zip code is planned for a later date. This report examines respondents in two categories of interest:
- Those that moved to rural places and those that moved to larger cities,
- Those in the workforce, defined as ages 18-64 years old,
In summary, this report focuses on those that moved to a new zip code as a whole group and segmented by size of community and workforce age.
Moved to New Zip Code
Respondents were asked to write in the zip code of their current residence. Of the 1,765 total responses, 561 indicated that their previous residence was in the same zip code. Since our objective was to study people moving into a new community, we have excluded those that moved within the same zip code from this analysis. The group that returned the survey but had moved within their same zip code may provide interesting insights about movers and will be analyzed at a later date. A total of 1,204 responses were received from respondents indicating they moved to a new zip code. Of the 1,204 respondents that moved to a new zip code, 534 (47 percent) moved from within Montana and 590 (52 percent) moved from 47 other states.6 A total of 10 (0.8 percent) respondents moved from six other countries, with the highest representation coming from Germany. There were 15 illegible and 55 blank responses to the question.
Table 2: The Top Ten States for Newcomers
|
Top Ten States (Newcomers) |
Number of Respondents |
Percentage |
|
Montana |
534 |
44% |
|
California |
94 |
8% |
|
Washington |
94 |
8% |
|
Colorado |
57 |
5% |
|
Oregon |
33 |
3% |
|
Idaho |
32 |
3% |
|
Texas |
24 |
2% |
|
Wyoming |
24 |
2% |
|
Nevada |
18 |
1% |
|
Utah |
18 |
1% |
This group is included in the analysis as a baseline of all movers into Montana communities to help us understand the experience of people who chose to move into a new community.
Rural and Metro/Micro
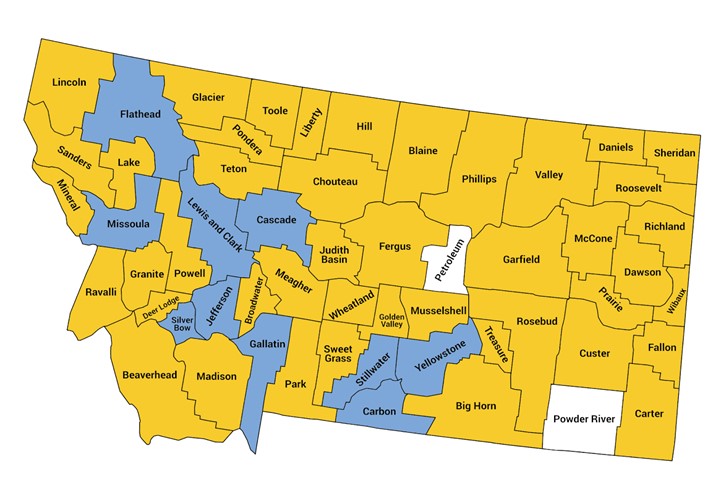
To understand differences in those who chose to move to large and small communities in Montana, survey results from the 1,204 newcomers were separated into two categories (Rural and Metro/Micro). The map below illustrates the two categories of counties and how they are distributed in Montana. Predominantly rural counties are designated in yellow and metro/micro in blue. The U.S. Census designation for Metropolitan and Micropolitan counties were used to define the “Metro/Micro” areas of Montana7. All other areas in the state are defined as Non-metropolitan, which are also predominantly rural areas. An equal number of surveys were sent to metro/micro and rural areas of Montana to receive enough responses from each area to examine any potential differences between these groups. Given that our mailing list had nearly three times more addresses in metro/micro areas than rural areas, oversampling of rural addresses was required. The oversampling of rural areas was effective as there were nearly equal response rates from rural and metro/micro areas, including 631 (52%) responses from rural areas and 573 (48%) from metro/micro areas.
Workforce
Analyzing motivations of the workforce was the primary research question for the University of Minnesota Extension study on which this study was based.8 To be able to compare our findings with the Minnesota study, we examined the workforce age group. Respondents were included in the Workforce group if the primary respondent was between the ages of 18 and 64 which included a total of 811 respondents. Of the respondents in this group, 392 moved from within Montana and 400 moved into the state from 39 other states. A total of 19 respondents moved to Montana from other countries, with the highest representation coming from Germany.
Table 3: Workforce Newcomers by State
|
Top Ten States (Workforce) |
Respondents |
Percentage |
|
Montana |
392 |
48% |
|
California |
57 |
7% |
|
Washington |
57 |
7% |
|
Colorado |
39 |
5% |
|
Oregon |
21 |
3% |
|
Idaho |
21 |
3% |
|
Texas |
20 |
2% |
|
Georgia |
18 |
2% |
|
Wyoming |
16 |
2% |
|
Utah |
15 |
2% |
Results
Respondent Characteristics
The following section includes data from page one of the surveys which asks about the respondent’s current residence, their previous residence, timing of their move, length of time at previous residence and if their move was for a job or impacted by the COVID pandemic.
When did you move?
Roughly equal numbers of respondents said they moved in 2019 and 2020 compared to those that moved in 2018. Those that said they moved before 2016 fell outside the parameters of the study and so were omitted from the data tabulations.
Table 4: Newcomers Year Moved by Relocation Place (Rural, Metro/Micro), Workforce Group, and Zip Code Change
|
Year moved to current community |
Rural |
Metro/Micro |
Workforce |
Moved to new zip |
|
2021 |
2% |
0.87% |
2% |
1% |
|
2020 |
24% |
26% |
26% |
25% |
|
2019 |
24% |
26% |
23% |
25% |
|
2018 |
24% |
17% |
22% |
21% |
|
2017 |
16% |
17% |
16% |
17% |
|
2016 |
5% |
7% |
6% |
6% |
|
Before 2016 |
5% |
5% |
5% |
5% |
|
Blank |
0.16% |
0.17% |
0.25% |
– |
What month did you move?
June, July, August and October were the months with the highest percentage reporting a move in each of the four groups.
Table 5: Newcomers Month Moved by Relocation Place (Rural/Metro), Workforce Group, and Zip Code Change
|
Month moved to current residence |
Rural |
Metro/Micro |
Workforce |
Moved to new zip |
|
January |
3% |
7% |
5% |
5% |
|
February |
4% |
2% |
3% |
3% |
|
March |
5% |
6% |
5% |
5% |
|
April |
7% |
8% |
7% |
7% |
|
May |
9% |
10% |
9% |
9% |
|
June |
10% |
10% |
10% |
10% |
|
July |
14% |
12% |
14% |
13% |
|
August |
13% |
14% |
13% |
13% |
|
September |
9% |
8% |
7% |
9% |
|
October |
12% |
10% |
11% |
11% |
|
November |
8% |
8% |
8% |
8% |
|
December |
5% |
6% |
6% |
6% |
Have you ever lived in this community before?
Most people moving to Montana communities had never lived in that community before. Of those that moved to a new zip code, 73 percent said they had never lived there before. Only 27 percent of respondents had ever lived in the community before. Of those in the Workforce group, only 28 percent said they had lived there before and 21 percent said that their spouse had lived there before. The percentage who had never lived there before was higher for those that moved to a rural area than for those that moved to a metro/micro area. For those moving to rural areas, 76 percent said they had never lived there before compared to 66 percent who moved to metro/micro areas. A similar pattern was reported for spouses with respect to rural and metro/micro areas.
Survey questions five and six asked if the respondent or their spouse/partner had ever lived in the area before. Combining the answers to these two questions, it was determined that 34 percent of households in the Workforce group had never lived in the community before.
Table 6: Newcomers Returnees by Relocation Place (Rural/Metro), Workforce Group, and Zip Code Change
|
Returnees (Self) |
Rural |
Metro/Micro |
Workforce |
Moved to new zip |
|
No |
76% |
66% |
70% |
73% |
|
Yes |
22% |
32% |
28% |
27% |
|
Blank |
3% |
2% |
2% |
|
Returnees (spouse/partner) |
Rural |
Metro/Micro |
Workforce |
Moved to new zip |
|
No |
64% |
54% |
60% |
61% |
|
Yes |
14% |
24% |
21% |
19% |
|
I do not have a spouse/partner |
19% |
20% |
16% |
20% |
|
Returnee (anyone in household) |
Rural |
Metro/Micro |
Workforce |
Moved to new zip |
|
No |
– |
– |
64% |
– |
|
Yes |
– |
– |
34% |
– |
How long did you live in your previous community?
People moving to Montana communities had lived in their previous communities for a long time. There were slight differences between people moving to rural and metro/micro areas. People moving to rural places were more likely to have lived in their previous community for more than 10 years compared to those moving to a Metro/Micro area. People in the Workforce age group were more likely to have lived in their previous community for 2-10 years compared to those not in the Workforce Group.
Table 7: Newcomers Previous Community by Relocation Place (Rural/Metro), Workforce Group, and Zip Code Change
|
Years in Previous Community |
Rural |
Metro/Micro |
Workforce |
Moved to new zip |
|
1 year or less |
7% |
6% |
8% |
7% |
|
2-10 years |
39% |
46% |
50% |
43% |
|
More than 10 years |
52% |
46% |
39% |
50% |
|
Blank |
2% |
2% |
3% |
– |
Did you move for a job?
Most survey respondents did not move to their new community primarily for a job. The largest percentage of respondents who did move for a job were those in the Workforce age group of 18-64 years of age. Those moving to rural areas (75%) were the highest percentage of group respondents moving to their new community primarily for a job.
Table 8: Newcomers Job Move by Relocation Place (Rural/Metro), Workforce Group, and Zip Code Change
|
Moved primarily for a Job |
Rural |
Metro/Micro |
Workforce |
Moved to new zip |
|
No |
75% |
69% |
63% |
74% |
|
Yes |
22% |
30% |
35% |
26% |
|
Blank |
3% |
2% |
2% |
– |
Was your move COVID related?
Only four percent of people said their move was motivated by the pandemic. This is likely because approximately 25% of respondents who completed the survey moved during the pandemic (between 2020 and 2021).
Table 9: Newcomers Covid-related by Relocation Place (Rural/Metro), Workforce Group, and Zip Code Change
|
Was your move motivated by the COVID Pandemic? |
Rural |
Metro/Micro |
Workforce |
Moved to new zip |
|
No |
94% |
94% |
94% |
96% |
|
Yes |
3% |
4% |
4% |
4% |
|
Blank |
3% |
2% |
2% |
– |
Reasons for Moving
The next table indicates the relative importance of various factors to movers when considering a move, which was a question included on page two of the survey instrument. The option for answering this question was a five-point scale which included Very Important, Important, Moderately Important, Slightly Important and Not Important.
Table 10 shows the combined responses of those who answered “Very Important” and “Important” to the following question: “When you chose to move to this community, how important were the following factors for your household?”
Table 10: Newcomers Factor for Moving by Relocation Place (Rural/Metro), Workforce Group, and Zip Code Change
|
Move Factors |
Rural |
Metro/Micro |
Workforce |
Moved to new zip |
|
To live closer to relatives |
41% |
42% |
38% |
43% |
|
To live closer to friends |
15% |
17% |
22% |
16% |
|
To find lower priced housing |
32% |
29% |
20% |
32% |
|
To buy available land |
29% |
22% |
33% |
27% |
|
to find higher quality schools |
10% |
19% |
28% |
15% |
|
To find a lower cost of living |
32% |
27% |
31% |
31% |
|
To find a safer place to live |
44% |
37% |
44% |
42% |
|
To find a good environment for raising children |
27% |
39% |
43% |
34% |
|
Take advantage of a slower pace of life |
58% |
43% |
53% |
53% |
|
To live in a smaller community |
58% |
41% |
51% |
52% |
|
To live in a larger community |
3% |
7% |
5% |
5% |
|
To live among people with similar values |
42% |
38% |
41% |
42% |
|
To find a less congested place to live |
62% |
48% |
57% |
58% |
|
To find a higher paying job |
10% |
19% |
19% |
15% |
|
To find a job that matches my skills |
16% |
28% |
30% |
23% |
|
To find a better job for my spouse/partner |
9% |
15% |
17% |
13% |
|
To find a job that allowed for a better work-life balance |
20% |
29% |
35% |
25% |
|
To take on a new job |
19% |
25% |
30% |
23% |
|
To start my own business |
6% |
7% |
9% |
7% |
|
To retire |
41% |
31% |
24% |
38% |
|
To take advantage of healthcare facilities |
14% |
18% |
10% |
17% |
|
To find a desirable natural environment (to have better access to the outdoors) |
64% |
60% |
66% |
64% |
Across all groups, quality-of-life factors were more important for movers compared to financial oriented factors. The following charts show move factors in order of importance by group. The highlighted sections emphasize the top and bottom five factors by importance.
Table 11: Newcomers Quality of Life per Group
Rural |
Metro/Micro |
||
|
To find a desirable natural environment (to have better access to the outdoors) |
64% |
To find a desirable natural environment (to have better access to the outdoors) |
60% |
|
To find a less congested place to live |
62% |
To find a less congested place to live |
48% |
|
Take advantage of a slower pace of life |
58% |
Take advantage of a slower pace of life |
43% |
|
To live in a smaller community |
58% |
To live closer to relatives |
42% |
|
To find a safer place to live |
44% |
To live in a smaller community |
41% |
|
To live among people with similar values |
42% |
To find a good environment for raising children |
39% |
|
To retire |
41% |
To live among people with similar values |
38% |
|
To live closer to relatives |
41% |
To find a safer place to live |
37% |
|
To find lower priced housing |
32% |
To retire |
31% |
|
To find a lower cost of living |
32% |
To find a job that allowed for a better work-life balance |
29% |
|
To buy available land |
29% |
To find lower priced housing |
29% |
|
To find a good environment for raising children |
27% |
To find a job that matches my skills |
28% |
|
To find a job that allowed for a better work-life balance |
20% |
To find a lower cost of living |
27% |
|
To take on a new job |
19% |
To take on a new job |
25% |
|
To find a job that matches my skills |
16% |
To buy available land |
22% |
|
To live closer to friends |
15% |
to find higher quality schools |
19% |
|
To take advantage of health care facilities |
14% |
To find a higher paying job |
19% |
|
To find higher quality schools |
10% |
To take advantage of healthcare facilities |
18% |
|
To find a higher paying job |
10% |
To live closer to friends |
17% |
|
To find a better job for my spouse/partner |
9% |
To find a better job for my spouse/partner |
15% |
|
To start my own business |
6% |
To start my own business |
7% |
|
To live in a larger community |
3% |
To live in a larger community |
7% |
Workforce |
Moved to new zip |
||
|
To find a desirable natural environment (to have better access to the outdoors) |
66% |
To find a desirable natural environment (to have better access to the outdoors) |
64% |
|
To find a less congested place to live |
57% |
To find a less congested place to live |
58% |
|
Take advantage of a slower pace of life |
53% |
Take advantage of a slower pace of life |
53% |
|
To live in a smaller community |
51% |
To live in a smaller community |
52% |
|
To find a safer place to live |
44% |
To live closer to relatives |
43% |
|
To find a good environment for raising children |
43% |
To find a safer place to live |
42% |
|
To live among people with similar values |
41% |
To live among people with similar values |
42% |
|
To live closer to relatives |
38% |
To retire |
38% |
|
To find a job that allowed for a better work-life balance |
35% |
To find a good environment for raising children |
34% |
|
To find lower priced housing |
33% |
To find lower priced housing |
32% |
|
To find a lower cost of living |
31% |
To find a lower cost of living |
31% |
|
To find a job that matches my skills |
30% |
To buy available land |
27% |
|
To take on a new job |
30% |
To find a job that allowed for a better work-life balance |
25% |
|
To buy available land |
28% |
To find a job that matches my skills |
23% |
|
To retire |
24% |
To take on a new job |
23% |
|
To live closer to friends |
22% |
To take advantage of healthcare facilities |
17% |
|
To find higher quality schools |
20% |
To live closer to friends |
16% |
|
To find a higher paying job |
19% |
to find higher quality schools |
15% |
|
To find a better job for my spouse/partner |
17% |
To find a higher paying job |
15% |
|
To take advantage of health care facilities |
10% |
To find a better job for my spouse/partner |
13% |
|
To buy or begin my own business |
9% |
To start my own business |
7% |
|
To live in a larger community |
5% |
To live in a larger community |
5% |
Discussion Metro/Micro Move Factors
Analysis was completed comparing participants' reasons for moving to new communities as indicated by those who said they “Strongly Agree” or “Agree” with the statement. Among individuals moving to metro/micro communities in Montana the most important move factors were finding a desirable natural environment and access to the outdoors (60%), finding a less congested place to live (48%), taking advantage of a slower pace of life (43%), living closer to relatives (42%), and living in a smaller community (41%). Similarly, the most important factors among individuals moving to rural areas were very similar. Four of the top five top factors were the same -- finding a desirable natural environment and access to the outdoors (64%), finding a less congested place to live (62%), taking advantage of a slower pace of life (58%), and living in a smaller community (58%). The only difference is that 44% of individuals moving to rural communities said that finding a safer place to live was important.
In contrast, living in a larger community, starting a business, and finding a better job for spouse/partner were the least popular reasons for moving to both metro/micro and rural areas. Among individuals moving to metro/micro areas, living closer to friends (17%) and taking advantage of health care facilities (18%) were the least important reasons. For individuals moving to rural areas, finding a higher paying job (10%) and finding higher quality schools (10%) were less important compared to those moving to metro/micro areas. The results for those moving to metro/micro areas were finding a higher paying job (19%) and finding higher quality schools (19%).
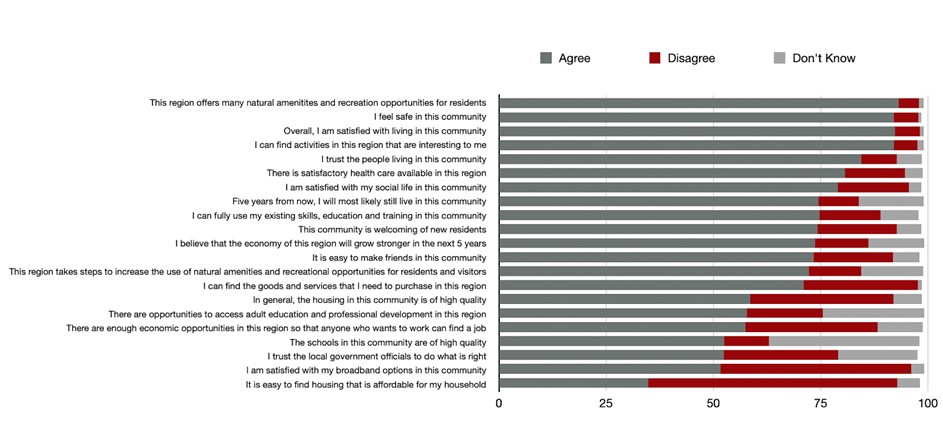
Ratings of New Community
Overall, movers seemed to have high levels of satisfaction with their new community. The following tables indicate how well movers like various aspects of their new community. The percentage included in Table 12 is a combination of respondents who answered, “Strongly Agree” and “Agree” to the following question: For each of the following statements, please indicate your level of agreement or disagreement. By “community” we mean the city or town where you live now. By “region” we mean the larger area where you work, shop, and play. The option for answering this question was a four-point scale which included Strongly Agree, Agree, Disagree, Strongly Disagree. There was also the option of Don’t Know.
Table 12: Newcomers Community Ratings by Relocation Place (Rural/Metro), Workforce Group, and Zip Code Change
|
Community Ratings |
Rural |
Metro/Micro |
Workforce |
Moved to new zip |
|
I feel safe in this community |
92% |
90% |
92% |
93% |
|
Overall, I am satisfied with living in this community |
92% |
92% |
92% |
93% |
|
I trust the people living in this community |
83% |
83% |
84% |
85% |
|
The schools in this community are of high quality |
40% |
46% |
53%* |
50% |
|
There is satisfactory health care available in this region |
79% |
85% |
81% |
83% |
|
Five years from now I will most likely still live in this community |
76% |
72% |
75%** |
75%** |
|
This region offers many natural amenities and recreation opportunities for residents |
92% |
93% |
93% |
94% |
|
I can fully use my existing skills, education and training in this community |
64% |
70% |
75% |
70% |
|
I can find activities in this region that are interesting to me |
90% |
91% |
92% |
92% |
|
This community is welcoming of new residents |
72% |
74% |
74% |
75% |
|
I am satisfied with my social life in this community |
77% |
79% |
79% |
80% |
|
This region takes steps to increase the use of natural
amenities and recreational opportunities for
residents and visitors
|
66% |
43% |
72% |
72% |
|
It is easy to make friends in this community |
71% |
73% |
73% |
74% |
|
I trust local government officials to do what is right |
49% |
53% |
52% |
52% |
|
There are opportunities to access adult education and
professional development in this region
|
45% |
68% |
58%*** |
57%*** |
|
I can find the goods and services that I need to purchase
in this region
|
62% |
80% |
71% |
72% |
|
In general, the housing in this community is of high quality |
50% |
68% |
59% |
60% |
|
There are enough economic opportunities in this region
so that anyone who wants to work can find a job
|
46% |
65% |
57% |
56% |
|
I believe that the economy of this region will grow stronger
in the next 5 years
|
64% |
79% |
74% |
72% |
|
It is easy to find housing in this community that is affordable
for my household
|
36% |
35% |
35% |
37% |
|
I am satisfied with my broadband options in this community |
53% |
55% |
52% |
55% |
Tables 13, 14, and 15 are presented for comparison of community ratings.
Table 13: Newcomers Rural Community
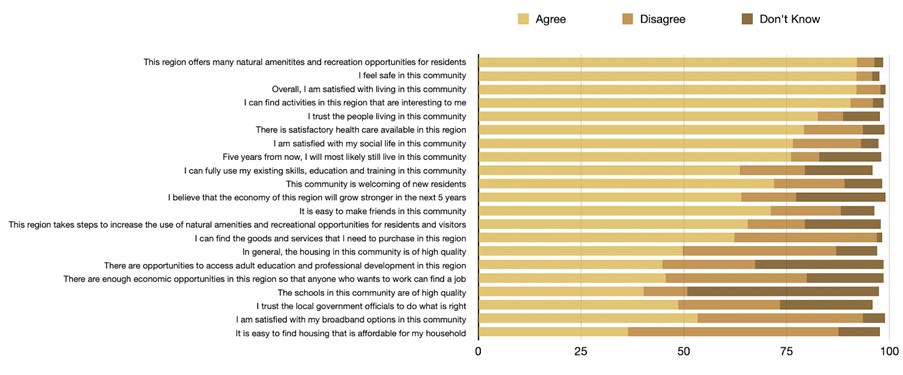
Table 14: Newcomers Metro/Micro Community
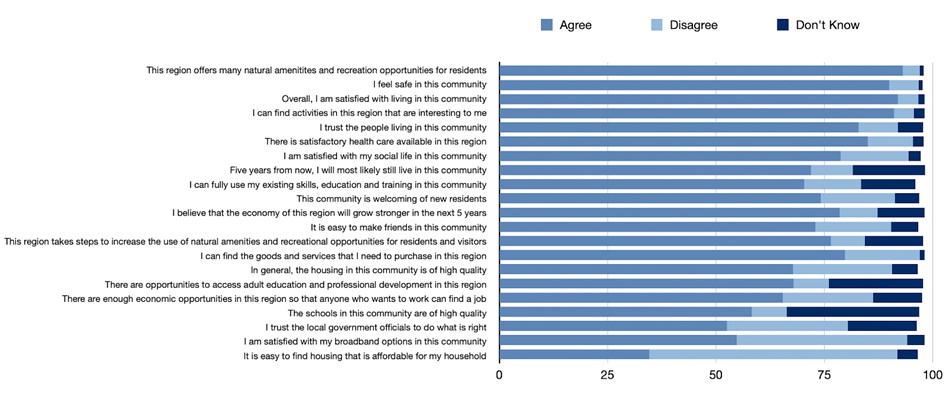
Table 15: Newcomers Workforce Community
Use of Local Amenities
The option for answering this question was a five-point scale which included Never, Rarely, Sometimes, Often and Very Often. Percentages in Table 16 include a combination of respondents who answered “Often” and “Very Often.”
Table 16: Newcomers Local Amenities by Relocation Place (Rural/Metro), Workforce Group, and Zip Code Change
|
Asset Visitations |
Rural |
Metro/Micro |
Workforce |
Moved to new zip |
|
Lakes and other bodies of water |
66% |
66% |
72% |
69% |
|
Cultural activities such as community celebrations,
rodeos, museums or music
|
41% |
37% |
42% |
41% |
|
Community centers or other local facilities |
23% |
21% |
23% |
23% |
|
Trails for hiking or walking |
58% |
66% |
71% |
65% |
|
Campgrounds |
32% |
37% |
40% |
36% |
|
Sports Events |
20% |
25% |
26% |
24% |
Tables 17, 18 and 19 are presented for comparison of asset visitation.
Table 17: Newcomers Rural Amenities: “How Often Do You Attend or Visit?”

Table 18: Newcomers Macro/Micro Amenities: “How Often Do You Attend or Visit?”

Table 19: Newcomers Workforce Amenities: “How Often Do You Attend or Visit?”

Engagement with New Community
Movers indicated a high level of engagement in their new community overall. The chart illustrates answers for the following question: The COVID pandemic changed many behaviors. However, we are more interested in typical behaviors. How often do you engage in each of the following activities in your community or region in a more typical year (or how often do you anticipate you will do so after the pandemic)?
The option for answering this question was a five-point scale which included Never, Rarely, Sometimes, Often and Very Often. The percentages shown in Table 20 include a combination of respondents who answered “Often” and “Very Often.”
Table 20: Newcomers Community Engagement by Relocation Place (Rural/Metro), Workforce Group, and Zip Code Change
|
Community Engagement |
Rural |
Metro/Micro |
Workforce |
Moved to new zip |
|
Worked on a community or regional project |
15% |
13% |
16% |
15% |
|
Attended a public meeting to discuss town or school affairs |
11% |
8% |
12% |
10% |
|
Attended a club or organizational meeting (not including
meetings for work)
|
23% |
17% |
22% |
21% |
|
Socialize with long-time community residents |
40% |
35% |
41% |
40% |
|
Had friends from your community over to your home |
37% |
40% |
45% |
40% |
|
Visited friends from your community at their home |
38% |
41% |
46% |
41% |
|
Met people in public settings to socialize |
40% |
42% |
47% |
43% |
|
Volunteered |
23% |
19% |
23% |
23% |
|
Attended religious services |
34% |
28% |
30% |
32% |
|
Exchanged small favors or help with a neighbor
(for example, shoveled snow or cooked a meal)
|
49% |
42% |
47% |
48% |
Tables 21, 22, and 23 are presented for comparison.
Table 21: Newcomers Rural Community Engagement: How Often Do You Engage in the Following Activities?

Table 22: Newcomers Metro/Micro Community Engagement: How Often Do You Engage in the Following Activities?

Table 23: Newcomers Workforce Community Engagement: How Often Do You Engage in the Following Activities?

Demographics
The following table includes characteristics of respondents by group from the survey data collected.
Table 24: Newcomers Demographics by Relocation Place (Rural/Metro), Workforce Group, and Zip Code Change
|
Age Group |
Rural |
Metro/Micro |
Workforce |
Moved to new zip |
|
18-24 |
0.79% |
0% |
0.42% |
.42% |
|
25-34 |
10% |
16% |
13% |
13% |
|
35-44 |
15% |
22% |
18% |
18% |
|
45-54 |
13% |
14% |
13% |
14% |
|
55-64 |
23% |
21% |
22% |
22% |
|
65-74 |
26% |
19% |
23% |
23% |
|
75+ |
11% |
6% |
9% |
9% |
|
Blank |
0.63% |
1% |
-- |
– |
|
MULT |
0% |
0.17% |
-- |
– |
|
Female |
53% |
52% |
45% |
53% |
|
Male |
46% |
45% |
54% |
45% |
|
Prefer not to say/
Other
|
0.38% |
0.35% |
1% |
.42% |
|
Blank |
0.79% |
2% |
-- |
– |
|
White |
86% |
88% |
87% |
86% |
|
Black or African American |
0% |
0.70% |
0.49% |
.33% |
|
Hispanic or Latino |
1% |
2% |
2% |
1.41% |
|
Asian |
0.48% |
0.70% |
1% |
.58% |
|
MT Tribes or Nations |
1% |
0.17% |
2% |
.75% |
|
Other Native American |
2% |
0.52% |
5% |
1% |
|
Other |
1% |
0.17% |
87% |
.83% |
|
Prefer not to disclose |
4% |
4% |
0.49% |
4% |
|
Employed |
51% |
63% |
78% |
58% |
|
Unemployed |
3% |
2% |
4% |
3% |
|
Out of the Labor Force |
44% |
32% |
16% |
39% |
|
Blank |
2% |
2% |
1% |
– |
|
MULT |
0.63% |
0.17% |
0.49% |
– |
Education
|
Rural |
Metro/Micro |
Workforce |
Moved to new zip |
|
|
H. S. Degree or less |
12% |
8% |
8% |
10% |
|
Some College |
35% |
26% |
22% |
31% |
|
Bachelor's Degree + |
52% |
64% |
61% |
59% |
|
Currently a student (yes) |
3% |
4% |
5% |
4% |
|
Blank/Other |
0.95% |
2% |
0.86% |
– |
Household Characteristics
|
Size of household |
Rural |
Metro/Micro |
Workforce |
Moved to new zip |
|
1 |
21% |
16% |
14% |
20% |
|
2 |
49% |
40% |
40% |
47% |
|
3 |
11% |
15% |
16% |
13% |
|
4 |
9% |
16% |
17% |
12% |
|
5 |
4% |
5% |
7% |
5% |
|
6+ |
3% |
3% |
5% |
3% |
|
Blank |
3% |
4% |
1% |
– |
|
Age of children |
Rural |
Metro/Micro |
Workforce |
Moved to new zip |
|
Infant |
4% |
4% |
6% |
5% |
|
Toddler |
6% |
10% |
? |
10% |
|
Preschool |
5% |
9% |
10% |
8% |
|
Elementary School |
11% |
16% |
19% |
16% |
|
Middle School |
5% |
9% |
9% |
8% |
|
High School |
6% |
9% |
11% |
9% |
|
Grandparents in household |
4% |
3% |
4% |
4% |
|
Adult children in household |
8% |
10% |
9% |
10% |
|
Other relatives in household |
2% |
3% |
2% |
3% |
|
Living with spouse/partner |
Rural |
Metro/Micro |
Workforce |
Moved to new zip |
|
No |
28% |
23% |
20% |
26% |
|
Yes |
70% |
74% |
78% |
74% |
|
Blank |
3% |
3% |
2% |
– |
Economic Characteristics
|
Household Income (2020) |
Rural |
Metro/Micro |
Workforce |
Moved to new zip |
|
< $25,000 |
8% |
4% |
4% |
6% |
|
$25,000 - $49,999 |
19% |
13% |
12% |
18% |
|
$50,000 - $74,000 |
21% |
17% |
21% |
22% |
|
$75,000 - $99,999 |
17% |
18% |
19% |
19% |
|
$100,000 or more |
24% |
38% |
38% |
34% |
|
Blank/Other |
12% |
9% |
6% |
– |
|
Home ownership |
Rural |
Metro/Micro |
Workforce |
Moved to new zip |
|
Rent |
0.48% |
0.35% |
0.49% |
.43% |
|
Own |
96% |
95% |
97% |
99% |
|
Some other arrangement |
0.32% |
0% |
0.25% |
.17% |
|
Blank/Other |
3.16% |
4.35% |
2.59% |
– |
*Note that our sample came from State of Montana property ownership records so excludes renters and those living within reservations.
|
Telecommuting?
(work remotely)
|
Rural |
Metro/Micro |
Workforce |
Moved to new zip |
|
Respondent |
7% |
7% |
9% |
7% |
|
Spouse |
3% |
5% |
6% |
4% |
|
Commute Times - Respondent |
Rural |
Metro/Micro |
Workforce |
Moved to new zip |
|
I work remotely for someone else |
5% |
3% |
7% |
|
|
Work from home as self employed |
5% |
6% |
7% |
6% |
|
some travel less than 15 min |
21% |
24% |
32% |
26% |
|
Travel 15-30 min |
8% |
14% |
19% |
15% |
|
Travel more than 30 min |
9% |
8% |
10% |
8% |
|
Not applicable |
43% |
36% |
18% |
38% |
|
Blank/Other |
7% |
6% |
5% |
– |
|
Commute Times - Spouse |
Rural |
Metro/Micro |
Workforce |
Moved to new zip |
|
Works remotely for someone else |
4% |
|||
|
Work from home as self employed |
6% |
4% |
6% |
5% |
|
some travel less than 15 min |
12% |
19% |
21% |
16% |
|
Travel 15-30 min |
6% |
15% |
15% |
11% |
|
Travel more than 30 min |
8% |
4% |
9% |
7% |
|
Not applicable |
60% |
47% |
40% |
57% |
|
Blank |
5% |
5% |
3% |
– |
|
Multiple answers |
0.48% |
0.87% |
0.86% |
– |
Business Owners
|
Currently Own a Business |
Rural |
Metro/Micro |
Workforce |
Moved to new zip |
|
Yes |
19% |
16% |
23% |
18% |
|
No |
81% |
84% |
77% |
82% |
|
Currently Own A Business |
Rural |
Metro/Micro |
Workforce |
Moved to new zip |
|
Already existed |
33% |
38% |
66% |
35% |
|
Created it |
67% |
62% |
34% |
65% |
*Note: The responses included in this table are only from those who indicated that they currently own a business.
Farm/Ranch Owners
|
Currently Own a Farm/Ranch |
Rural |
Metro/Micro |
Workforce |
Moved to new zip |
|
Yes |
8% |
2% |
6% |
5% |
|
No |
92% |
98% |
94% |
95% |
|
Currently Own a Farm/Ranch |
Rural |
Metro/Micro |
Workforce |
Moved to new zip |
|
Already existed |
67% |
60% |
64% |
65% |
|
Created it |
33% |
40% |
36% |
35% |
*Note: The responses included in this table are only from those who indicated that they currently own a farm or ranch.
Metro/Micro Compared to Rural
The research team sought to uncover differences between those who moved to rural (non-metro/micro) areas compared to those that moved to metro/micro areas. The following discussion and analysis describe the main differences that were found between these two groups.
Differences in Reasons for Moving
What follows are some highlights followed by data tables and a more detailed discussion of the results.
- People moving to metro/micro areas were significantly more likely to be returning to those areas. People moving to rural areas were significantly more likely to have never lived there.
- People moving to metro/micro areas were significantly more likely to say that financial oriented reasons were important to their decision to move compared to those moving to rural areas.
- More people moving to rural areas were significantly more likely to say that qualities including the opportunity to buy available land, a safer place to live, a slower pace of life, a smaller community, live among people with similar values, and a less congested place to live were important in their decision to move than people moving to metro/micro areas.
- People moving to rural areas were significantly more likely to say that qualities related to lower cost-of-living were important compared to those moving to metro/micro areas including finding lower priced housing and overall lower cost-of-living.
The Chi-Square statistical procedure was used to examine the differences between categorical variables within the same population -- all survey responders who indicated they moved to a new zip code.
Table 25: Newcomers Returnee Chi-Square Analysis
|
Metro/Micro |
Rural |
|||||
|
% |
St. Residual |
Sig. |
% |
St. Residual |
Sig. |
|
|
Returnees (Self) |
||||||
|
Yes |
32% |
4.27 |
* |
22% |
-4.27 |
* |
|
No |
66% |
-3.74 |
* |
76% |
3.74 |
* |
|
Returnees (spouse) |
||||||
|
Yes |
24% |
4.289 |
* |
14% |
-4.289 |
* |
|
No |
54% |
-3.383 |
* |
64% |
3.383 |
* |
First, we conducted a chi-square analysis to see if there are significant differences in the likelihood of returning among returnees and their spouse/partner (if they have one). Overall, there were significant differences. 32% of metro/micro respondents were returners compared to only 22% of individuals returning to rural areas9. Similarly, 24% of metro/micro respondents’ spouses/partners were returners compared to only 14% of rural respondents. These results suggest that both among returnees and their spouses/partners respondents moving to metro/micro areas are more likely to be returners.
Similarly, a series of chi-square analyses were conducted to explore whether the importance
of reasons for moving to their new communities differed among individuals moving to
metro/micro vs. rural areas. To align with research previously conducted by Ben Winchester
and his colleagues, we looked at individuals who responded that the factor was “Important”
or “Very Important.”
Table 26: Newcomers Importance of Factor in Moving Decision
|
Metro/Micro |
Rural |
||||||||||
|
Important |
Very Important |
Important |
Very Important |
|||||||||
|
% |
St. Residual |
Sig. |
% |
St. Residual |
Sig. |
% |
St. Residual |
Sig. |
% |
St. Residual |
Sig. |
|
|
To live closer to relatives |
10% |
-0.955 |
31% |
1.006 |
12% |
0.955 |
28% |
-1.006 |
||||
|
To live closer to friends |
9% |
-0.245 |
7% |
1.632 |
10% |
0.245 |
5% |
-1.632 |
||||
|
To find lower priced housing |
17% |
0.655 |
11% |
-2.574 |
* |
16% |
-0.0655 |
17% |
2.574 |
* |
||
|
To buy available land |
12% |
-1.004 |
10% |
-2.825 |
* |
14% |
1.004 |
15% |
2.825 |
* |
||
|
To find higher quality schools |
12% |
3.566 |
* |
8% |
2.249 |
* |
6% |
-0.3566 |
* |
4% |
-2.249 |
* |
|
To find a lower cost of living |
17% |
-0.46 |
10% |
-2.316 |
* |
18% |
0.46 |
14% |
2.316 |
* |
||
|
To find a safer place to live |
19% |
-0.623 |
18% |
-2.301 |
* |
21% |
0.623 |
23% |
2.301 |
* |
||
|
To find a desirable natural environment (to have better access to the outdoors) |
25% |
-0.358 |
34% |
-1.281 |
26% |
0.358 |
38% |
1.281 |
||||
|
To find a good environment for raising children |
13% |
1.5 |
27% |
4.094 |
* |
10% |
-1.5 |
17% |
-4.094 |
* |
||
|
Take advantage of a slower pace of life |
20% |
-1.934 |
23% |
-3.839 |
* |
25% |
1.934 |
33% |
3.839 |
* |
||
|
To live in a smaller community |
20% |
-2.096 |
* |
22% |
-4.361 |
* |
25% |
2.096 |
* |
33% |
4.351 |
* |
|
To live in a larger community |
5% |
2.91 |
1% |
1.818 |
2% |
-2.91 |
0% |
-1.818 |
||||
|
To live among people with similar values |
22% |
1.473 |
17% |
-2.919 |
* |
18% |
-1.473 |
23% |
2.919 |
* |
||
|
To find a less congested place to live |
19% |
-2.747 |
* |
28% |
-2.921 |
* |
26% |
2.747 |
* |
36% |
2.921 |
* |
|
To find a higher paying job |
10% |
2.289 |
* |
9% |
3.861 |
* |
6% |
-2.289 |
* |
3% |
-3.861 |
* |
|
To find a job that matches my skills |
16% |
3.487 |
* |
12% |
3.142 |
* |
10% |
-3.487 |
* |
7% |
-3.142 |
* |
|
To find a better job for my spouse/partner |
7% |
1.021 |
8% |
3.043 |
* |
6% |
-1.021 |
4% |
-3.043 |
* |
||
|
To find a job that allowed for a better work-life balance |
15% |
2.984 |
* |
14% |
2.212 |
* |
10% |
-2.984 |
* |
10% |
-2.212 |
* |
|
To take on a new job |
9% |
1.122 |
16% |
2.171 |
* |
8% |
-1.122 |
11% |
-2.171 |
* |
||
|
To start my own business |
3% |
0.15 |
4% |
0.957 |
3% |
-0.15 |
3% |
-0.957 |
||||
|
To retire |
13% |
-0.166 |
18% |
-4.062 |
* |
13% |
0.1116 |
27% |
4.062 |
* |
||
|
To take advantage of health care facilities |
10% |
0.733 |
8% |
2.232 |
* |
9% |
-0.773 |
5% |
-2.232 |
* |
||
There were several significant differences among survey respondents that chose “Very Important.” Metro/micro respondents were significantly more likely to indicate finding higher quality schools (8% metro/micro versus 4% rural), a good environment for raising children (27% metro/micro versus 17% rural), a higher paying job (9% metro/micro versus 3% rural), a job that matched their skills (12% metro/micro versus 7% rural), a better job for spouse/partner (8% metro/micro versus 4% rural), a job that allowed for better work life balance (14% metro/micro versus 10% rural), the opportunity to take on a new job (16% metro/micro versus 11% rural) and taking advantage of health care facilities (8% metro/micro versus 5% rural) were of key importance.
In contrast, individuals wanting lower priced housing (11% metro/micro versus 17% rural), to buy available land (10% metro/micro versus 15% rural), to find a lower cost of living (10% metro/micro versus 14% rural), to find a safer place to live (18%-metro/micro versus 23% rural), to take advantage of a slower pace of life (23%metro/micro versus 33% rural), to live in a smaller community (2% metro/micro versus 33% rural), to live among people with similar values (23% rural versus 17% metro/micro), a less congested place to live (36% rural versus 28% metro/micro), and to retire (13% rural versus 18% metro/micro) were significantly greater among individuals moving to rural areas.
Among individuals indicating “Important” to the move factors, those from metro/micro areas were significantly more likely to say they moved to find higher quality schools (12% metro/micro areas versus 6% rural), to find a higher paying job (10% metro/micro areas versus 6% rural), find a job that matches their skills (16%-metro/micro versus 10% rural), and find a better work life balance (15% metro/micro areas versus 10% rural) (Table 26). In contrast, individuals moving to non-metro/micro areas are more likely to indicate living in a smaller community (20% metro/micro versus 25% rural) and finding a less congested place to live were important (19%-metro/micro versus 26% rural).
Table 27: Newcomers Community Ratings
|
Metro/Micro |
Rural |
|||||||||||
|
Agree |
Strongly Agree |
Agree |
Strongly Agree |
|||||||||
|
% |
St. Residual |
Sig. |
% |
St. Residual |
Sig. |
% |
St. Residual |
Sig. |
% |
St. Residual |
Sig. |
|
|
Community Ratings |
||||||||||||
|
I feel safe in this community |
69% |
2.187 |
* |
21% |
-2.994 |
* |
63% |
-2.187 |
* |
28% |
2.994 |
* |
|
Overall, I am satisfied with living in this community |
61% |
2.003 |
* |
31% |
-2.065 |
* |
56% |
-2.003 |
* |
36% |
2.065 |
* |
|
I trust the people living in this community |
68% |
0.38 |
15% |
-0.321 |
67% |
-0.38 |
16% |
0.321 |
||||
|
The schools in this community are of high quality |
42% |
4.124 |
* |
16% |
3.51 |
31% |
-4.124 |
* |
9% |
-3.51 |
||
|
There is satisfactory health care available in this region |
60% |
-2.98 |
25% |
6.319 |
* |
68% |
2.98 |
11% |
-6.319 |
* |
||
|
Five years from now I will most likely still live in this community |
43% |
1.707 |
29% |
-3.287 |
* |
38% |
-1.707 |
38% |
3.287 |
* |
||
|
This region offers many natural amenities and recreation opportunities for residents |
40% |
0.242 |
53% |
0.569 |
40% |
0.242 |
52% |
-0.569 |
||||
|
I can fully use my existing skills, education and training in this community |
47% |
0.483 |
23% |
2.265 |
* |
46% |
-0.483 |
18% |
-2.265 |
* |
||
|
I can find activities in this region that are interesting to me |
53% |
-1.869 |
38% |
2.174 |
* |
58% |
1.869 |
32% |
-2.174 |
* |
||
|
This community is welcoming of new residents |
60% |
0.248 |
14% |
0.807 |
60% |
-248 |
12% |
-0.807 |
||||
|
I am satisfied with my social life in this community |
64% |
1.829 |
15% |
-1.378 |
59% |
-1.829 |
18% |
1.378 |
||||
|
This region takes steps to increase the use of natural amenities and recreational opportunities for residents and visitors |
46% |
0.965 |
30% |
3.213 |
* |
44% |
-0.965 |
22% |
-3.213 |
* |
||
|
It is easy to make friends in this community |
59% |
0.82 |
14% |
-0.249 |
57% |
-0.82 |
14% |
0.249 |
||||
|
I trust local government officials to do what is right |
47% |
1.154 |
5% |
-0.347 |
43% |
-1.54 |
6% |
0.347 |
||||
|
There are opportunities to access adult education and professional development in this region |
51% |
3.918 |
* |
17% |
6.563 |
* |
39% |
-3.918 |
* |
5% |
-6.563 |
* |
|
I can find the goods and services that I need to purchase in this region |
62% |
3.302 |
* |
18% |
4.123 |
* |
53% |
-3.302 |
* |
10% |
-4.123 |
* |
|
In general, the housing in this community is of high quality |
55% |
3.703 |
* |
13% |
4.469 |
* |
44% |
-3.703 |
* |
5% |
-4.469 |
* |
|
There are enough economic opportunities in this region so that anyone who wants to work can find a job |
47% |
4.087 |
* |
18% |
4.187 |
* |
36% |
-4.087 |
* |
10% |
-4.187 |
* |
|
I believe that the economy of this region will grow stronger in the next 5 years |
48% |
0.229 |
31% |
5.672 |
* |
47% |
-0.229 |
17% |
-5.672 |
* |
||
|
It is easy to find housing in this community that is affordable for my household |
28% |
-0.838 |
6% |
0.297 |
30% |
0.838 |
6% |
-0.0297 |
||||
|
I am satisfied with my broadband options in this community |
44% |
0.944 |
11% |
-0.633 |
41% |
-0.944 |
12% |
0.663 |
||||
Differences in Rural, Metro/Micro Rating of New Community
What follows are some highlights of the findings related to rating of the new community followed by data tables and a more detailed discussion of the results.
- Individuals living in rural communities were significantly more likely to strongly agree that they are satisfied living in this community and that they feel safe in their community whereas individuals living in metro/micro communities were significantly more likely to just agree with these statements.
- Rural respondents are significantly more likely to say they will most likely be living in the community five years from now compared to individuals from metro/micro communities.
- People moving to metro/micro communities are significantly more likely to agree or strongly agree that they have access to amenities such as adult education and professional development, goods and services, high quality housing, and enough economic opportunities than people moving to rural communities.
Further, another set of chi square analyses were conducted to look at community factors among individuals moving to metro/micro and rural areas (Table 27). We explored whether there were significant differences in individuals who agreed and strongly agreed with statements describing the communities they currently live in. Among individuals who agreed with these statements, respondents living in metro/micro areas were significantly more likely to Agree that they feel safe in this community (69% metro/micro versus 63% rural), are overall satisfied with their community (61% metro/micro versus 56% rural), the schools in this community are of high quality (42% metro/micro versus 31% rural), there are opportunities to access adult education and professional development in this region (51% metro/micro versus 39% rural), they can find goods and services to purchase in that region (62% metro/micro versus 53% rural), that in general the housing in the community is of high quality (55% metro/micro versus 44% rural), and there are enough economic opportunities in this region so that anyone who wants to work can find a job (47% metro/micro versus 36% rural). Rural respondents were not significantly more likely than metro/micro to indicate that they agree with any of these statements.
Individuals living in metro/micro areas were significantly more likely to Strongly Agree with the healthcare available in this region (25% metro/micro versus 11% rural), use of existing skills, education, and training in their community (23% metro/micro versus 18% rural), to find activities that are interesting to me (38% metro/micro versus 32% rural), that this region takes steps to increase the use of natural amenities and recreations opportunities for residents and visitors (30% metro/micro versus 22% rural), and residents believe that the economy of this region will grow stronger in the next five years (31% metro/micro versus 17% rural). Similar to individuals who agreed with statements, respondents living in metro/micro areas were significantly more likely to strongly agree that there are opportunities to access adult education and professional development in this region (17% metro/micro versus 5% rural), that they can find goods and services to purchase in that region (18% metro/micro versus 10% rural), that in general the housing in the community is of high quality (13% metro/micro versus 5% rural), and there are enough economic opportunities in this region so that anyone who wants to work can find a job (18% metro/micro versus 10% rural).
Whereas individuals living in metro/micro areas were significantly more likely to
agree that they are satisfied living in this community and that they feel safe in
their community; individuals living in rural areas were significantly more likely
to strongly agree with these statements. For example, among individuals saying that
they feel safe in the community 28% rural respondents said they feel safe compared
with 21% of metro/micro respondents. 36% of rural respondents were satisfied living
in their community compared to 31% or individuals living in metro/micro communities.
Finally, 38% of rural respondents said they will most likely be living in this community
five years from now compared to 29% of individuals from metro/micro areas.
Analysis of MT Workforce Compared to MN
The original version of this study was conducted by Ben Winchester and colleagues at the University of Minnesota Center for Rural Vitality to understand more about why people in the workforce move to communities in rural Minnesota. This data was sought to help economic developers and employers recruit workforce and was funded through a grant from the U.S. Department of Agriculture. At the time this whitepaper was written, the findings from the Minnesota study have been shared only in presentations. A published paper has been delayed due to the pandemic.
Ben Winchester’s presentations of this data at the Reimagining Rural10 events have been transformative in raising awareness of the fact that people do find rural communities desirable and that there are people moving into rural communities as well as larger communities. Montana audiences indicated surprise by the data and overall positive message about rural living presented by Winchester. Even though the data was received positively by audiences in Montana, there was a clear question if the trends and motivations for moving found in the Minnesota study held true for Montana given that Montana has a lower population overall and a significantly lower population density than Minnesota. To eliminate any doubt about these important trends in rural migration, MSU and MSU Extension researchers sought to replicate this study in Montana. We examine the workforce age group in the Montana study to be able to compare our results to the results from Winchester’s study in Minnesota.
One difference between the samples of the two studies is that the Minnesota study asked people to report their exact age and they included people 18-59 in their Workforce group. MSU’s study asked people to indicate which U.S. Census age group they fit into and our age groups include 18-64 which includes slightly more older people than the Minnesota workforce group.
The Minnesota survey used a commercial mailing list and sent 20,903 surveys and received 1,610 responses back compared to Montana which sent 9,000 surveys and received 1,765 surveys back. In Minnesota, 618 of returned surveys fell into the Workforce age group compared to 811 in the Montana survey.
Respondent Characteristics
Some of the most surprising findings in the Minnesota study held true for the Montana study. In Minnesota, only 25 percent of movers had ever lived in the community before compared to 34 percent in Montana. Only about one-third of respondents said they moved primarily for a job (31 percent in MT; 35 percent in Montana). Slightly more people in Minnesota had children in their households compared to Montana (47 percent in MN; 39 percent in MT).
Demographics
Montana respondents were slightly more diverse than the Minnesota survey. In Montana, 87 percent indicated they were white compared to 97 percent in Minnesota. Education levels were similar between the two states with just less than 10 percent having a high school degree and 60-61 percent having a bachelor’s degree or higher. In Minnesota, 51 percent said they have household incomes greater than $100,000 compared to 38 percent in Montana. The percentage of renters in Minnesota was higher at 18 percent compared to less than 1 percent in Montana, since the mailing list in Montana came from property ownership records.
Reasons for Moving (Table 28, 29)
The top five reasons for moving in both Montana and Minnesota were quality of life oriented though there were slight differences between the states. In Montana, the top reason for moving was to have access to a desirable natural environment which was rated important or very important by 66 percent of respondents. This factor would have probably ranked highest in Minnesota, too, but the factor was excluded from their survey due to a printing error. The next most frequently chosen reason for moving by Montana respondents was to find a less congested place to live which was rated important or very important by 57 percent of respondents compared to 40 percent in the Minnesota study. The third most common reason for moving in Montana was “to take advantage of a slower pace of life” which 53 percent said was important or very important compared to only 44 percent in the Minnesota study. The factor in fourth place for Montana was “To live in a smaller community” which was also ranked fourth by Minnesotans though in Montana 51 percent rated this as important or very important compared to only 42 percent in Minnesota. The fifth spot in the top five reasons for moving given by Montana workforce was “To find a safer place to live”. In Montana, 44 percent rated this factor important or very important compared to 40 percent in Minnesota. The bottom three factors were the same in both states including health care facilities, buy or start a business and to live in a larger community.
Table 28: Newcomers Top Five Reasons for Moving (Important + Very Important):
|
Rank MT |
MT Workforce |
MN Workforce |
|
|
To find a desirable natural environment
(access to outdoors)
|
1 |
66% |
N/A |
|
To find a less congested place to live |
2 |
57% |
40% |
|
Take advantage of a slower pace of life |
3 |
53% |
44% |
|
To live in a smaller community |
4 |
51% |
43% |
|
To find a safer place to live |
5 |
44% |
40% |
Table 29: Newcomers Bottom Five Reasons for Moving (Important + Very Important)
|
Rank MT |
MT Workforce |
MN Workforce |
|
|
To find a higher paying job |
18 |
19% |
29% |
|
To find a better job for my spouse/partner |
19 |
17% |
23% |
|
To take advantage of healthcare facilities |
20 |
10% |
11% |
|
To buy or begin my own business |
21 |
9% |
9% |
|
To live in a larger community |
22 |
5% |
5% |
Community Ratings (Table 30, 31)
The survey asked respondents to rate their new community to get a sense of satisfaction with their move. Overall, the results for Montana indicate that movers are very satisfied with their new community. There were many similarities and some large differences between responses to this question from the two states.
The statement that the highest percentage of Montana respondents said they agree or strongly agree, was the statement “this region offers many natural amenities” (93 percent compared to 79 percent in MN). The statement that the second most Montanans (92 percent) said they agreed or strongly agreed with was “I feel safe in this community” compared to 94 percent in the Minnesota study. The third, fourth and fifth most positively ranked statements about their new community for Montana received similar in percentage points between the two states which include “I am satisfied with living in this community” (92% MT; 88% MN); “I can find activities that are interesting to me” (92% MT; 78% MN) and “I trust the people living in this community” (84% MT; 86% MN).
One major difference in the top community ratings for each state is that 84% of Minnesota
respondents ranked “the schools in this community are of high quality” which was the
third highest rated statement. In Montana, the “schools are of high quality” statement
was the fourth lowest rated factor with only 53 percent in Montana indicating they agreed or strongly agreed.
The difference on this rating was the largest difference between the two states in
this group at 31 percentage points difference. When evaluating this factor, it is
important to note that in Montana, there were fewer respondents that had kids in school
(39 percent in Montana; 47 percent in MN) which could have impacted the difference.
Table 30: Newcomers Top Five Community Ratings (Percent that said “Agree” + “Strongly Agree”)
|
Rank MT |
MT Workforce |
MN Workforce |
|
|
This region offers many natural amenities & recreation
opportunities for residents
|
1 |
93% |
79% |
|
Overall, I am satisfied with living in this community |
2 |
92% |
88% |
|
I feel safe in this community |
3 |
92% |
94% |
|
I can find activities in this region that are interesting to me |
4 |
92% |
78% |
|
I trust the people living in this community |
5 |
84% |
86% |
In both states the statements with the fewest number of people that agreed or strongly agreed were “it's easy to find housing” and “I’m satisfied with broadband”. Montana’s score for “it is easy to find housing” was the factor with the fewest saying they agree or strongly agreed in both states at only 35 percent. Montanans ranked “trust of local government officials” 20 points lower than Minnesota did which could have been impacted by the timeframe these surveys were conducted. Montana’s numbers could be pandemic related or impacted by the large political divisions that occurred recently.
Table 31: Newcomers Bottom Five Community Ratings (Percent that said “Agree” + “Strongly Agree”)
|
Rank MT |
MT Workforce |
MN Workforce |
|
|
There are enough economic opportunities in this region so
that anyone who wants to work can find a job
|
17 |
57% |
66% |
|
The schools in this community are of high quality |
18 |
53% |
84% |
|
I trust the local government to do what is right |
19 |
52% |
72% |
|
I am satisfied with my broadband options in this community |
20 |
52% |
55% |
|
It is easy to find housing in this community that is affordable
for my household
|
21 |
35% |
57% |
The Importance of Welcoming (Table 32)
Winchester examined the statement “This community is welcoming” closely in the Minnesota study because they found in the qualitative portion of their study that if a community is not welcoming, newcomers do not make connections, do not integrate into the community and may leave the community. Winchester did a cross tabulation of “This community is welcoming” and the factor “I am likely to live here in five years.” He found that if a person strongly disagreed that a community is welcoming, only 44 percent said they would be living in the community in five years. We did a similar calculation with the Montana data and found that only 20 percent of those that said they disagree or strongly disagree that the community is welcoming indicated they would be living in the community in five years. Welcoming appears to be even more important in Montana than in Minnesota regarding retention of newcomers (Table 32).
Table 32: The community is welcoming by likely to live here in five years.
|
MT Workforce
“Likely to live here in 5 years”
|
MN Workforce
“Likely to live here in 5 years”
|
|
|
Strongly agree |
71% |
86% |
|
Agree |
34% |
77% |
|
Disagree |
26% |
68% |
|
Strongly Disagree |
20% |
44% |
Visitation of Amenities
Montanans seemed to take advantage of the amenities offered in the community as indicated in Table 33. These high ratings further support the idea that movers are generally very satisfied with their move.
|
Rank MT |
MT Workforce |
MN Workforce |
|
|
Rivers, lakes and other bodies of water |
1 |
92% |
82% |
|
Parks |
2 |
91% |
86% |
|
Trails for hiking or walking |
3 |
88% |
70% |
|
Cultural activities such as community celebrations,
rodeos, museums or music
|
4 |
79% |
70% |
|
Campgrounds |
5 |
68% |
39% |
|
Community centers or other local facilities |
6 |
60% |
51% |
|
Sports events |
7 |
53% |
53% |
Community Engagement
Understanding how engaged newcomers are in their new community is helpful to appreciate the value newcomers bring to the community and how they integrate once they arrive. Overall, the engagement of newcomers in Montana communities appears high (Table 34). The majority indicated that they worked on a community project, volunteered and became friendly with residents. Only a small number said they never socialized with community members in some way. Attendance at religious services was split with 40 percent saying they never attend and 41 percent saying they attend sometimes, often or very often.
Table 34: Community Engagement - Montana Workforce
|
Never/Blank |
Rarely |
Sometimes |
Often |
|
|
Worked on a community or regional project |
21% |
34% |
29% |
16% |
|
Attended a public meeting to discuss town or school affairs |
28% |
35% |
25% |
12% |
|
Attended a club or organizational meeting (not including
meetings for work)
|
24% |
30% |
24% |
22% |
|
Had long-time community residents over to your home |
9% |
16% |
34% |
41% |
|
Visited long-time community residents at their home |
||||
|
Had friends from your community over to your home |
9% |
12% |
34% |
45% |
|
Visited friends from your community at their home |
6% |
11% |
37% |
46% |
|
Met people in public settings to socialize |
6% |
12% |
35% |
47% |
|
Volunteered |
17% |
28% |
32% |
23% |
|
Attended religious services |
40% |
20% |
11% |
30% |
|
Exchanged small favors or help with a neighbor
(for example, shoveled snow or cooked a meal)
|
7% |
10% |
36% |
47% |
1 https://www.census.gov/data/tables/time-series/dec/popchange-data-text.html
2 Americans Are Less Likely Than Before COVID-19 To Want To Live in Cities, More Likely To Prefer Suburbs. Pew Research Center. https://www.pewresearch.org/social-trends/2021/12/16/americans-are-less-likely-than-before-covid-19-to-want-to-li ve-in-cities-more-likely-to-prefer-suburbs/
3 New Residents Survey Summary of Results West Central Minnesota. Ben Winchester, 2011. 1.2011.EDA Center.Ben Winchester Survey Report.pdf
4 The Rural Workforce and Entrepreneur Recruitment and Retention Project work is supported by the Innovation for Rural Entrepreneurs and Communities Priority Area grant 2017-68006-26231 from the U. S. Department of Agriculture, National Institute of Food and Agriculture. Not yet published as of April 2022.
5 U.S. Census Montana: 2020 Core Based Statistical Areas and Counties https://www2.census.gov/programs-surveys/metro-micro/reference-maps/2020/state-maps/30_Montana_2020.pdf
6 Percentages calculated using 1134 as a total which is the total sample of 1204 minus the 70 responses that were either blank or illegible.
8 The University of Minnesota Rural Newcomer study was completed in 2019, however, the results are not yet published as February 2022 due to personnel challenges brought on by the COVID 19 pandemic. Results from earlier studies on this topic can be found at: https://extension.umn.edu/economic-development/rural-brain-gain-migration
9 Rather than reporting the overall chi-square analysis, we looked at differences between metro/micro and rural respondents for each row with significance determined when standardized residuals exceeded +/-2.
10 Reimagining Rural is a program of Montana State University Extension and the Montana Community Foundation and other partners. Find out more here: https://msuextension.org/communitydevelopment/reimagine-rural.html
Appendix

 \
\

