Weekly charts of positive Covid-19 tests for 55 jurisdictions in the U.S.
Charts prepared by R.C. Maher, and updated on Monday morning each week, May 25, 2020
- October 10, 2022.
Information obtained from the New York Times Corona Virus Outbreak Database
(see Bozeman Covid summary charts)
Monday, October 10, 2022
Monday, October 3, 2022

Monday, September 26, 2022

Monday, September 19, 2022

Monday, September 12, 2022

Monday, September 5, 2022


Monday, August 29, 2022

Monday, August 22, 2022


Monday, August 15, 2022

Monday, August 8, 2022


Monday, August 1, 2022


Monday, July 25, 2022


Monday, July 18, 2022


Monday, July 11, 2022

Monday, July 4, 2022

Monday, June 27, 2022

Monday, June 20, 2022
Monday, June 13, 2022

Monday, June 6, 2022


Monday, May 30, 2022
Monday, May 23, 2022

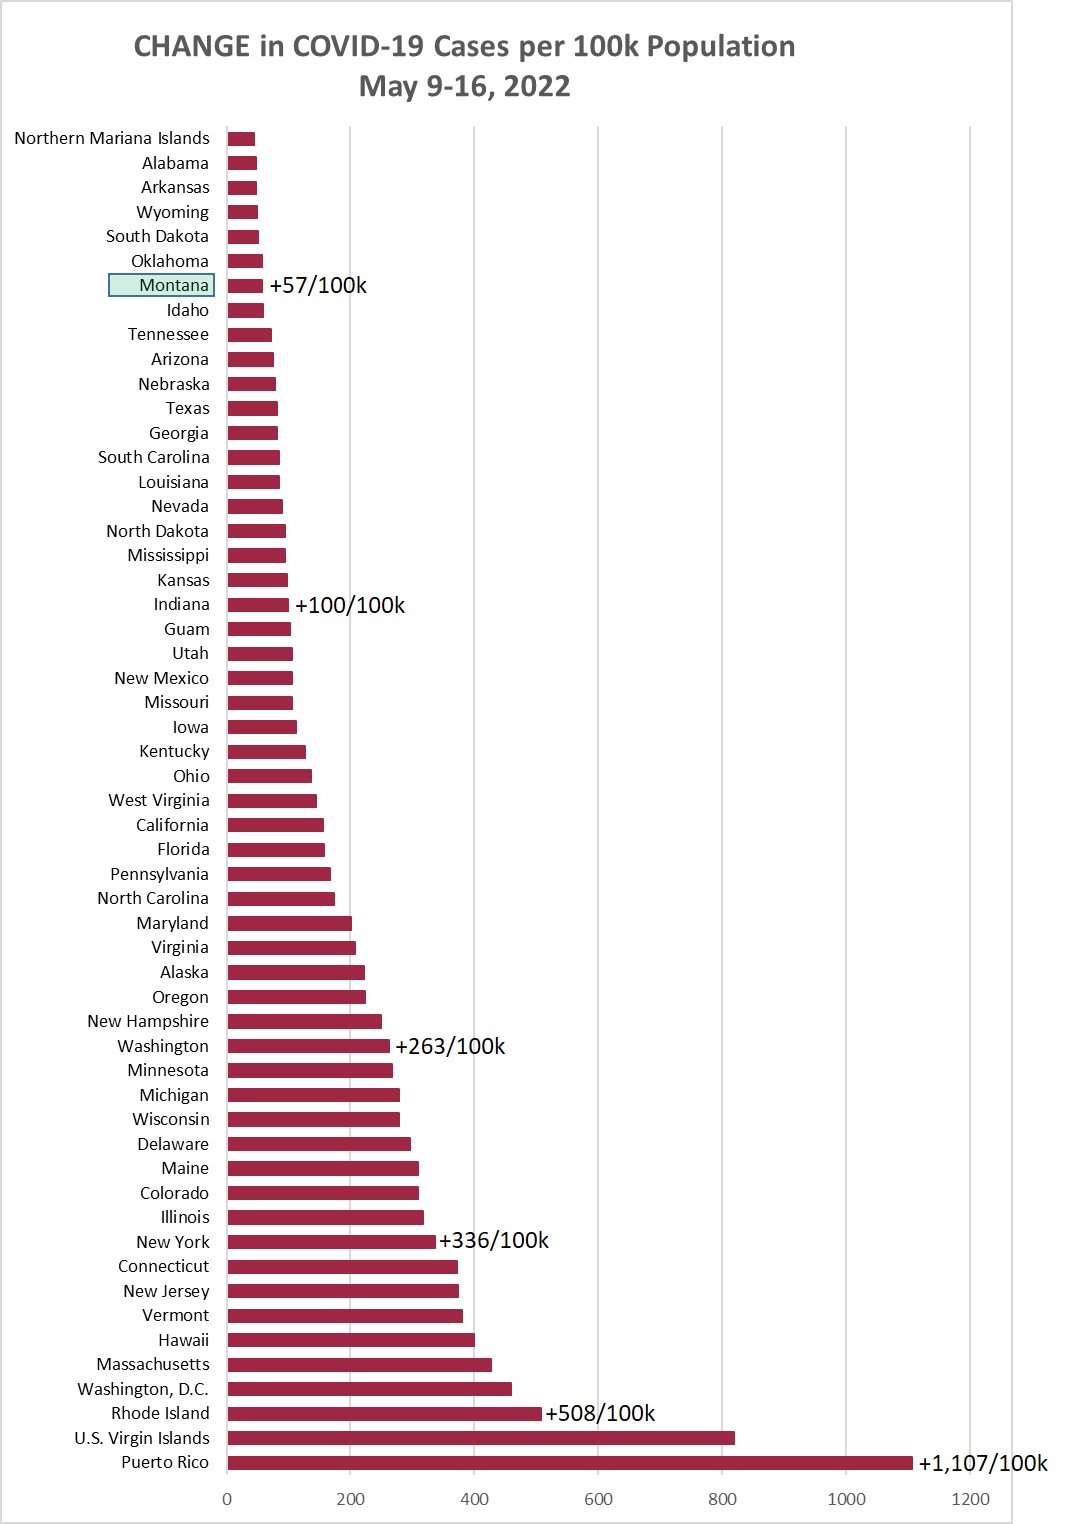
Monday, May 16, 2022


Monday, May 9, 2022

Monday, May 2, 2022


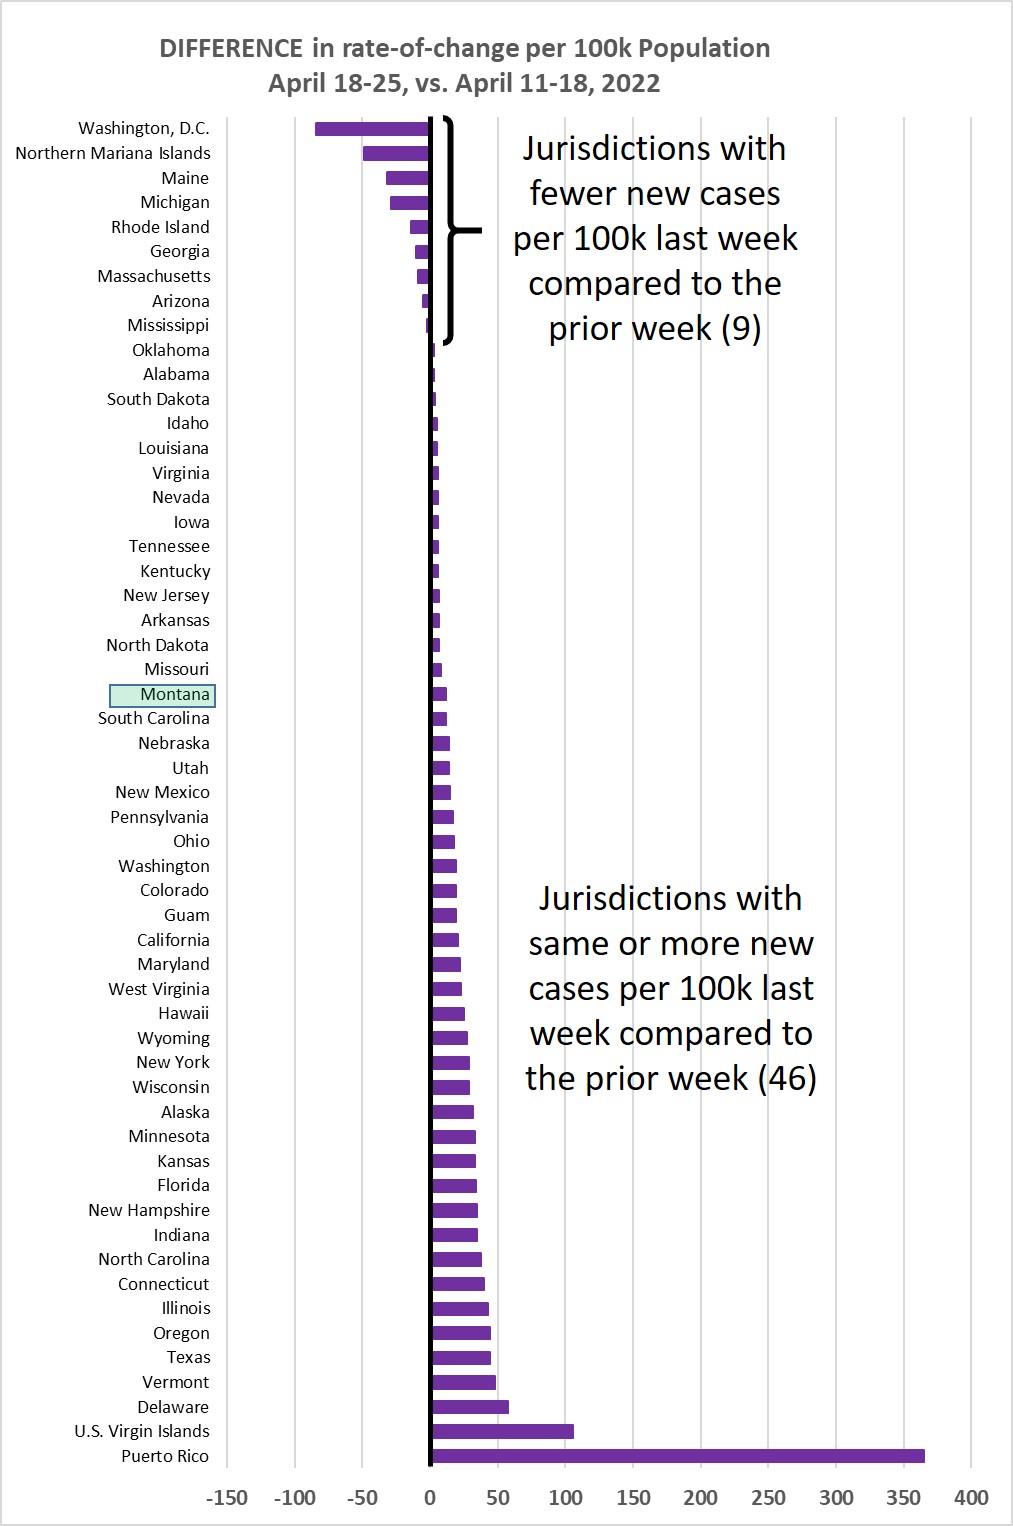
Monday, April 25, 2022


Monday, April 18, 2022


Monday, April 11, 2022

Monday, April 4, 2022

Monday, March 28, 2022

Monday, March 21, 2022

Monday, March 14, 2022

Monday, March 7, 2022

Monday, February 28, 2022

Monday, February 21, 2022

Monday, February 14, 2022

Monday, February 7, 2022
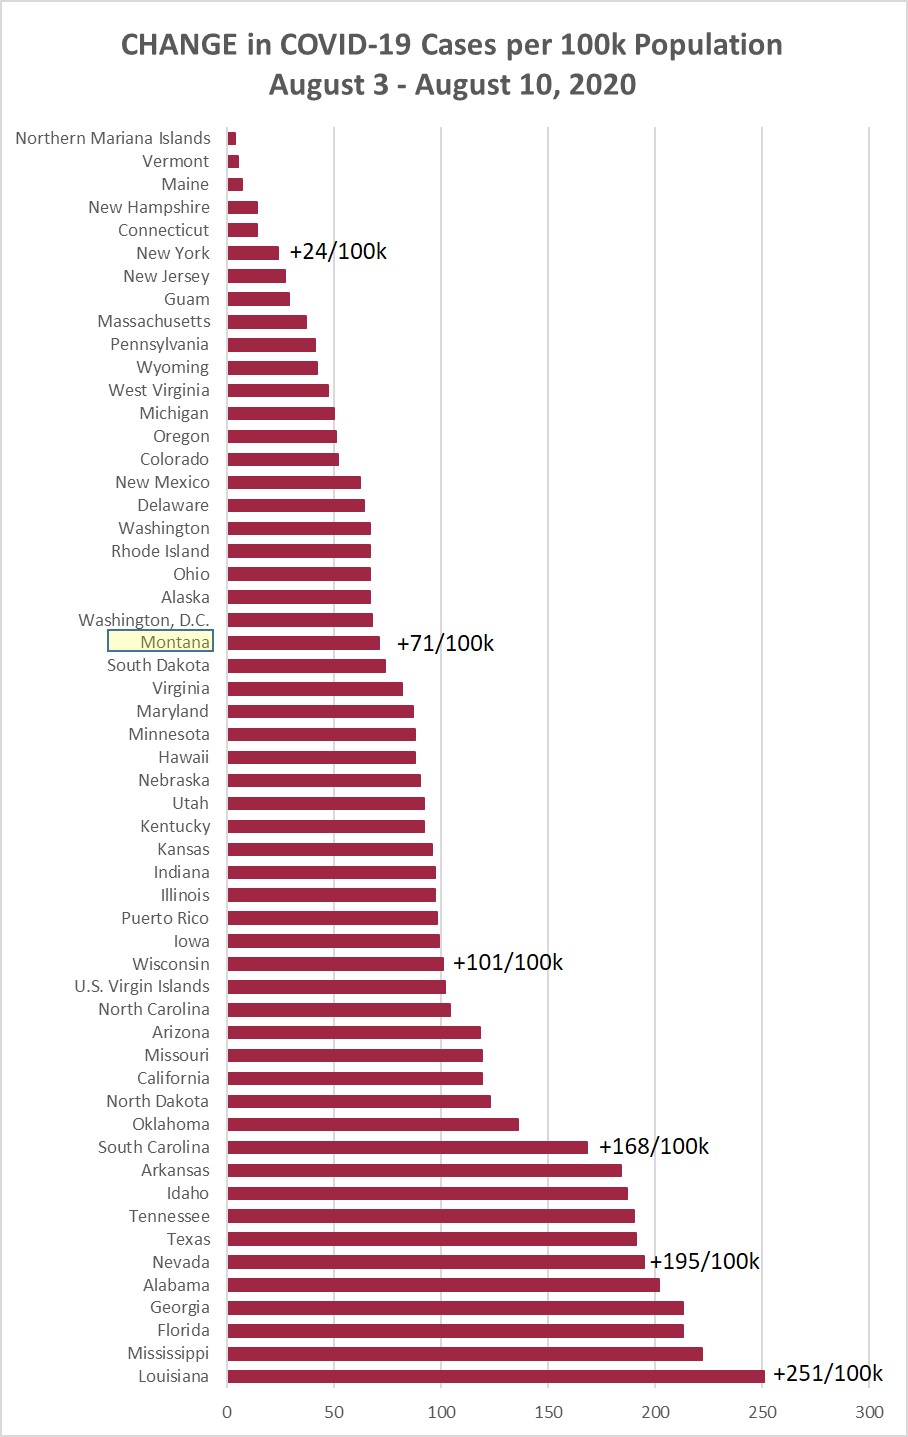
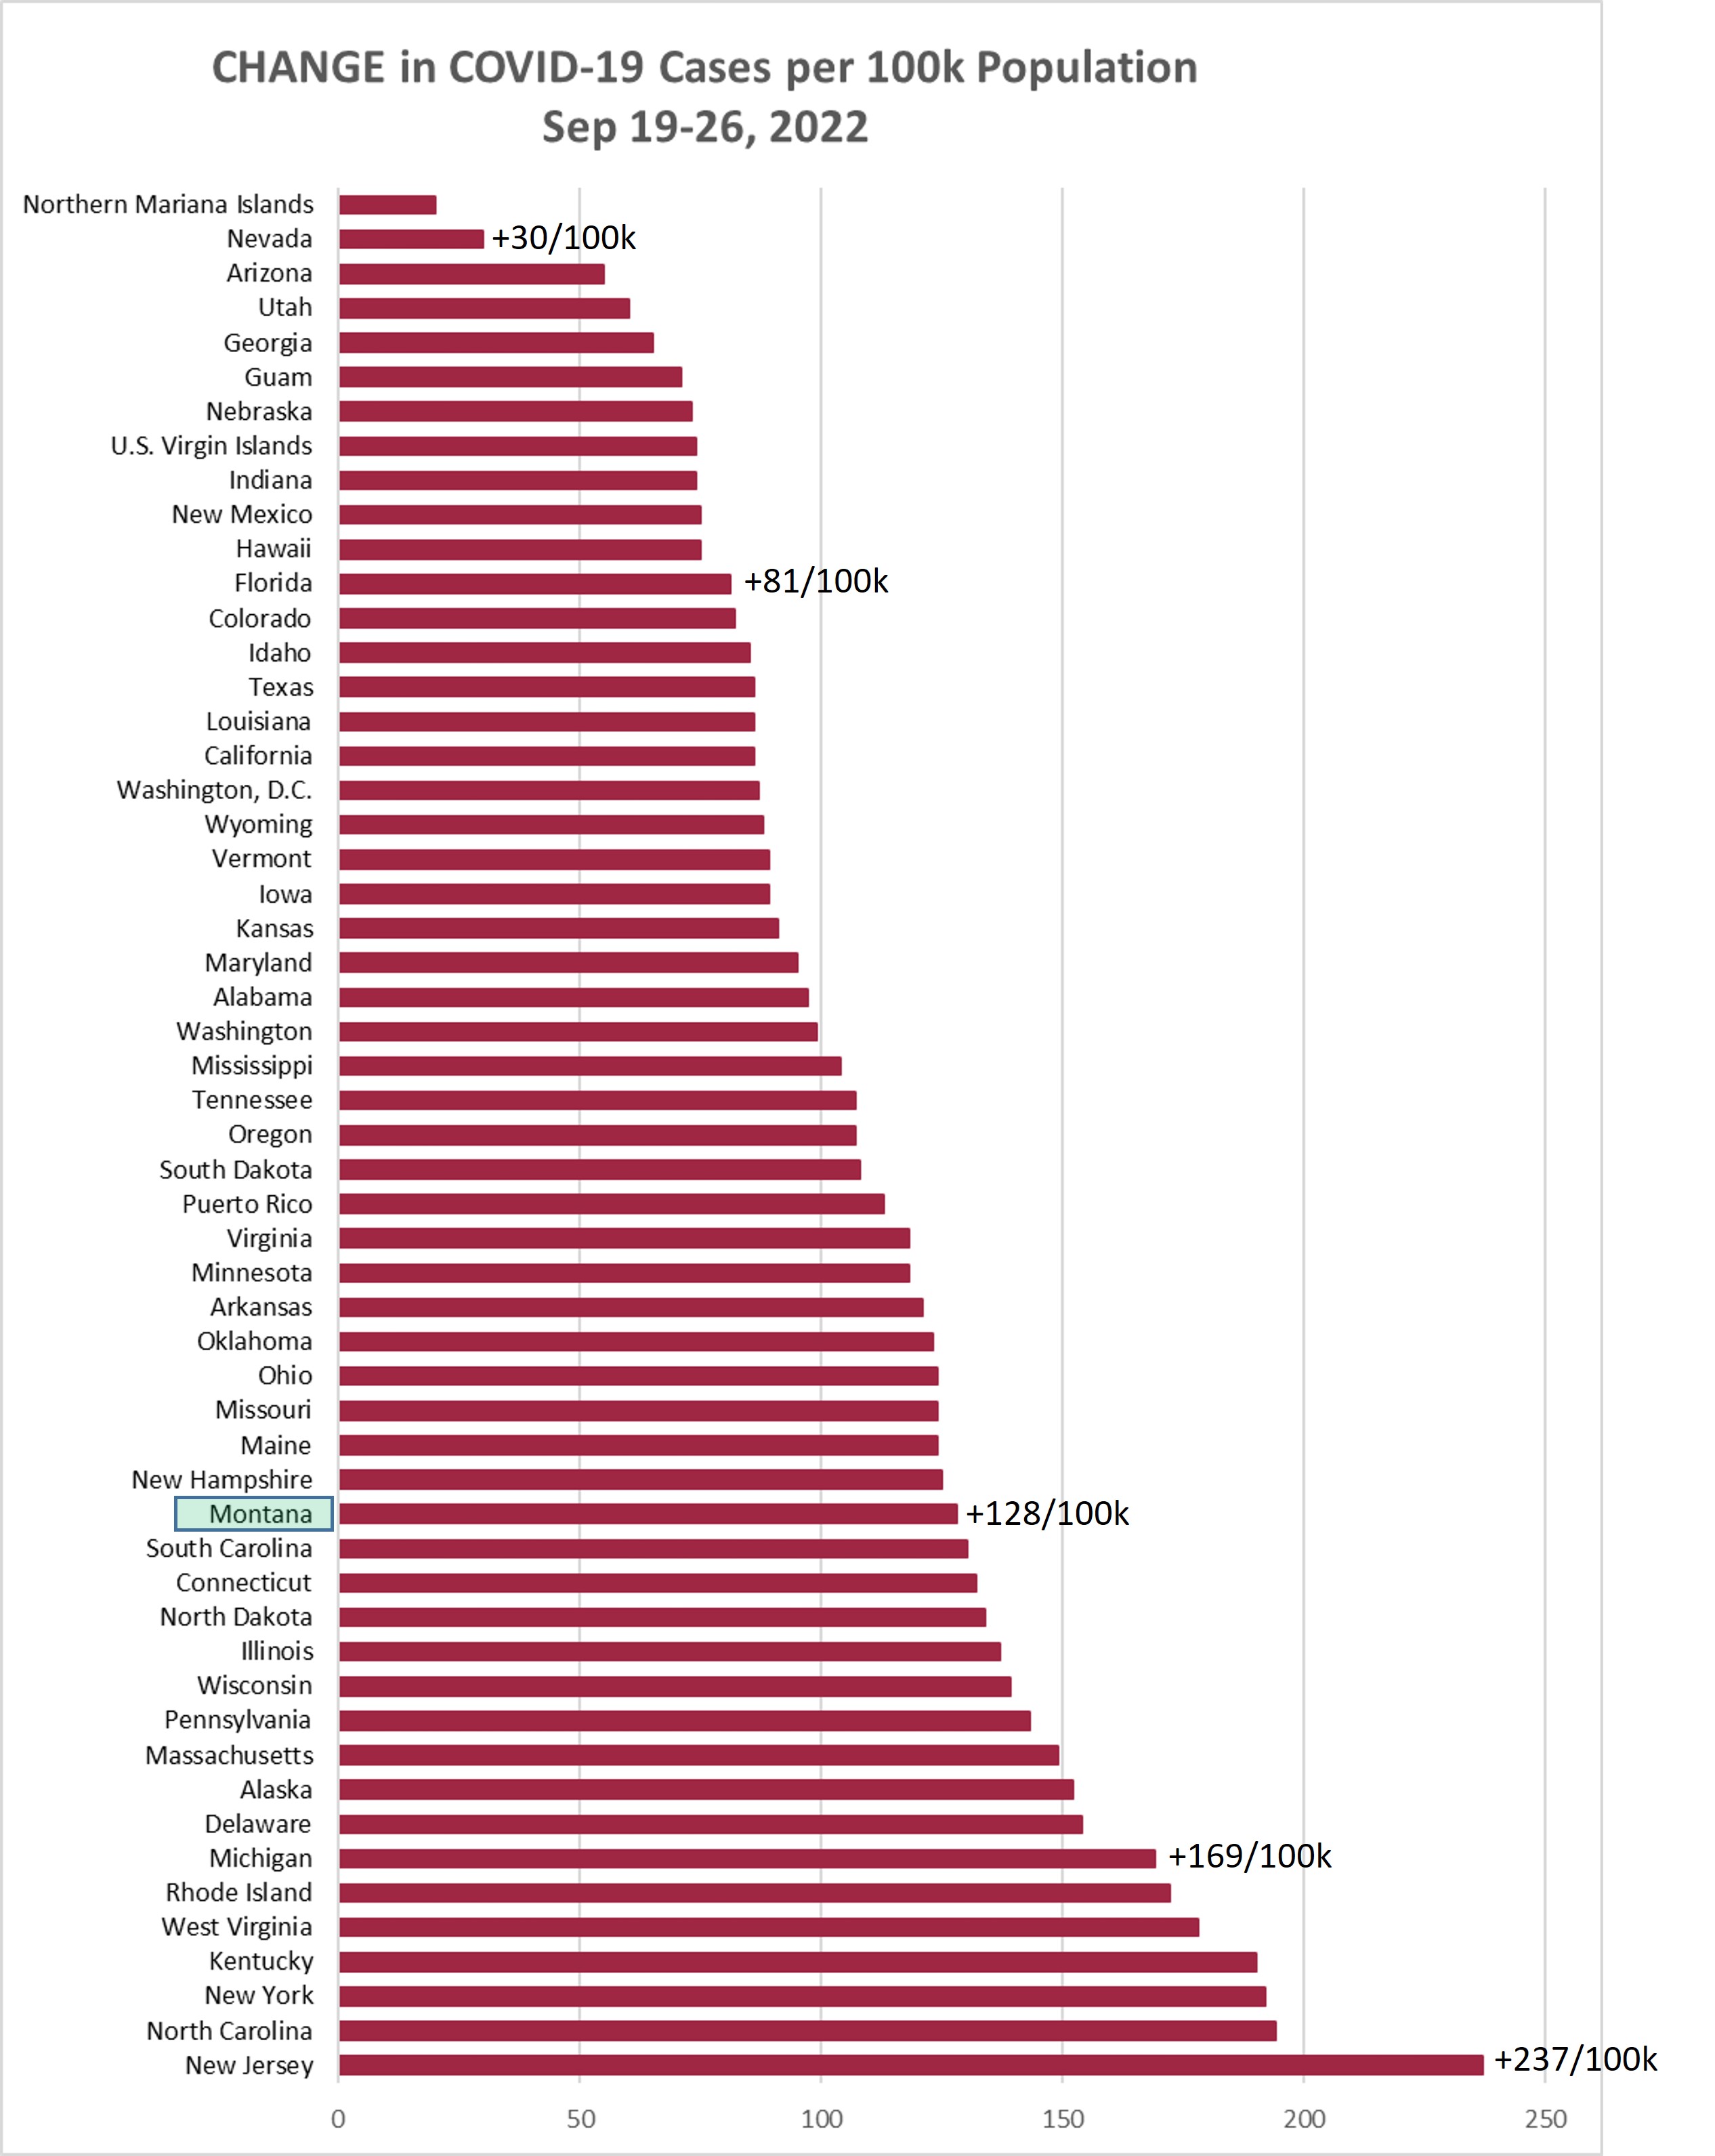
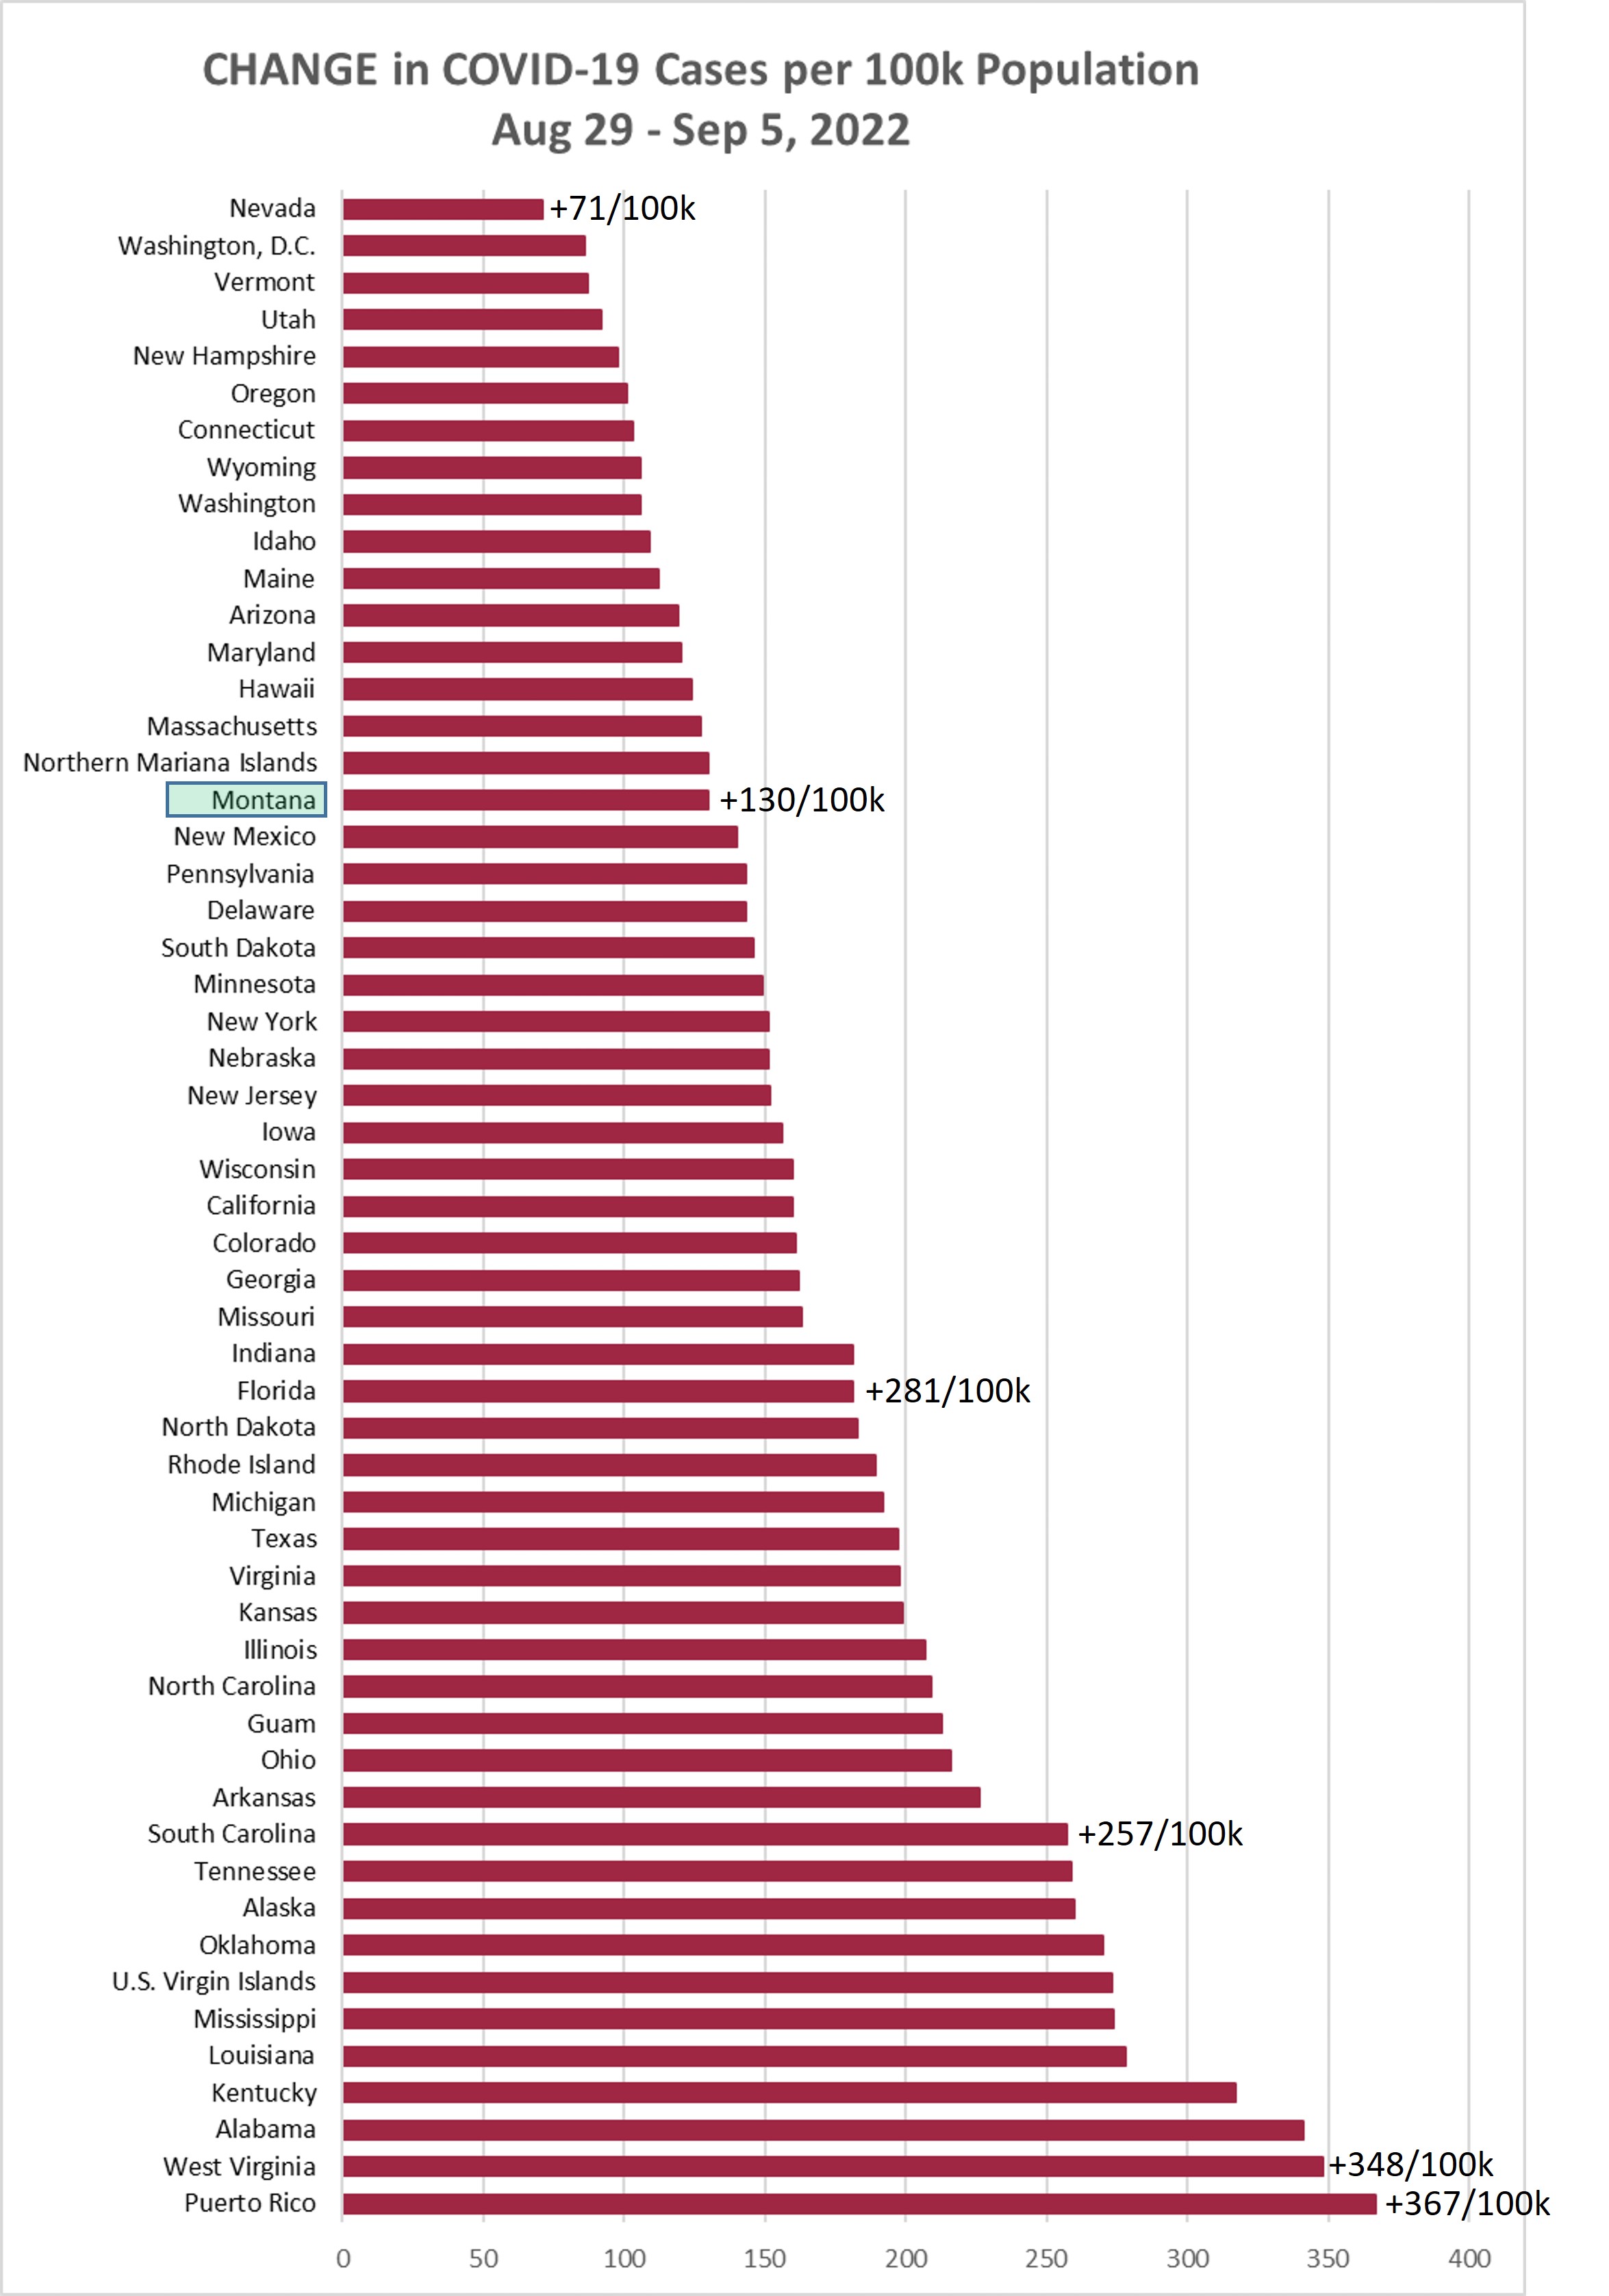
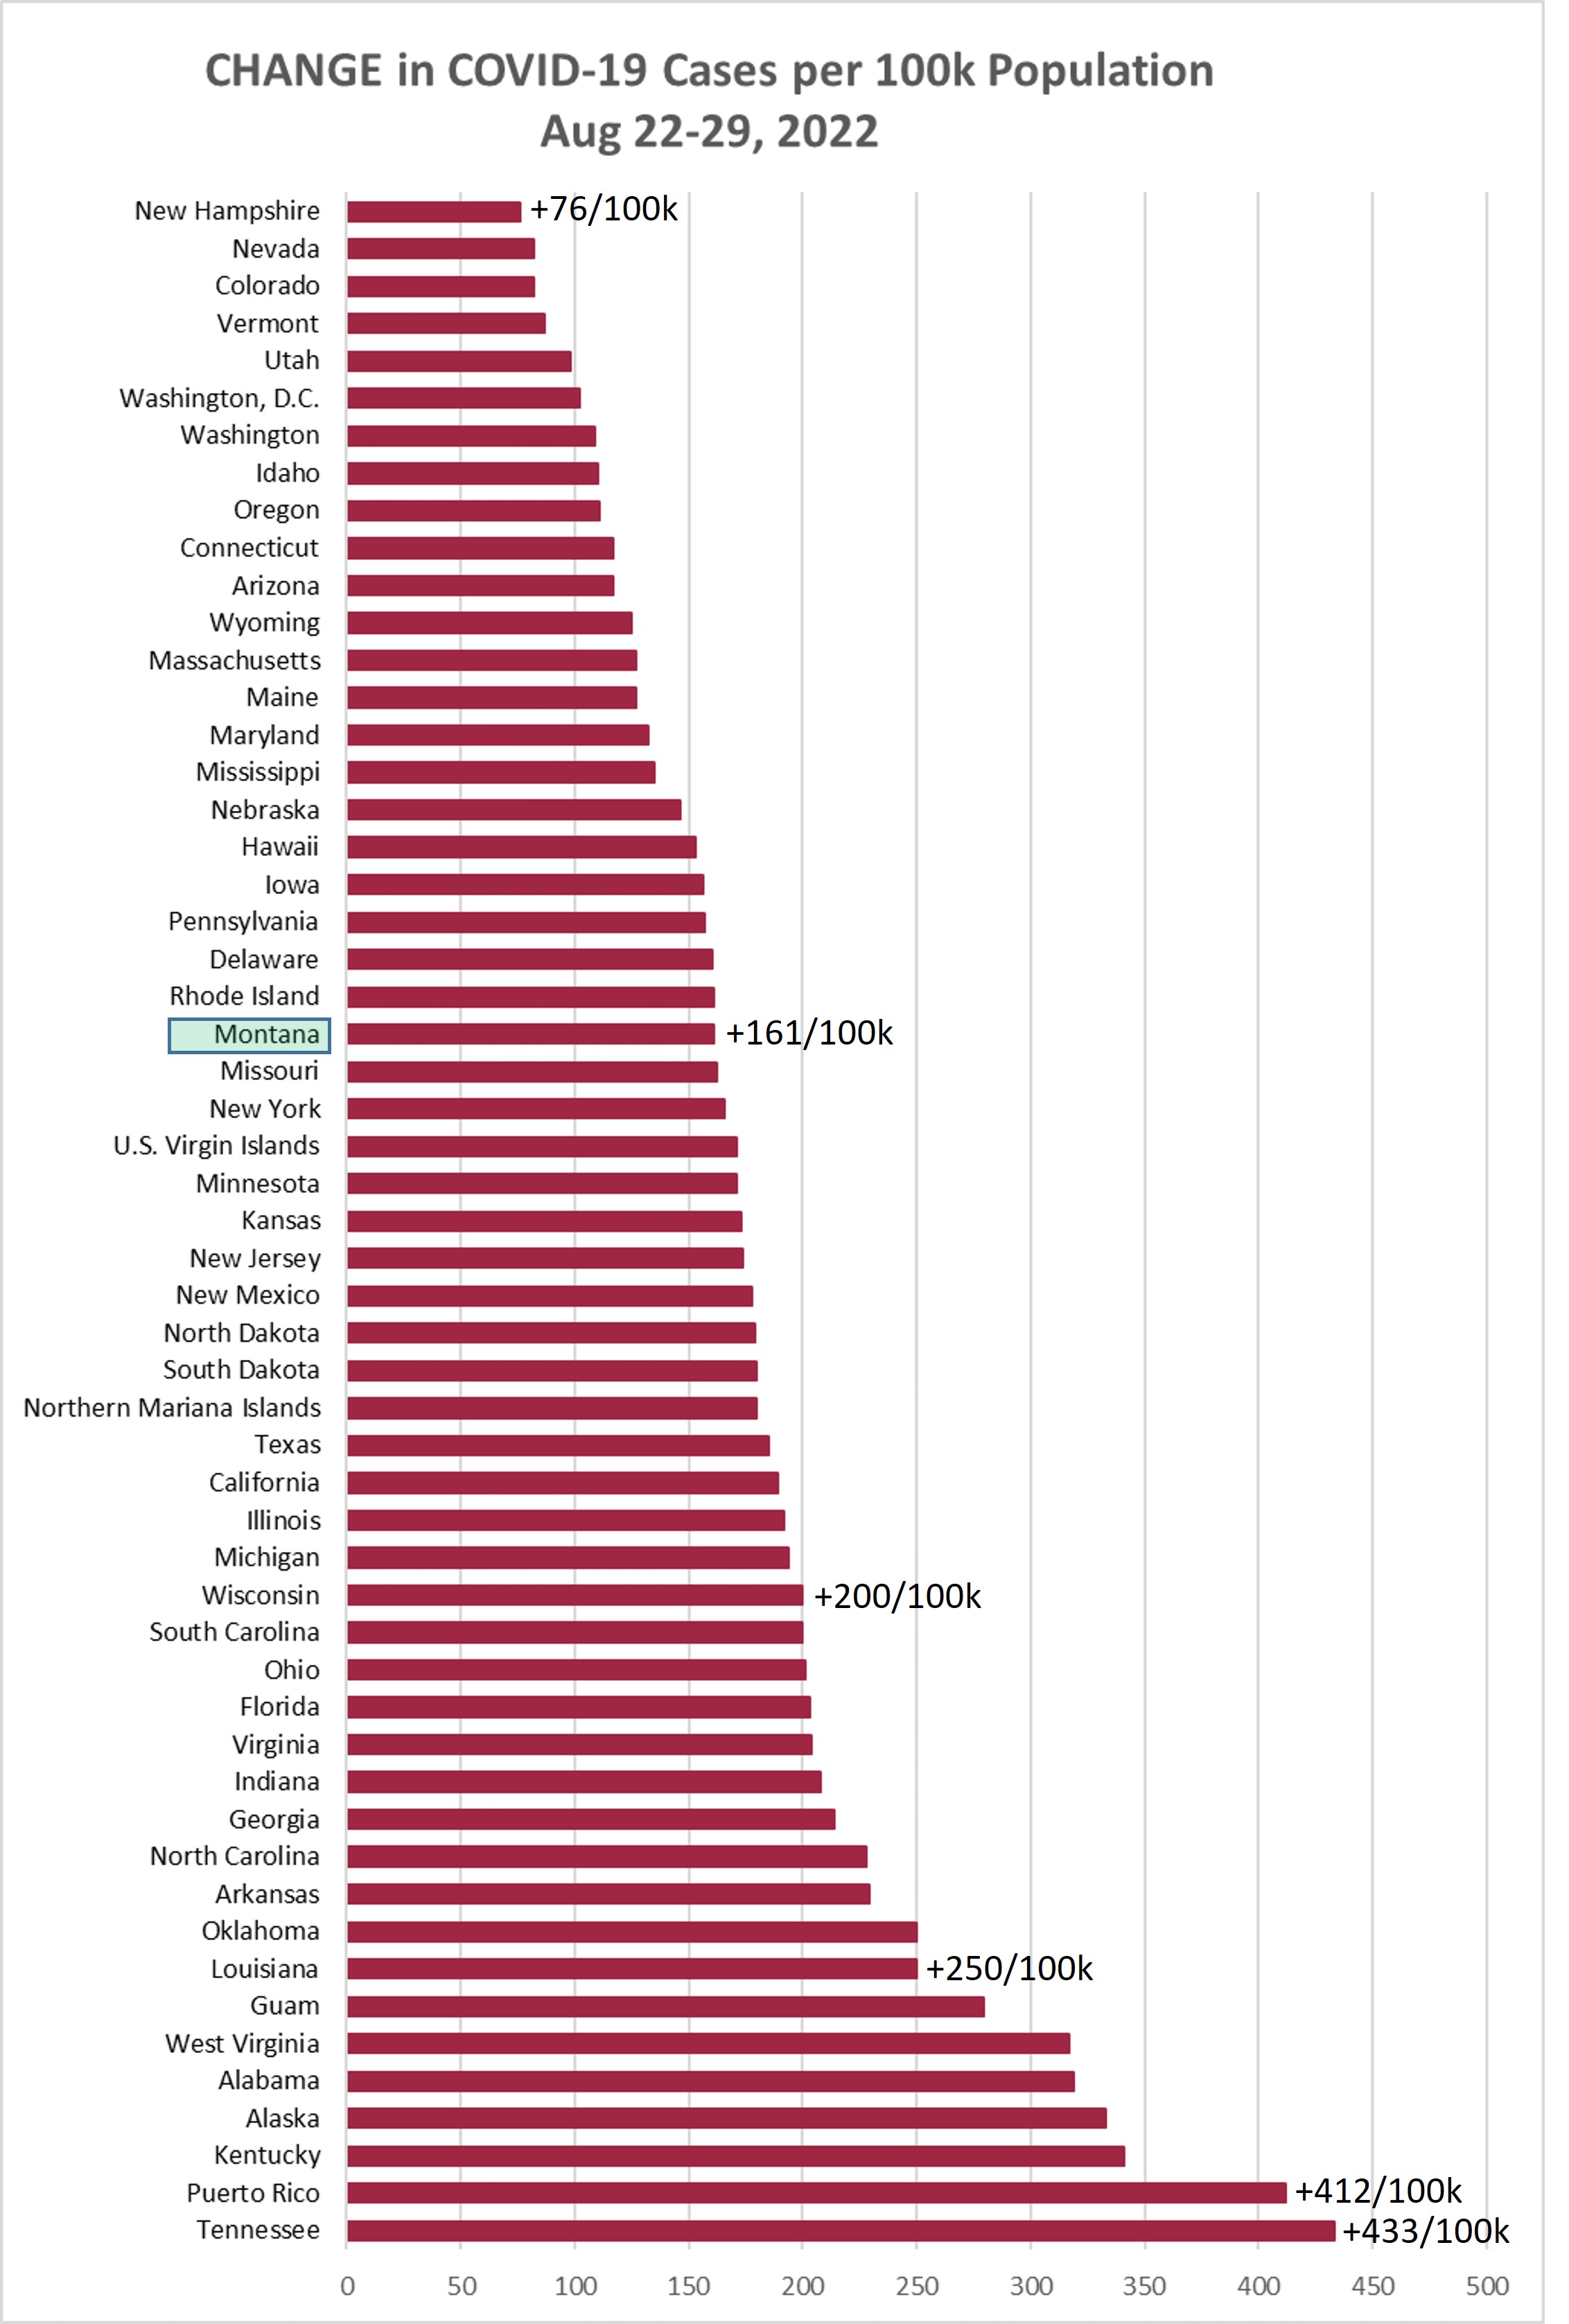
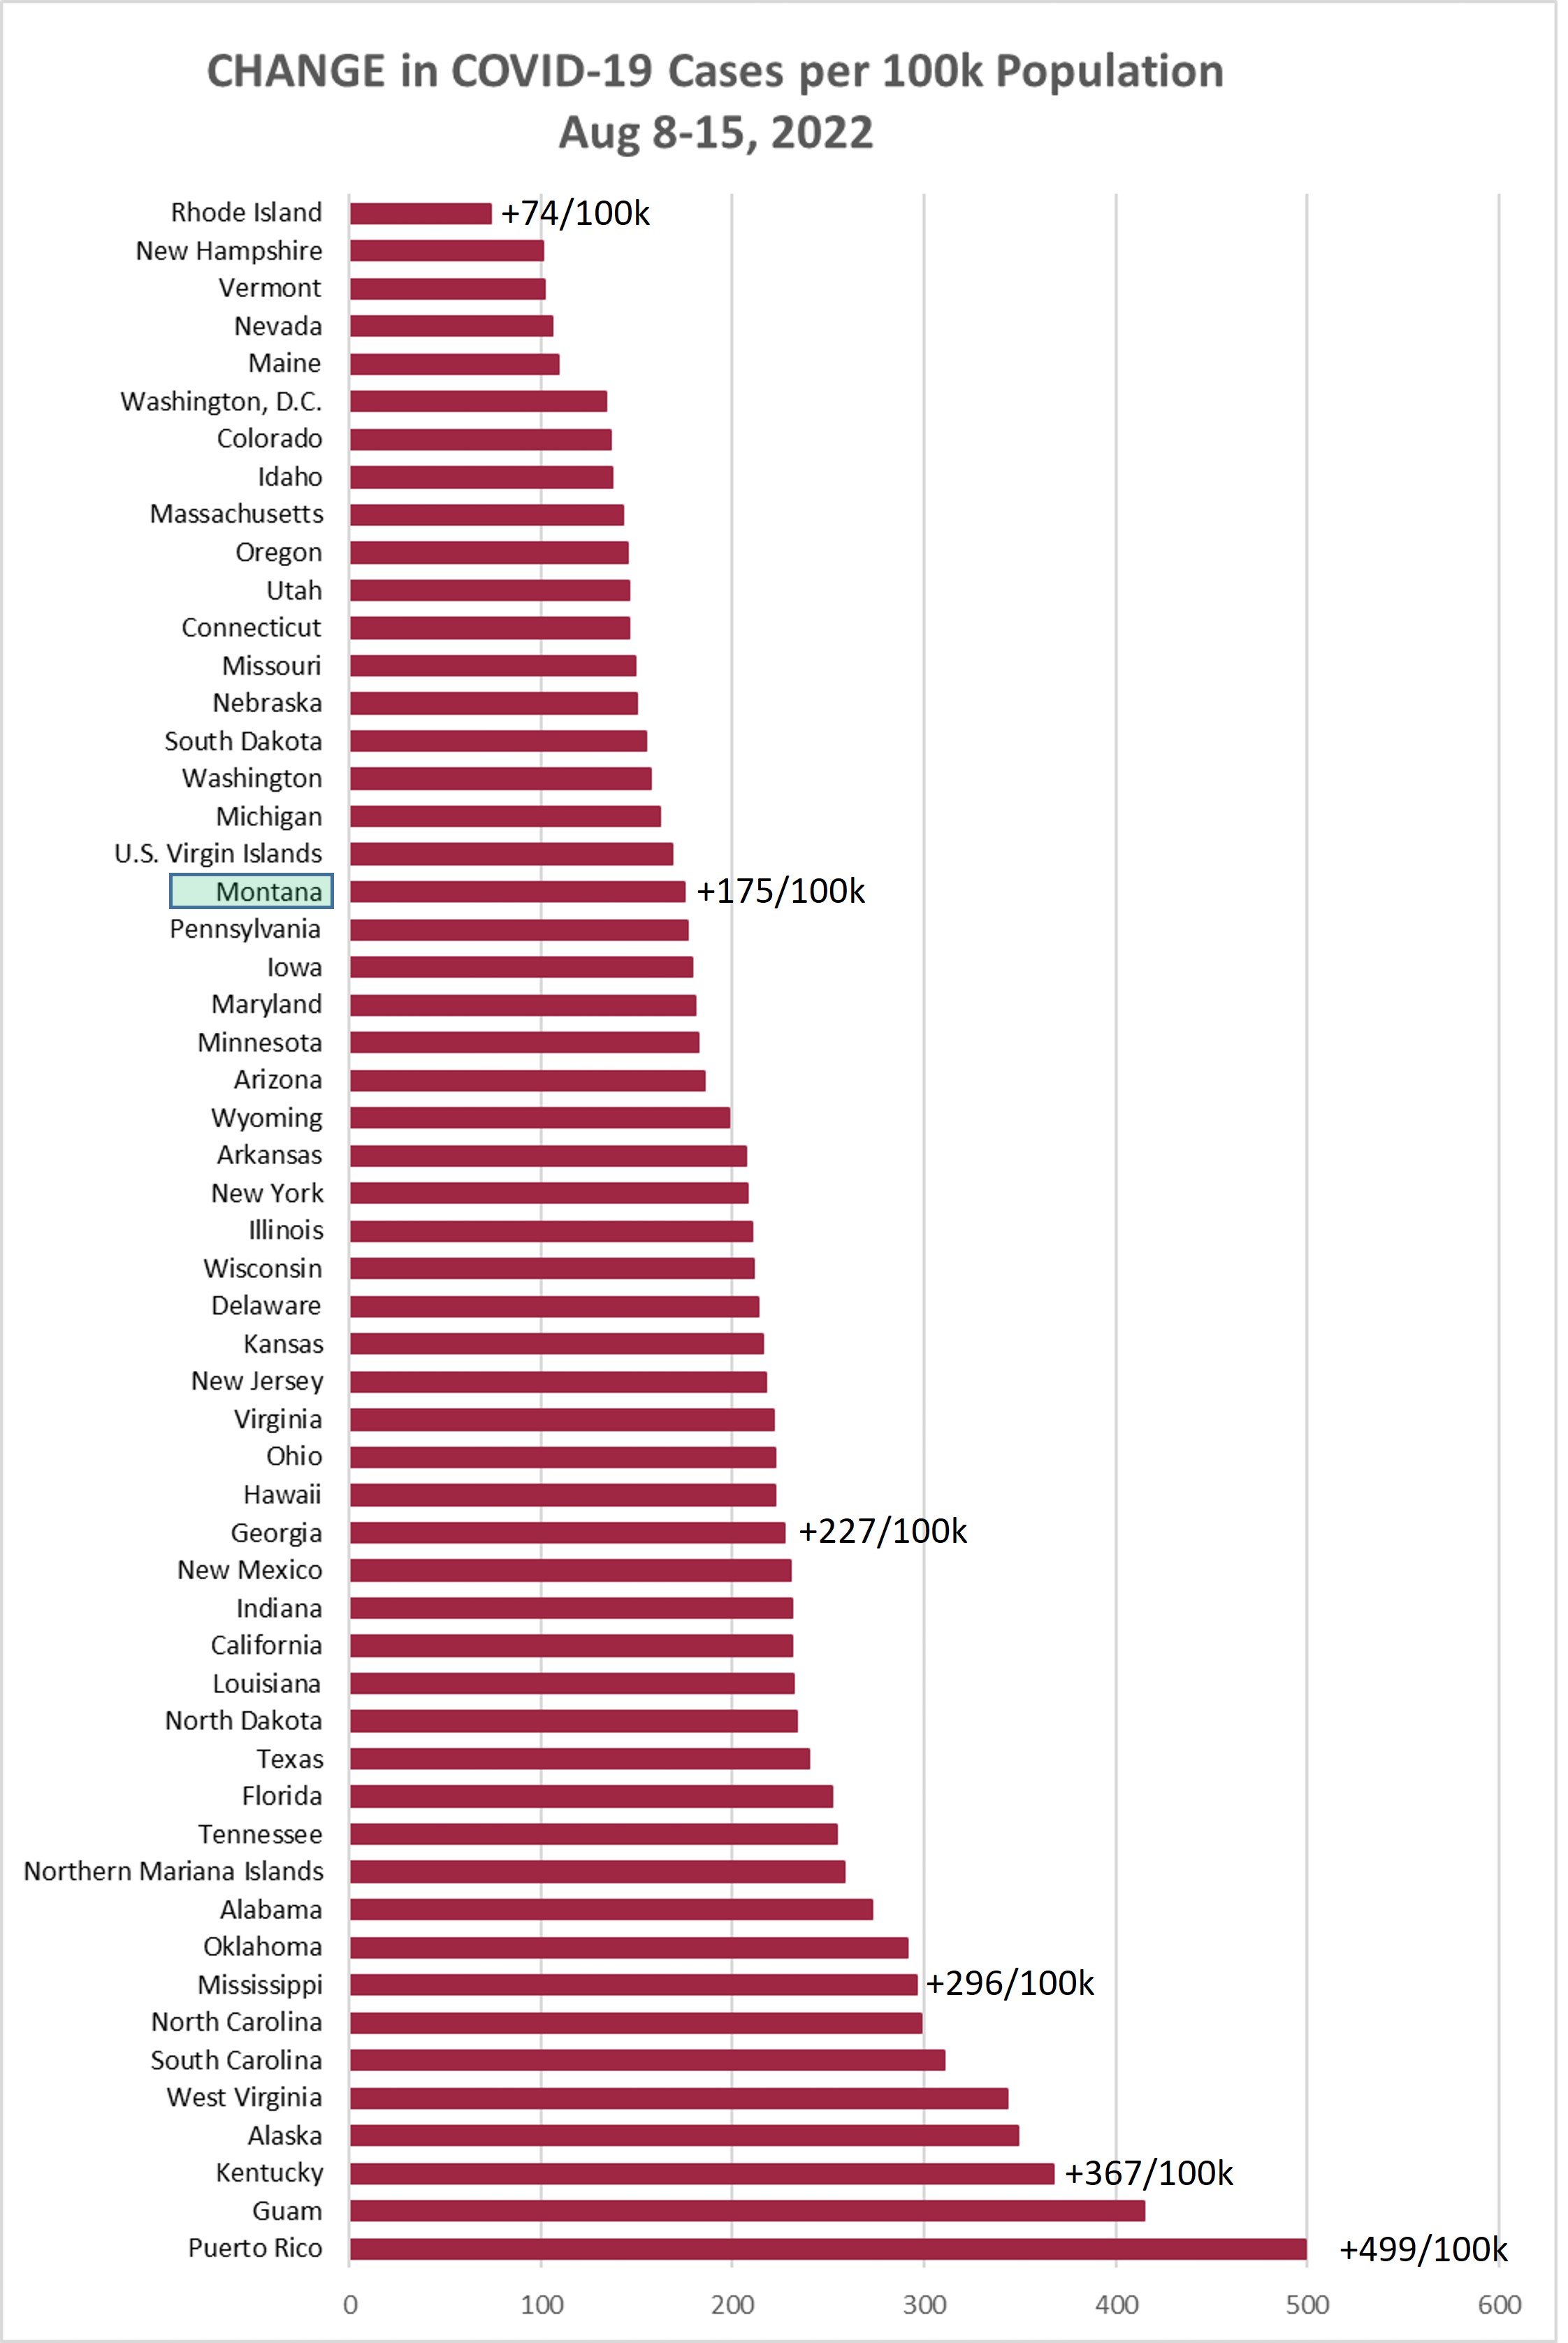
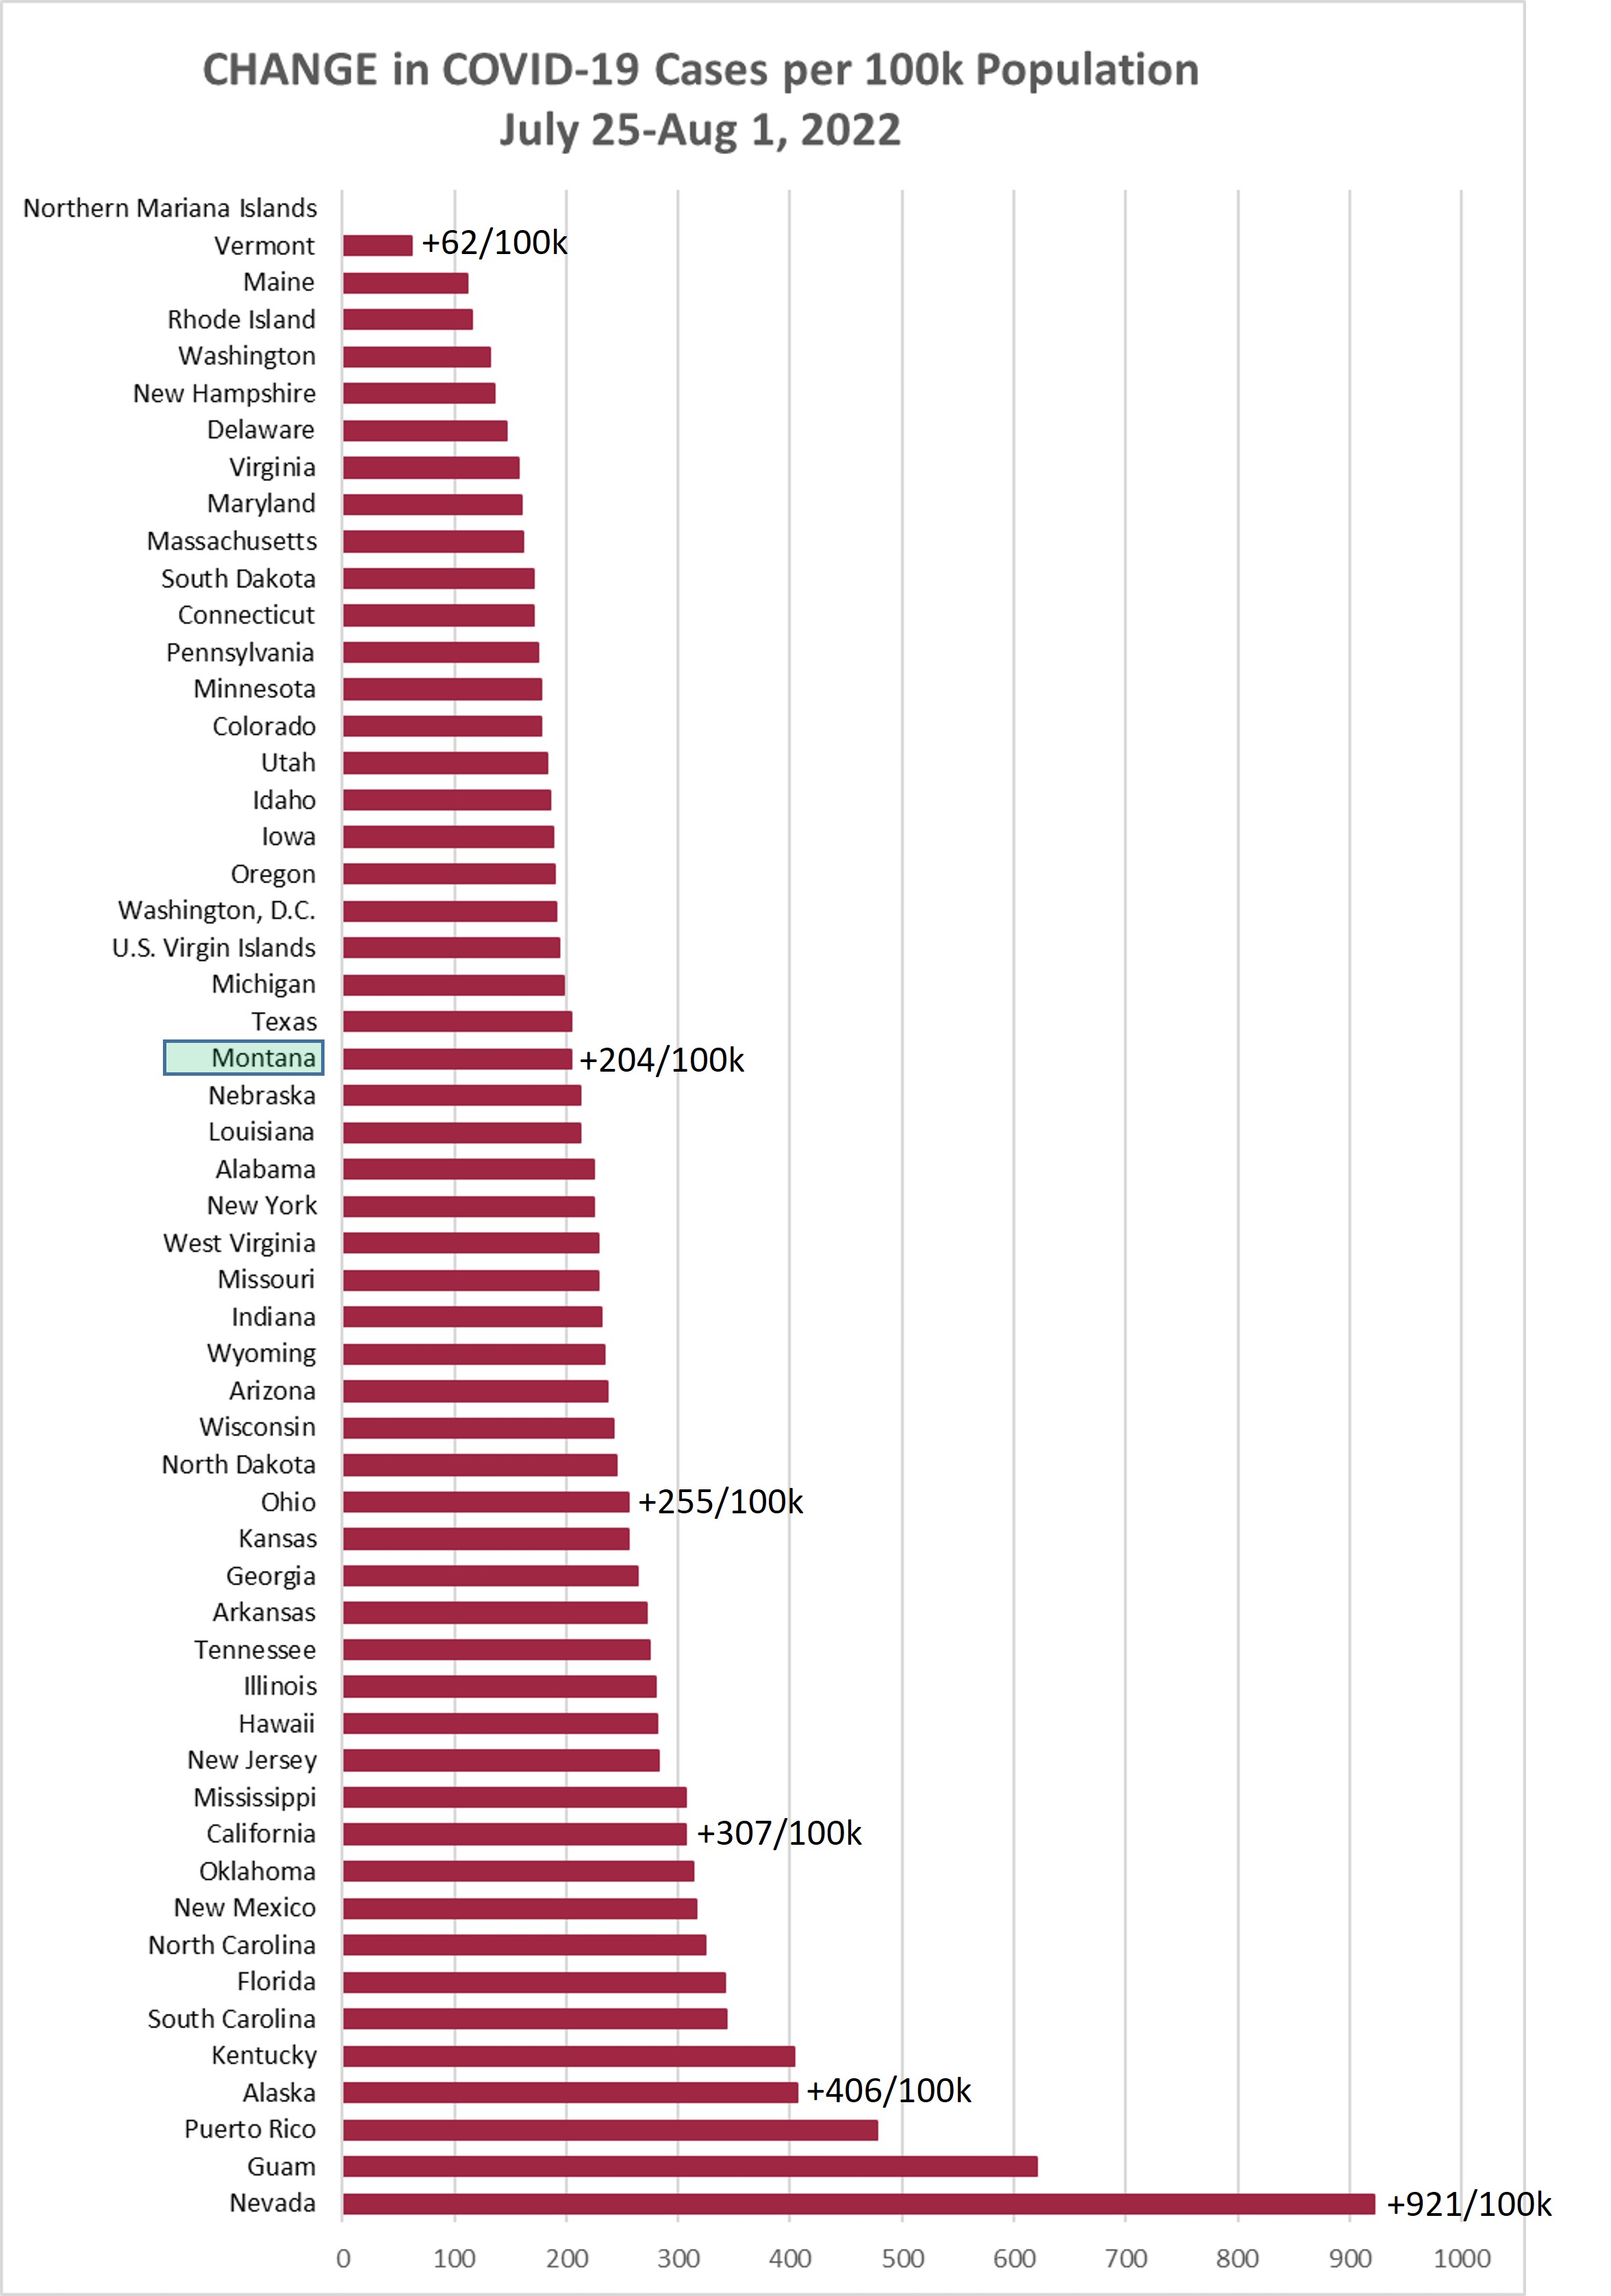
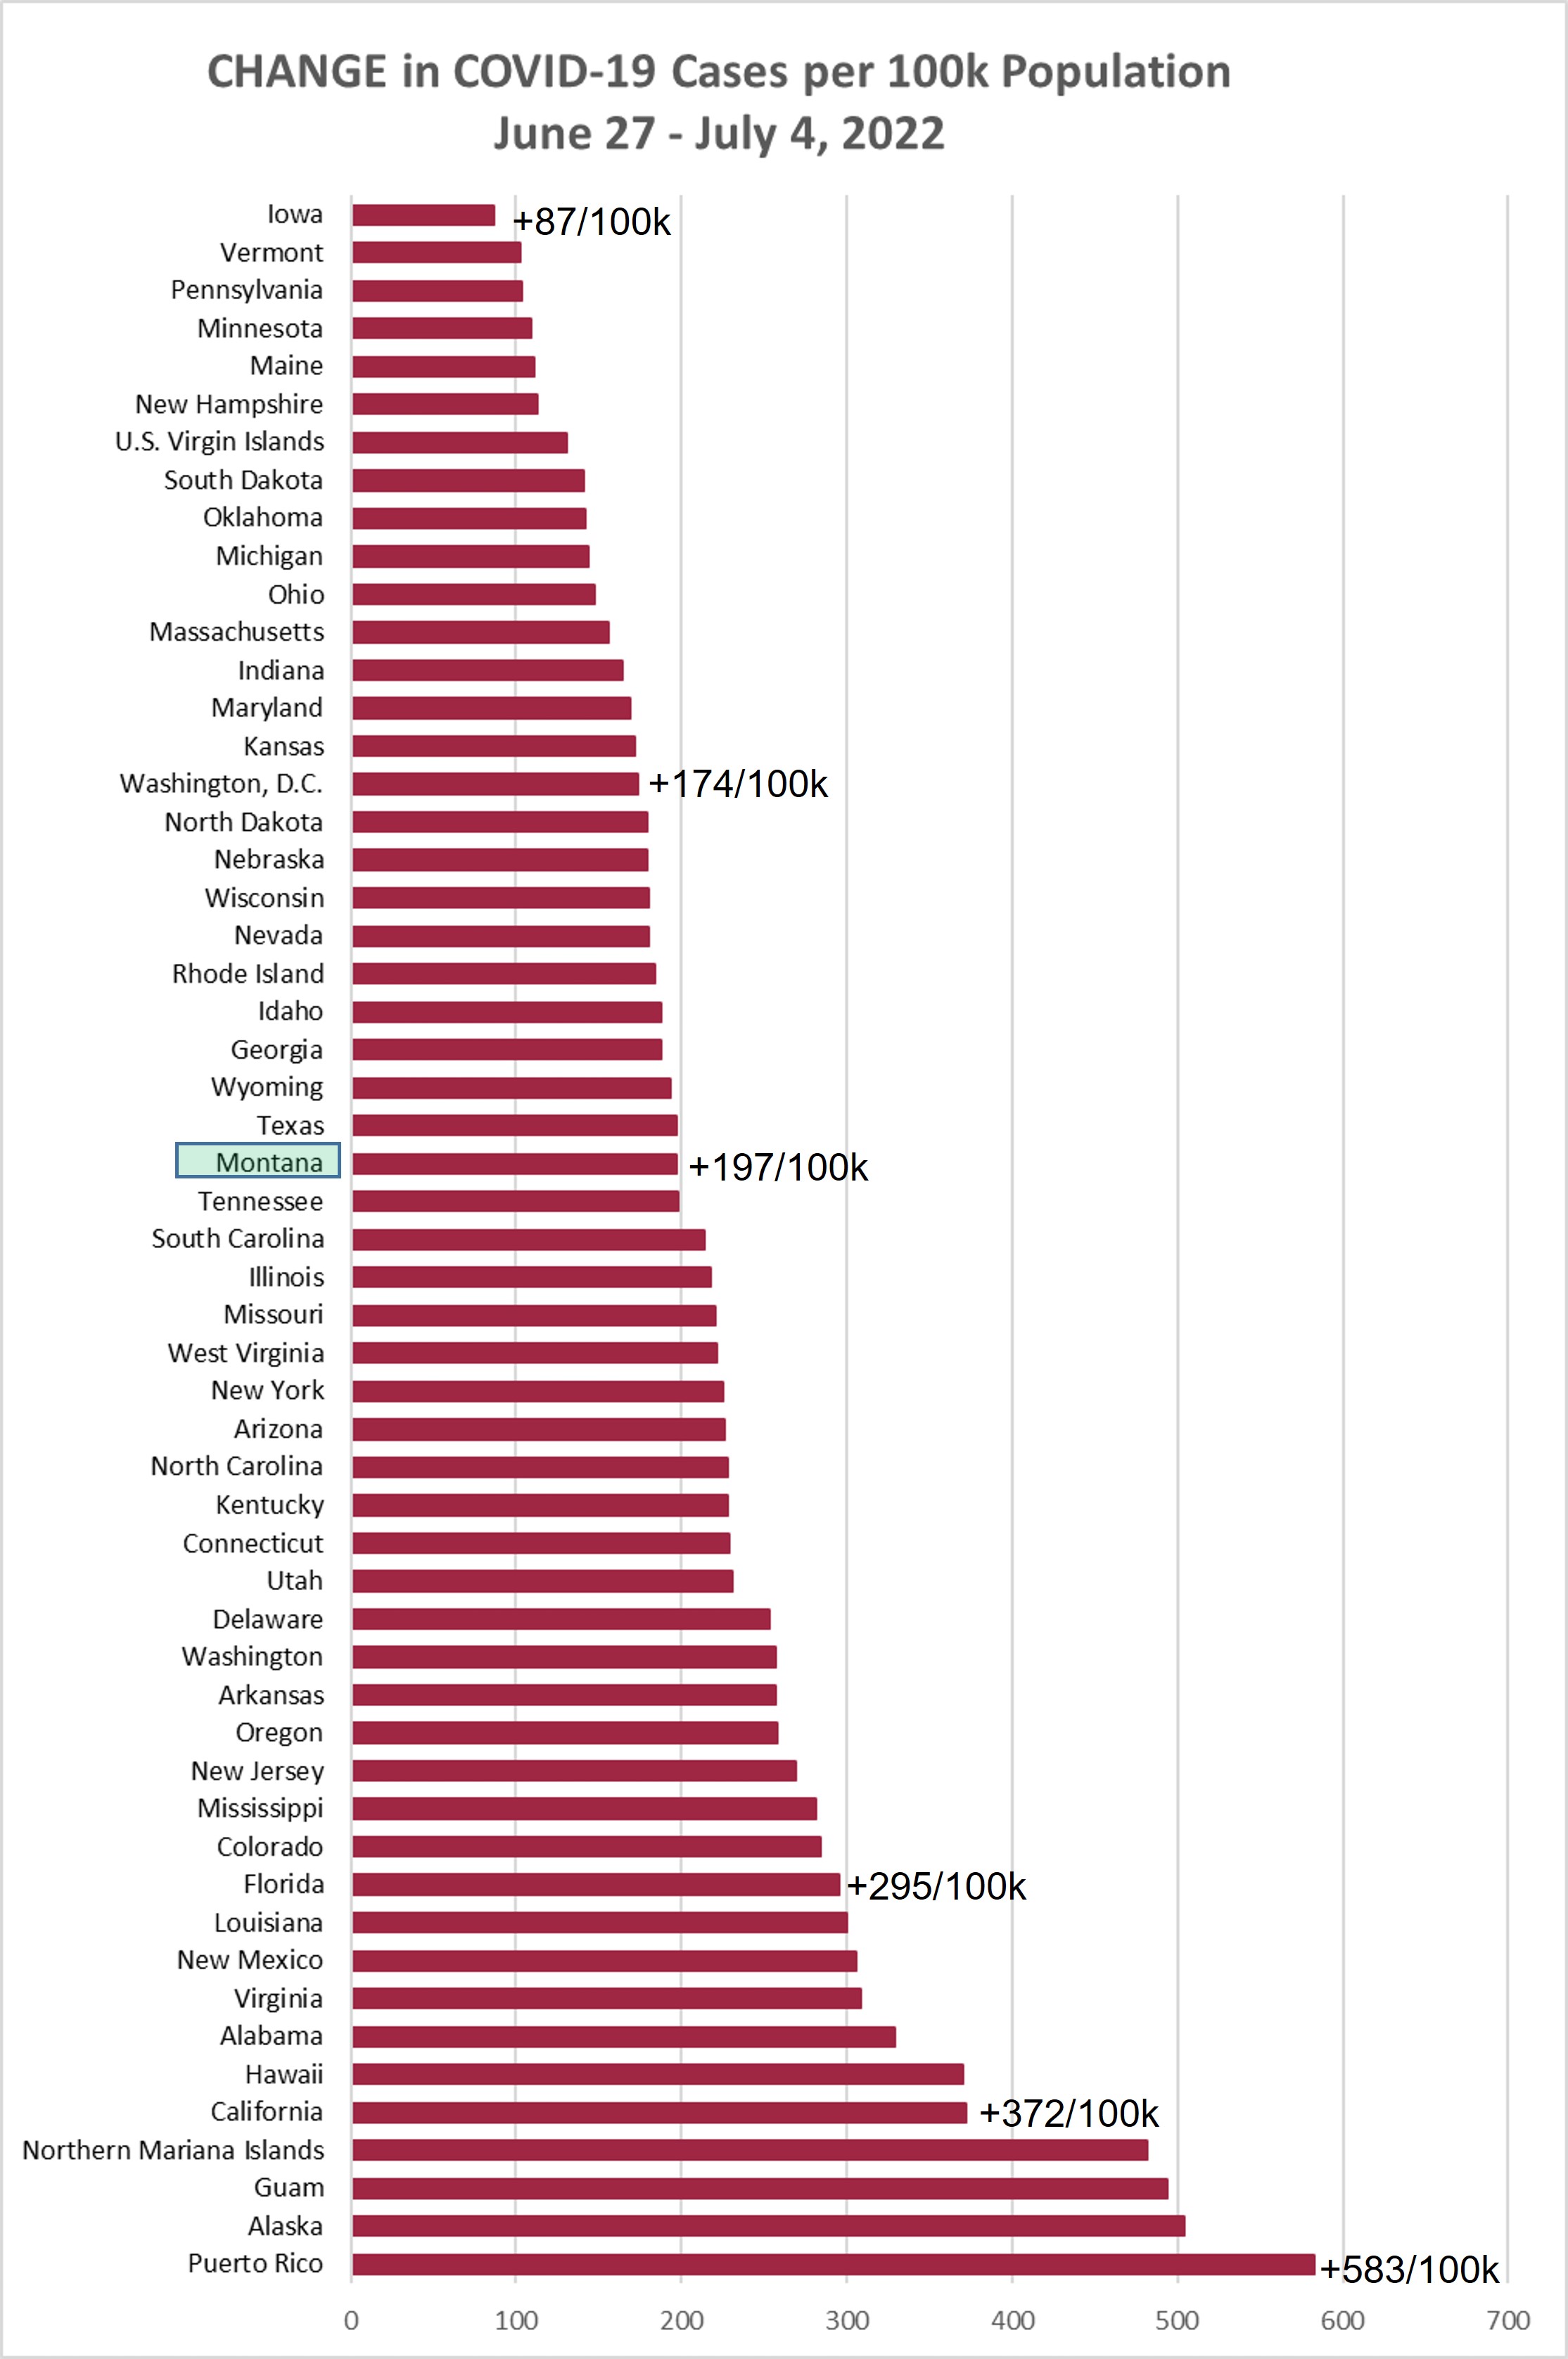
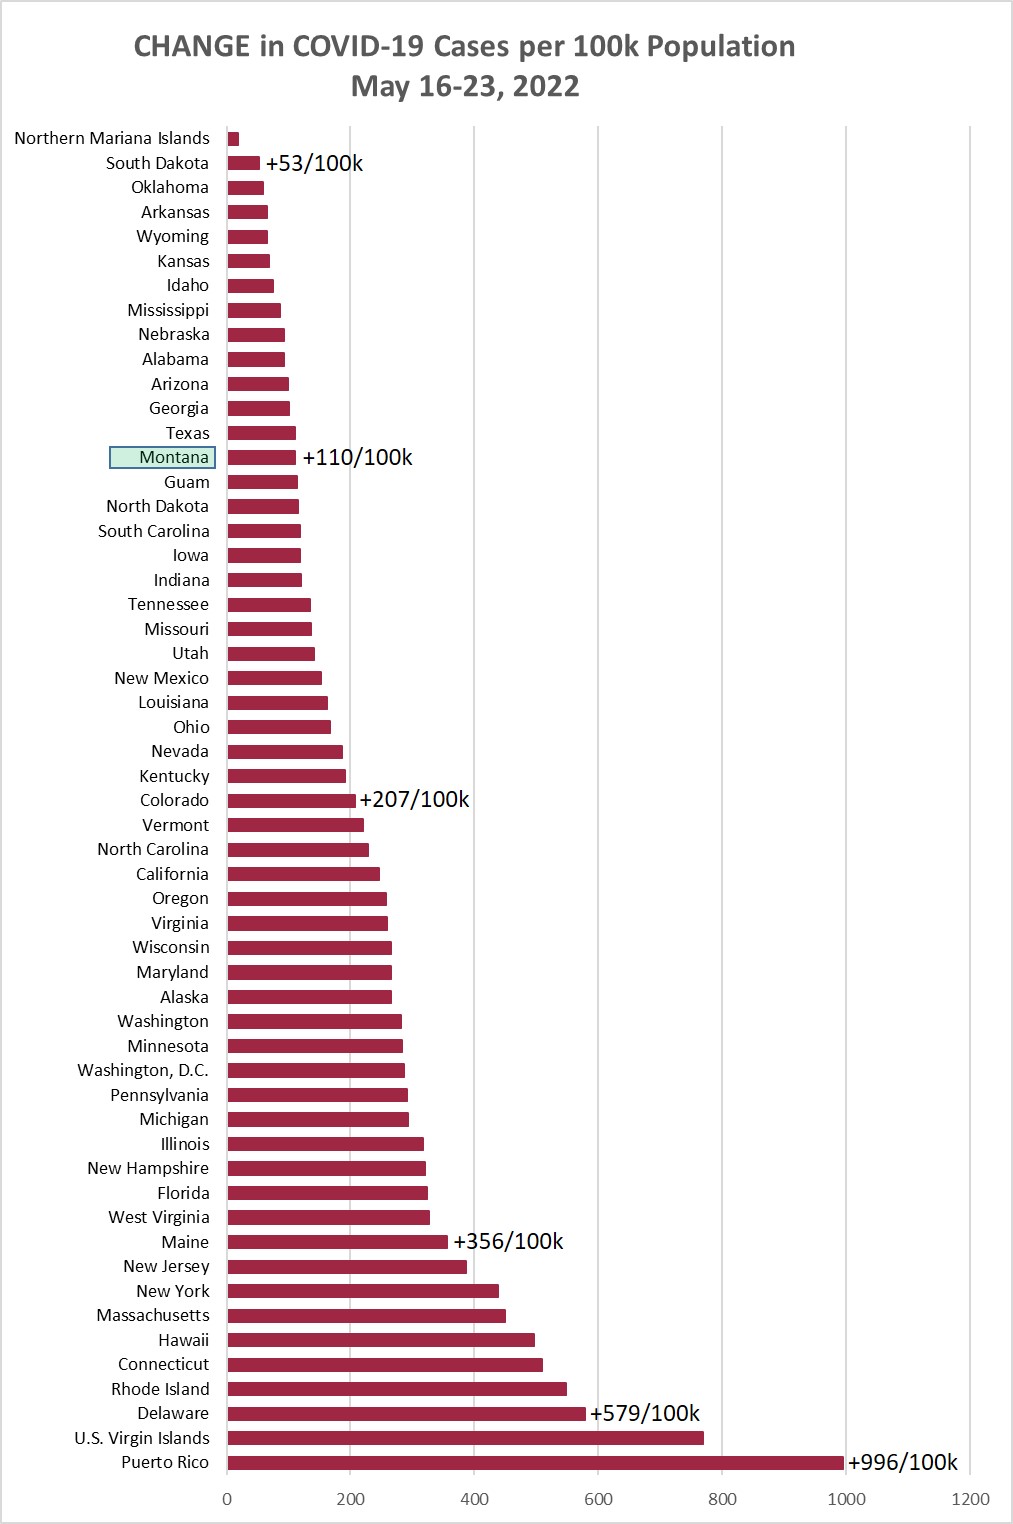
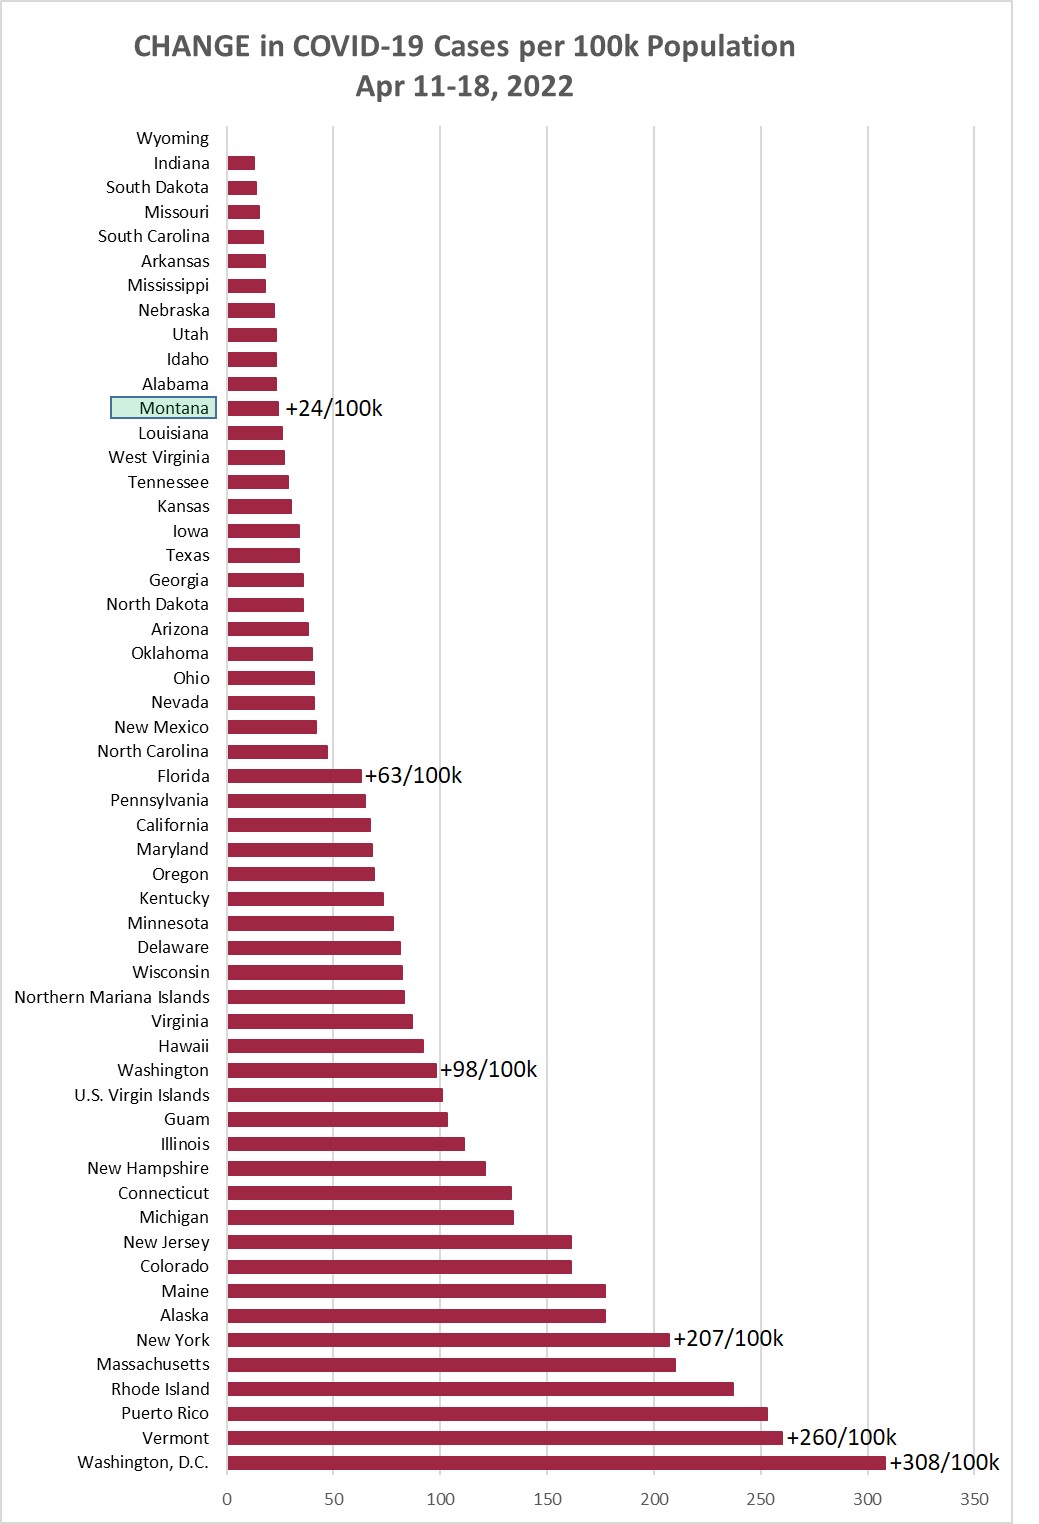
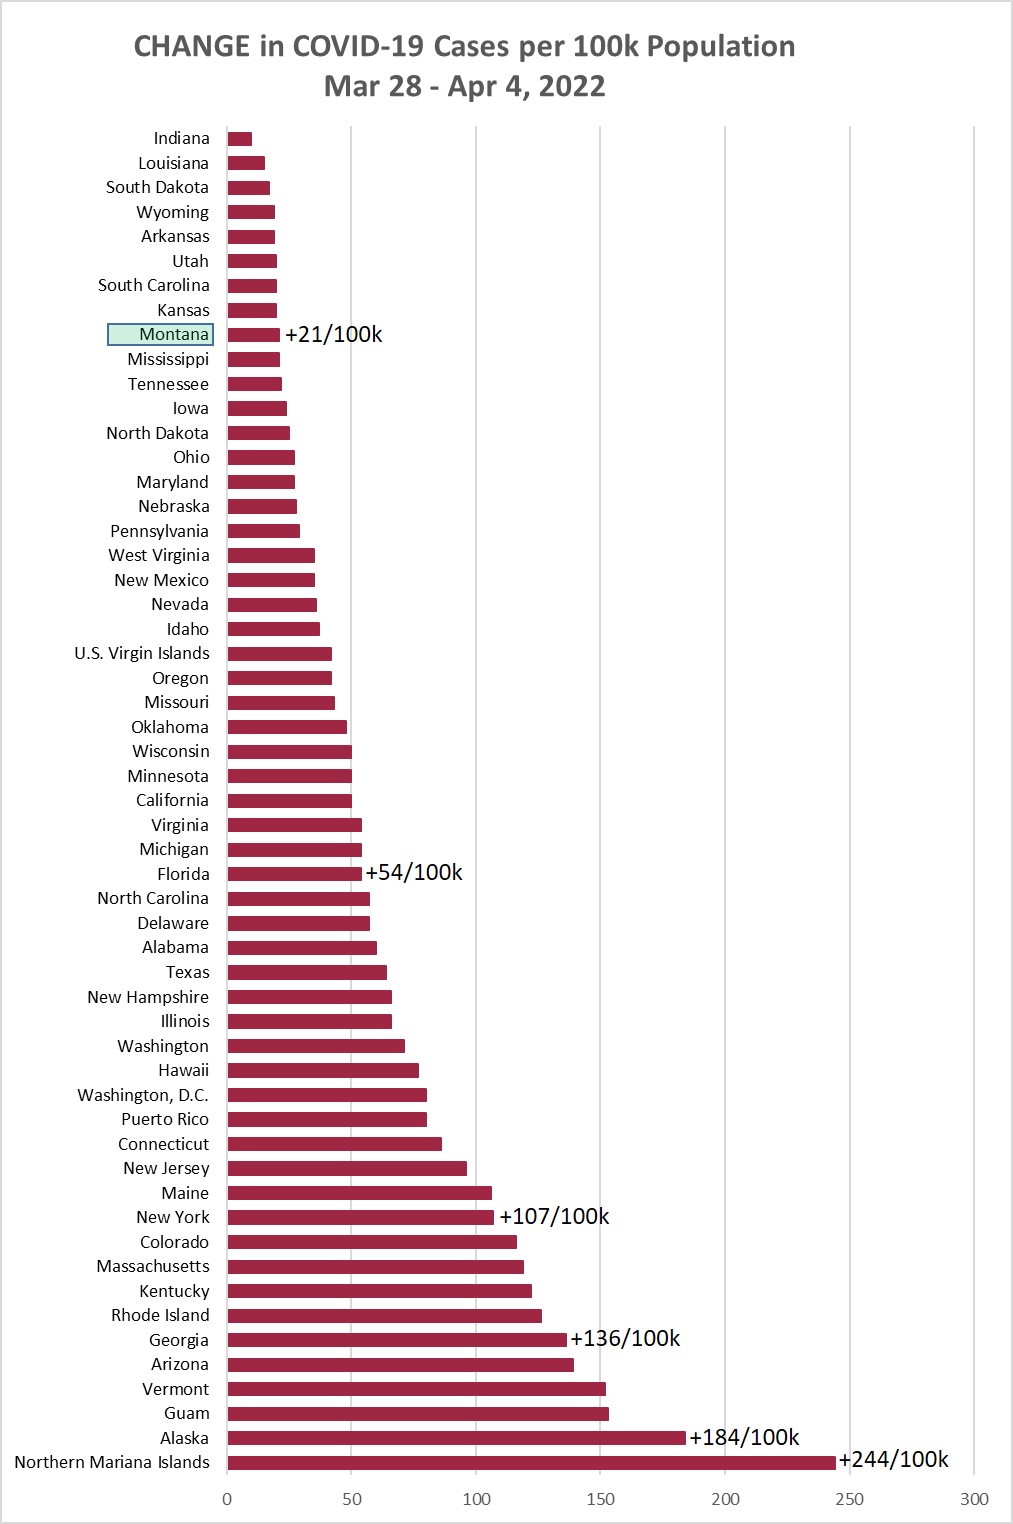
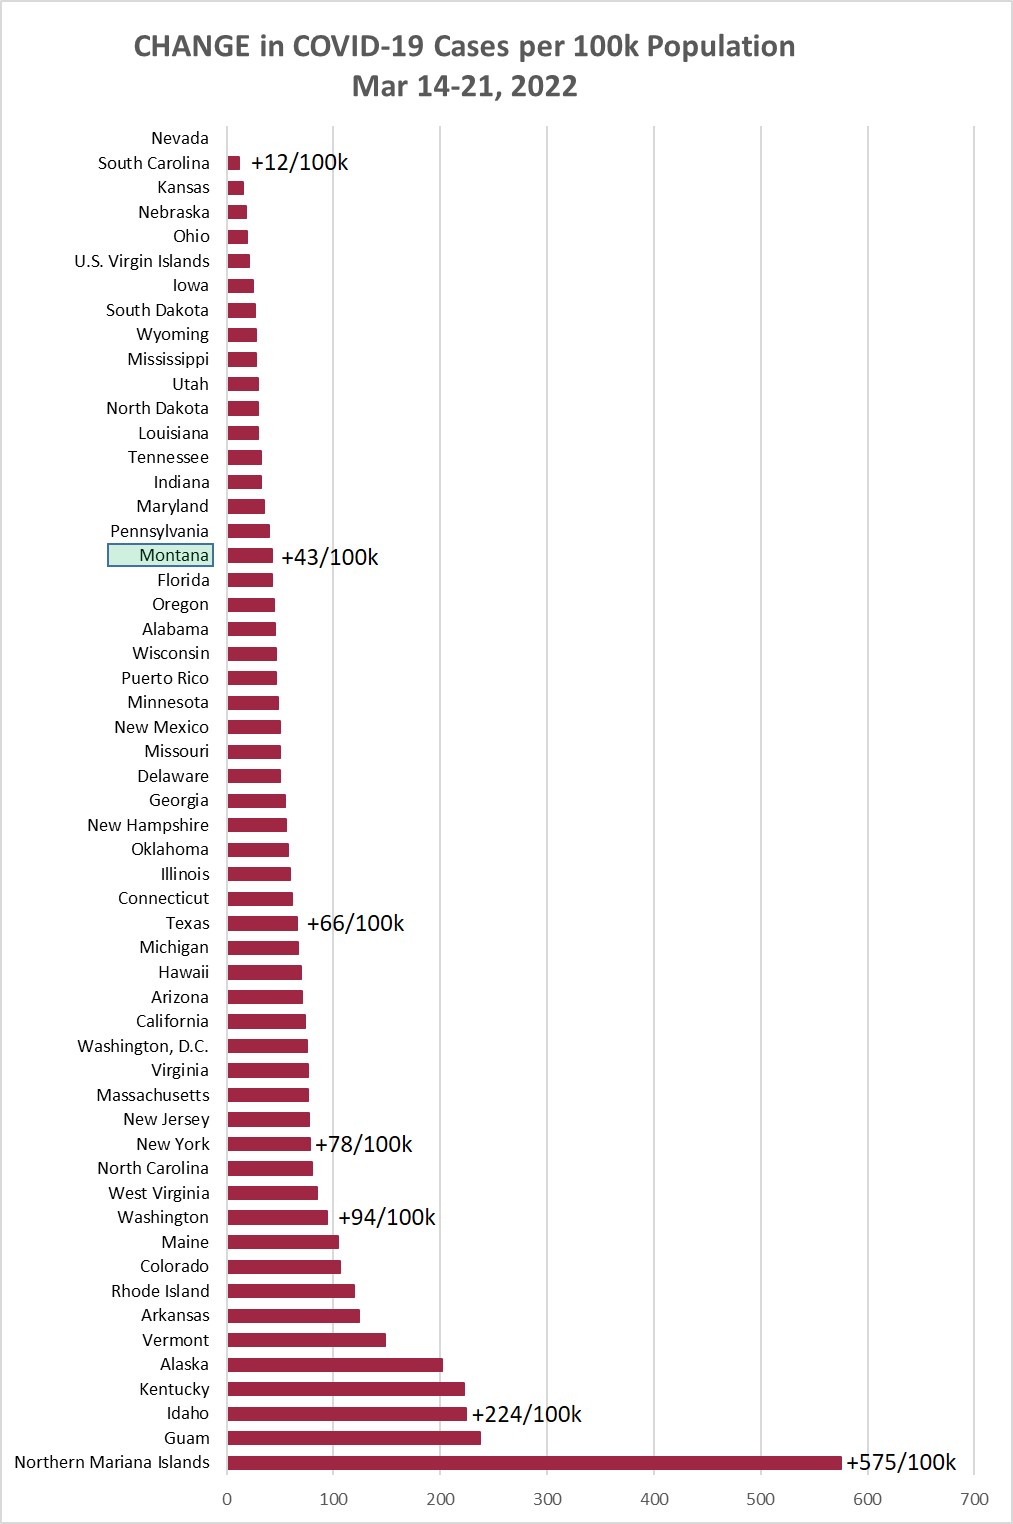
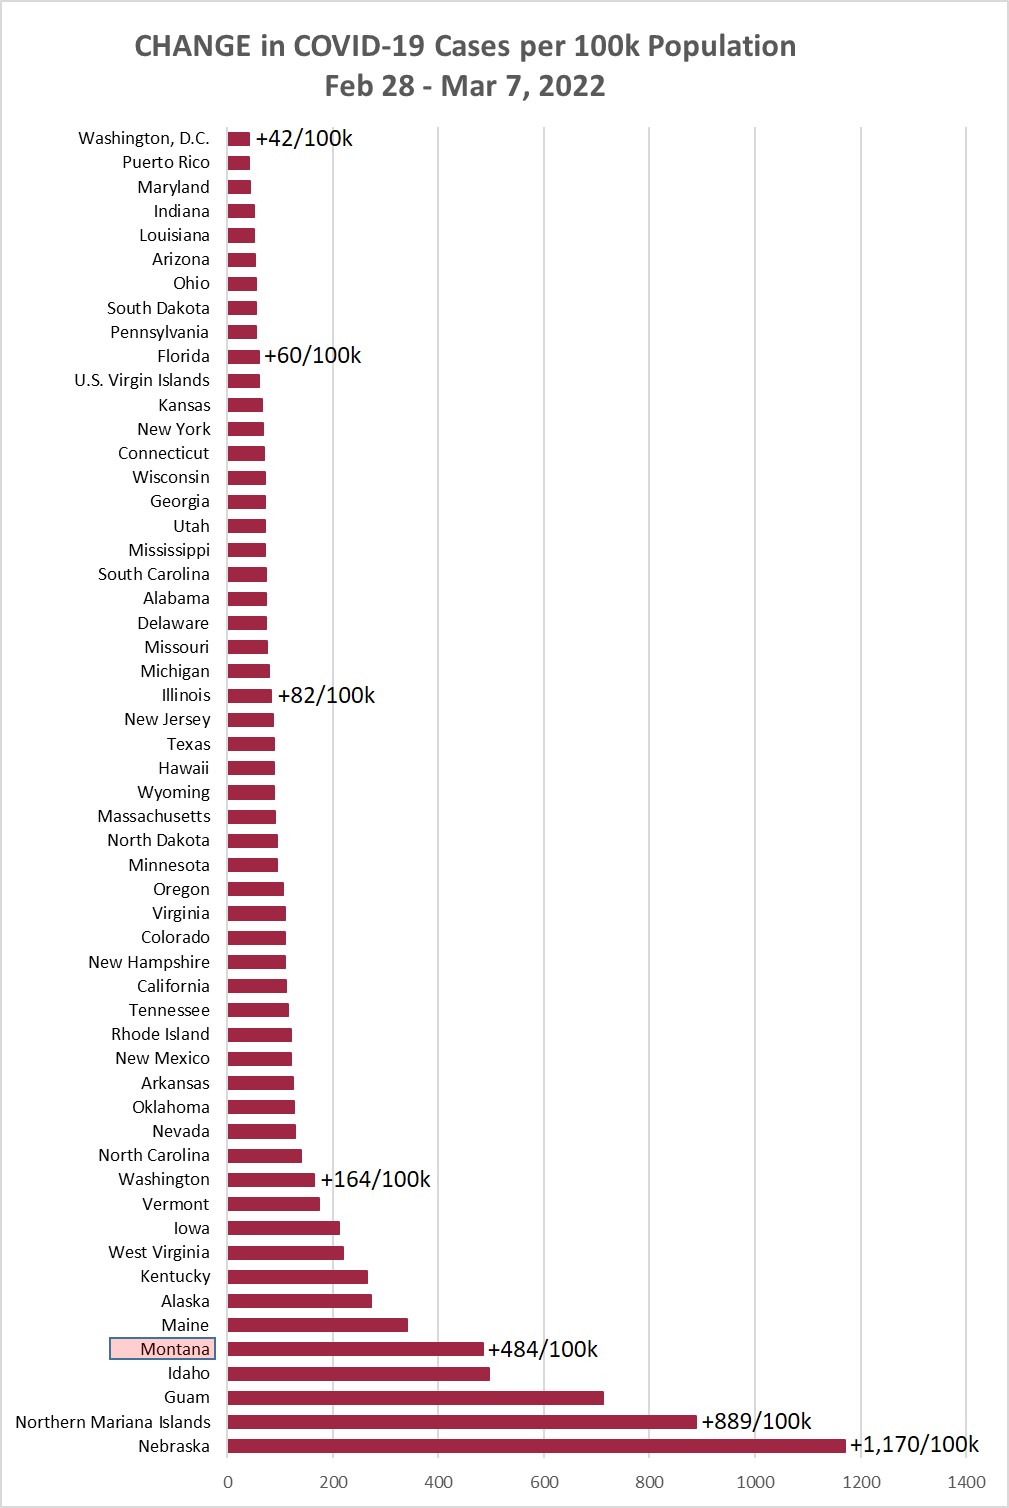
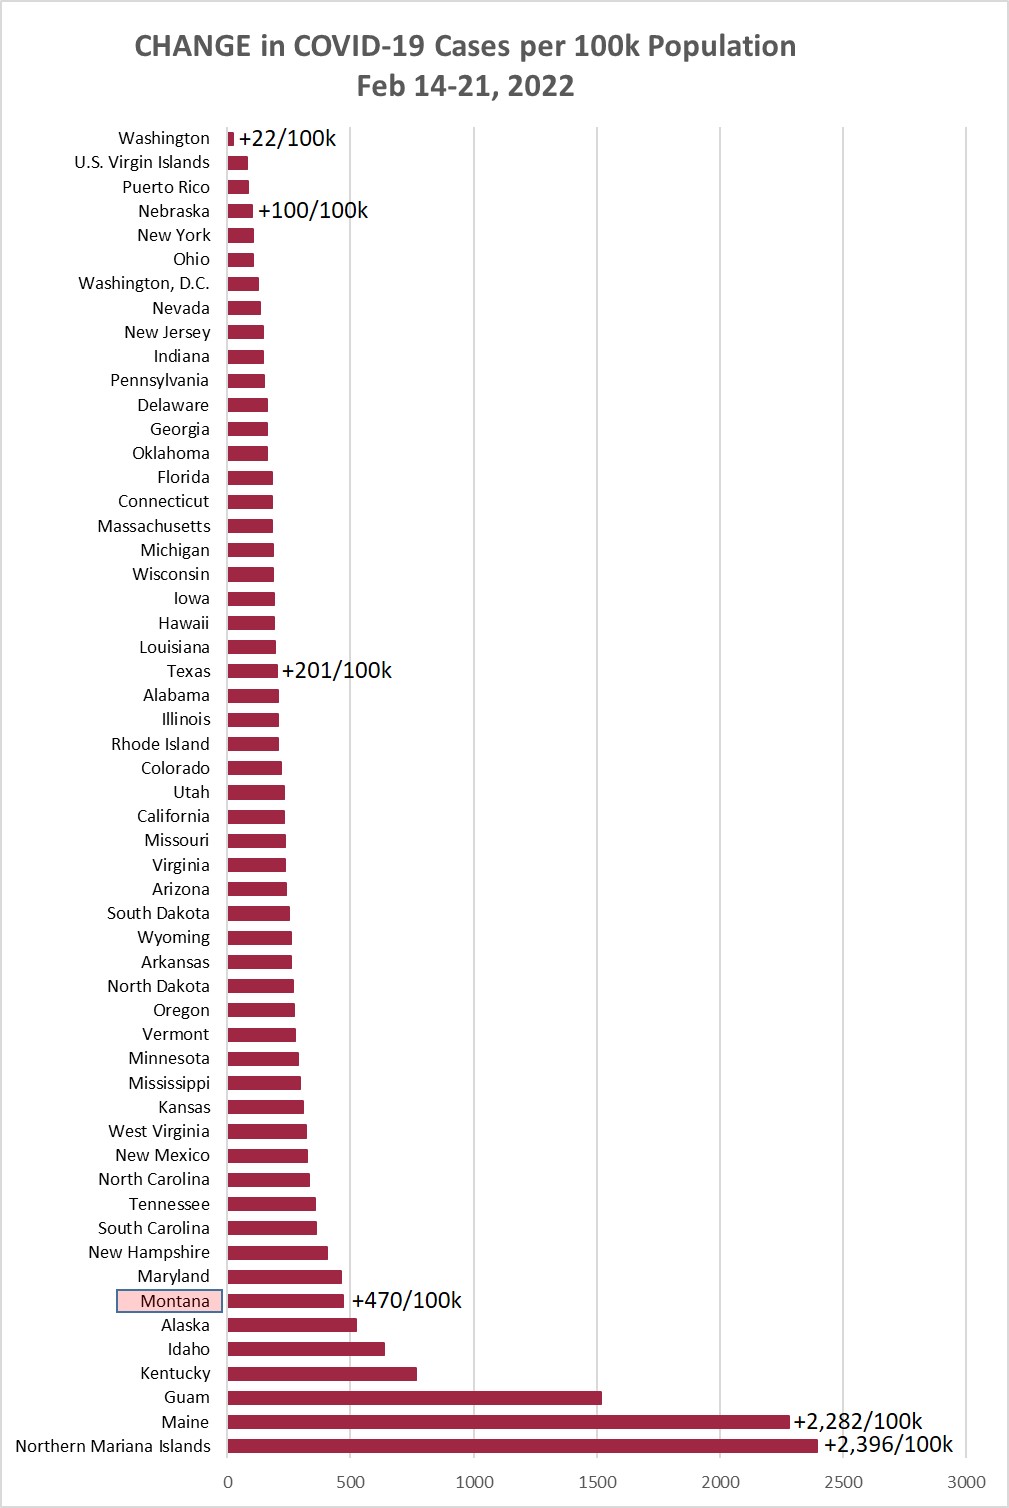
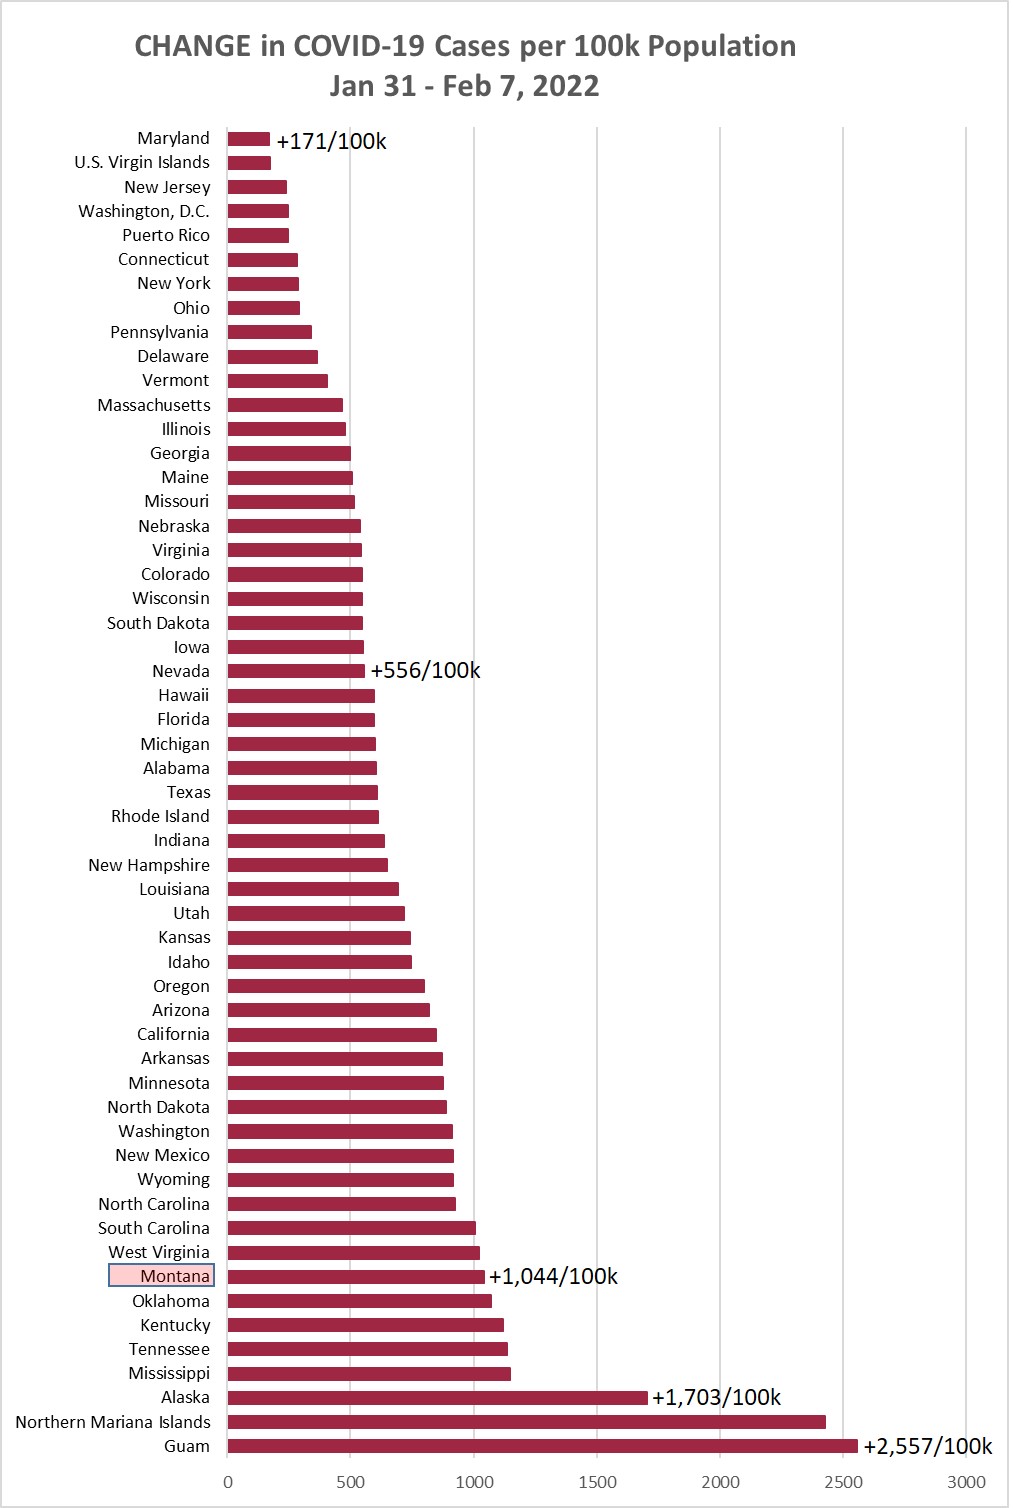
Chart 1 shows the change in cases per 100,000 population as of this morning (February
7, 2022) compared to the cases per 100,000 on January 31, 2022. Montana was up +1,044/100k
this week, compared to +1,576/100k the prior week, and +947/100k the week before that.
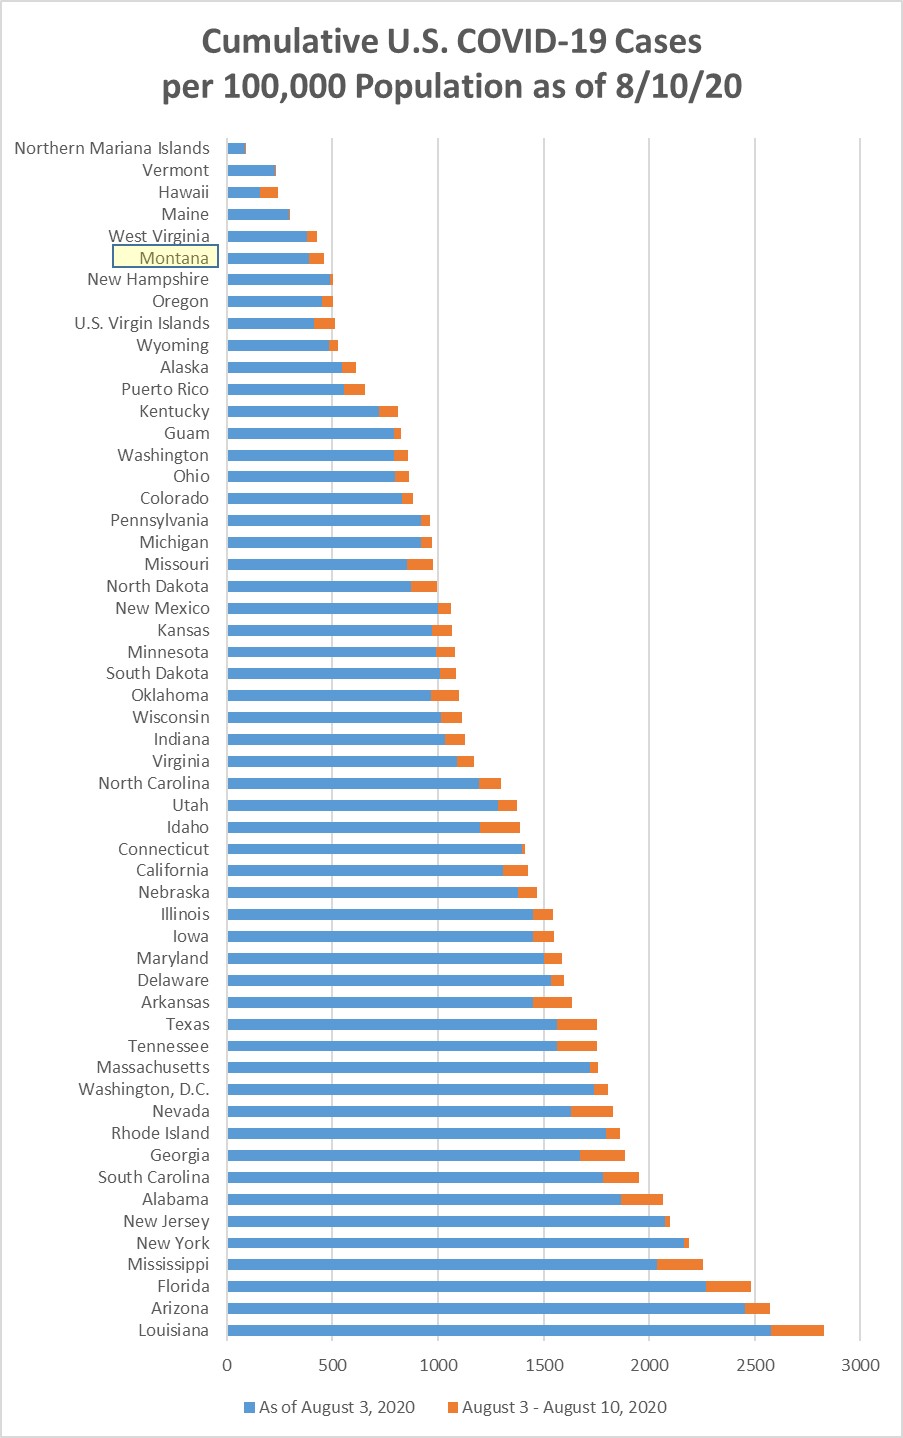
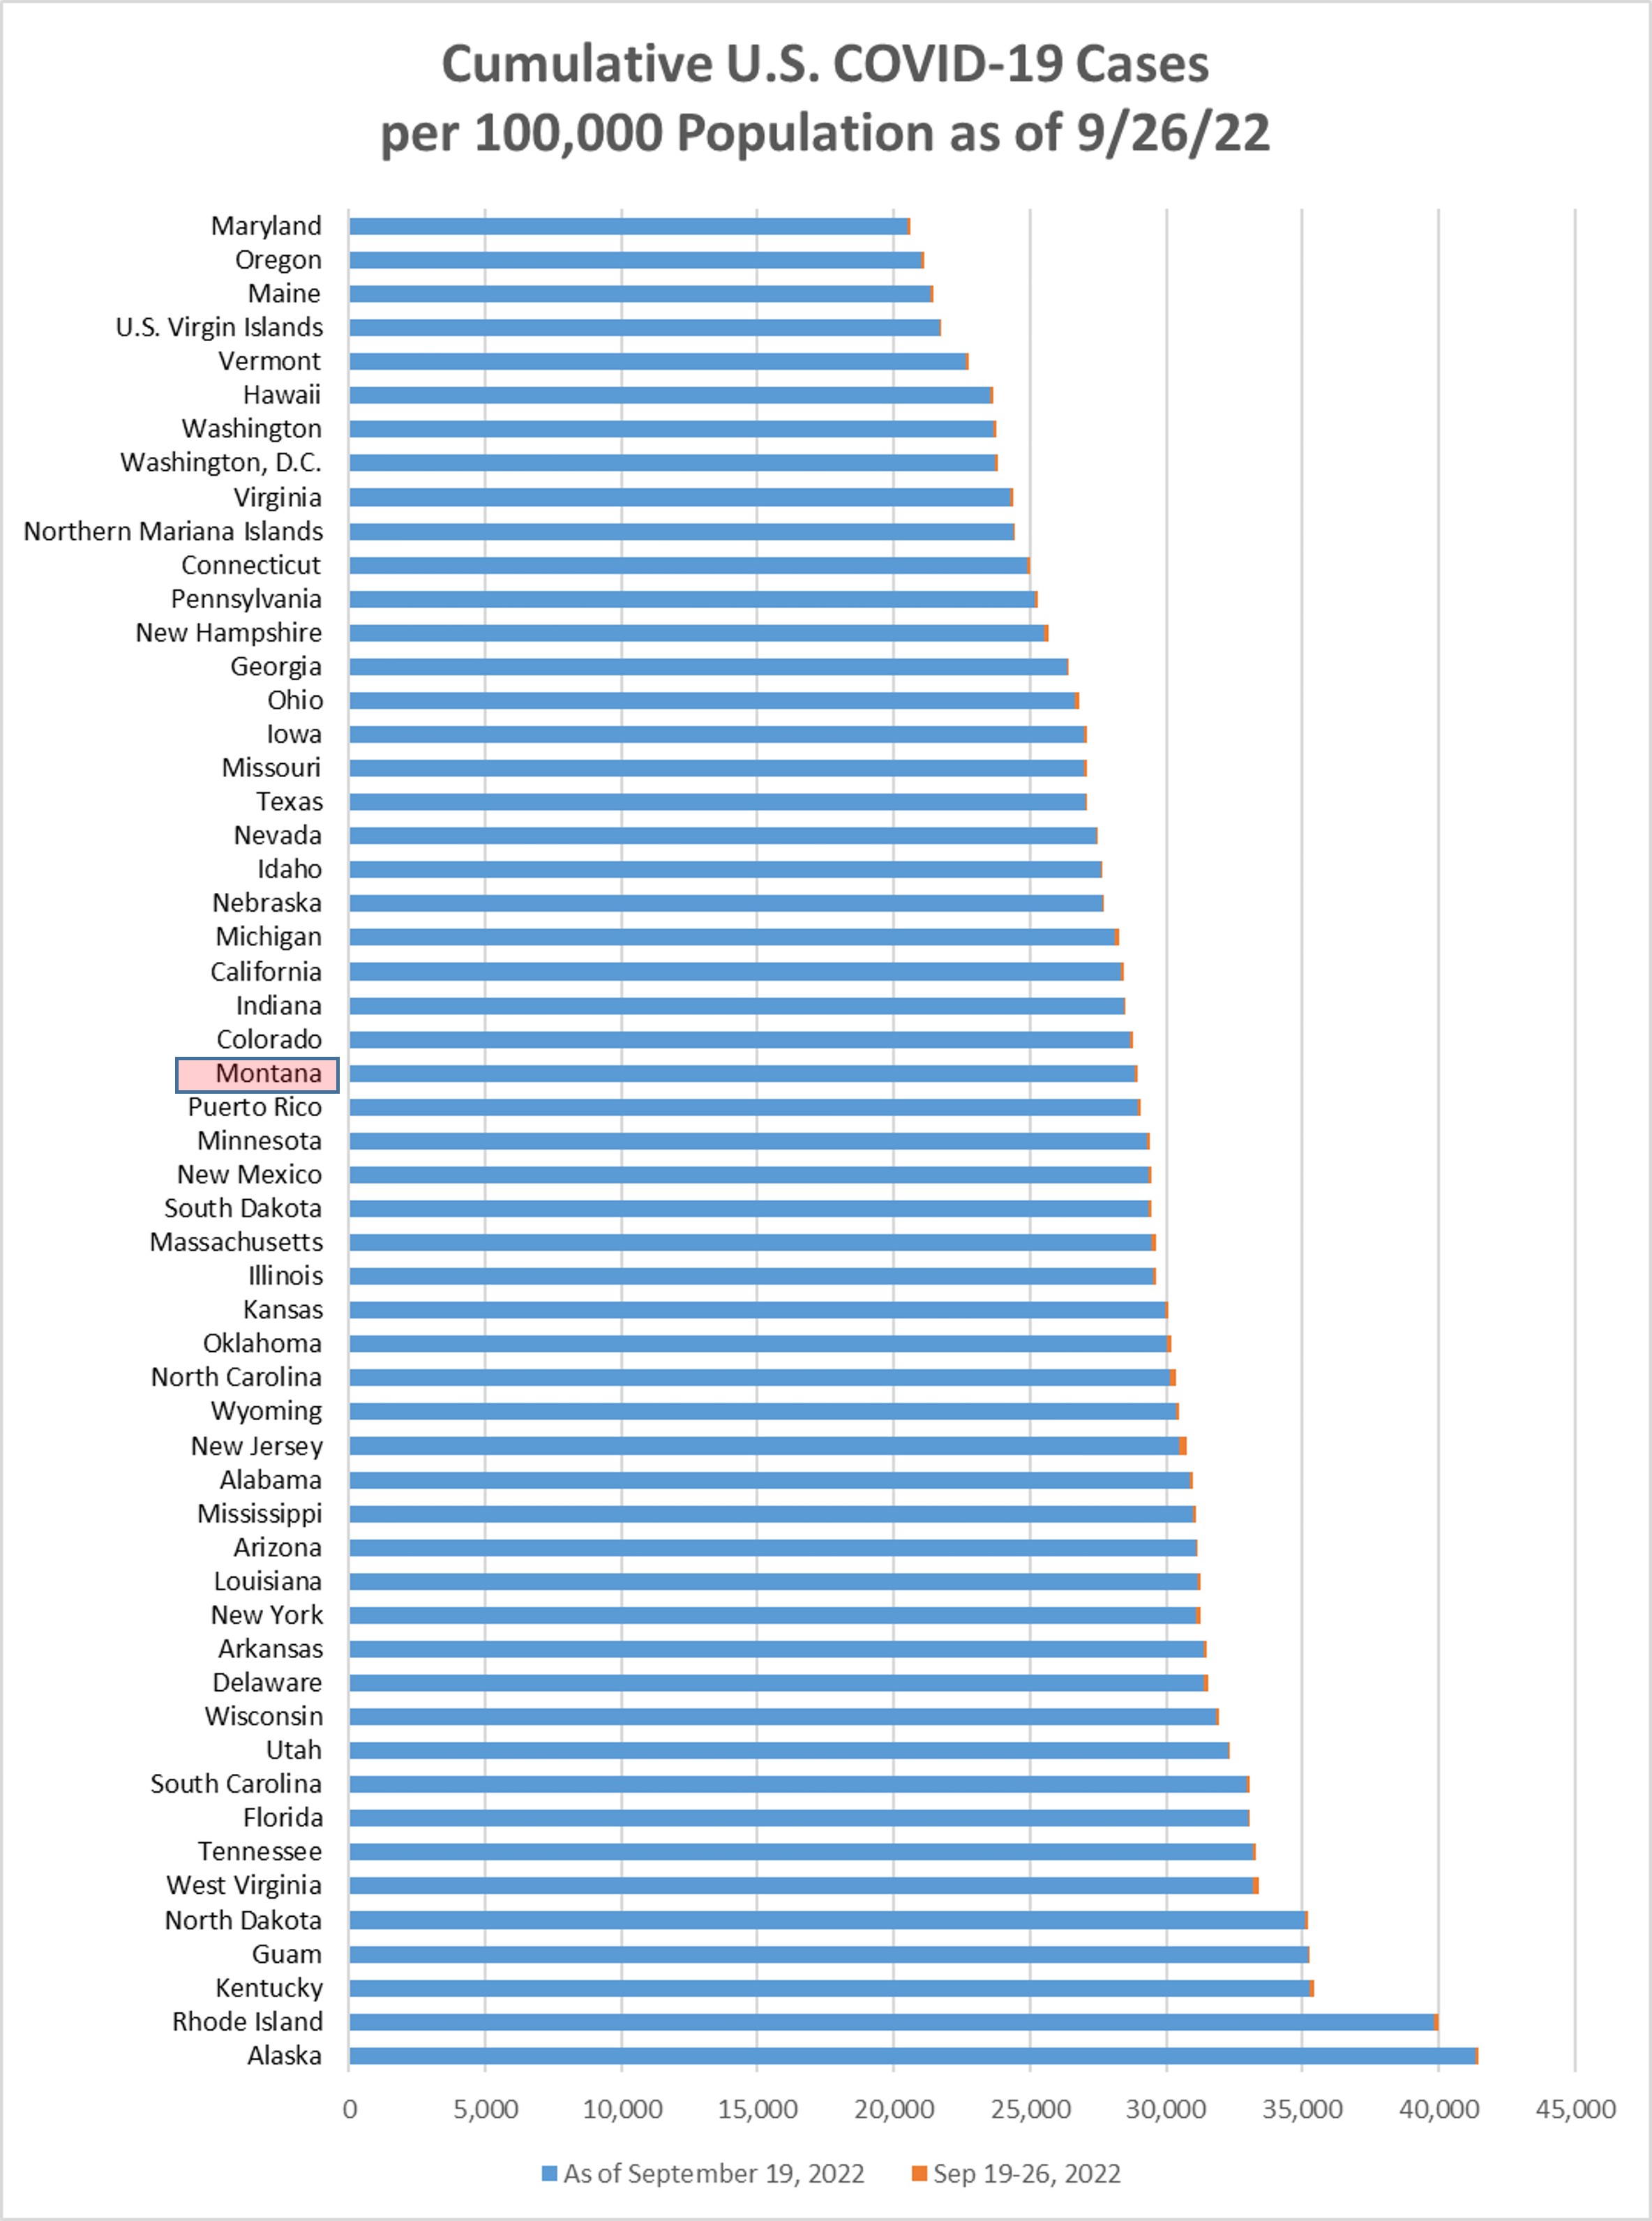
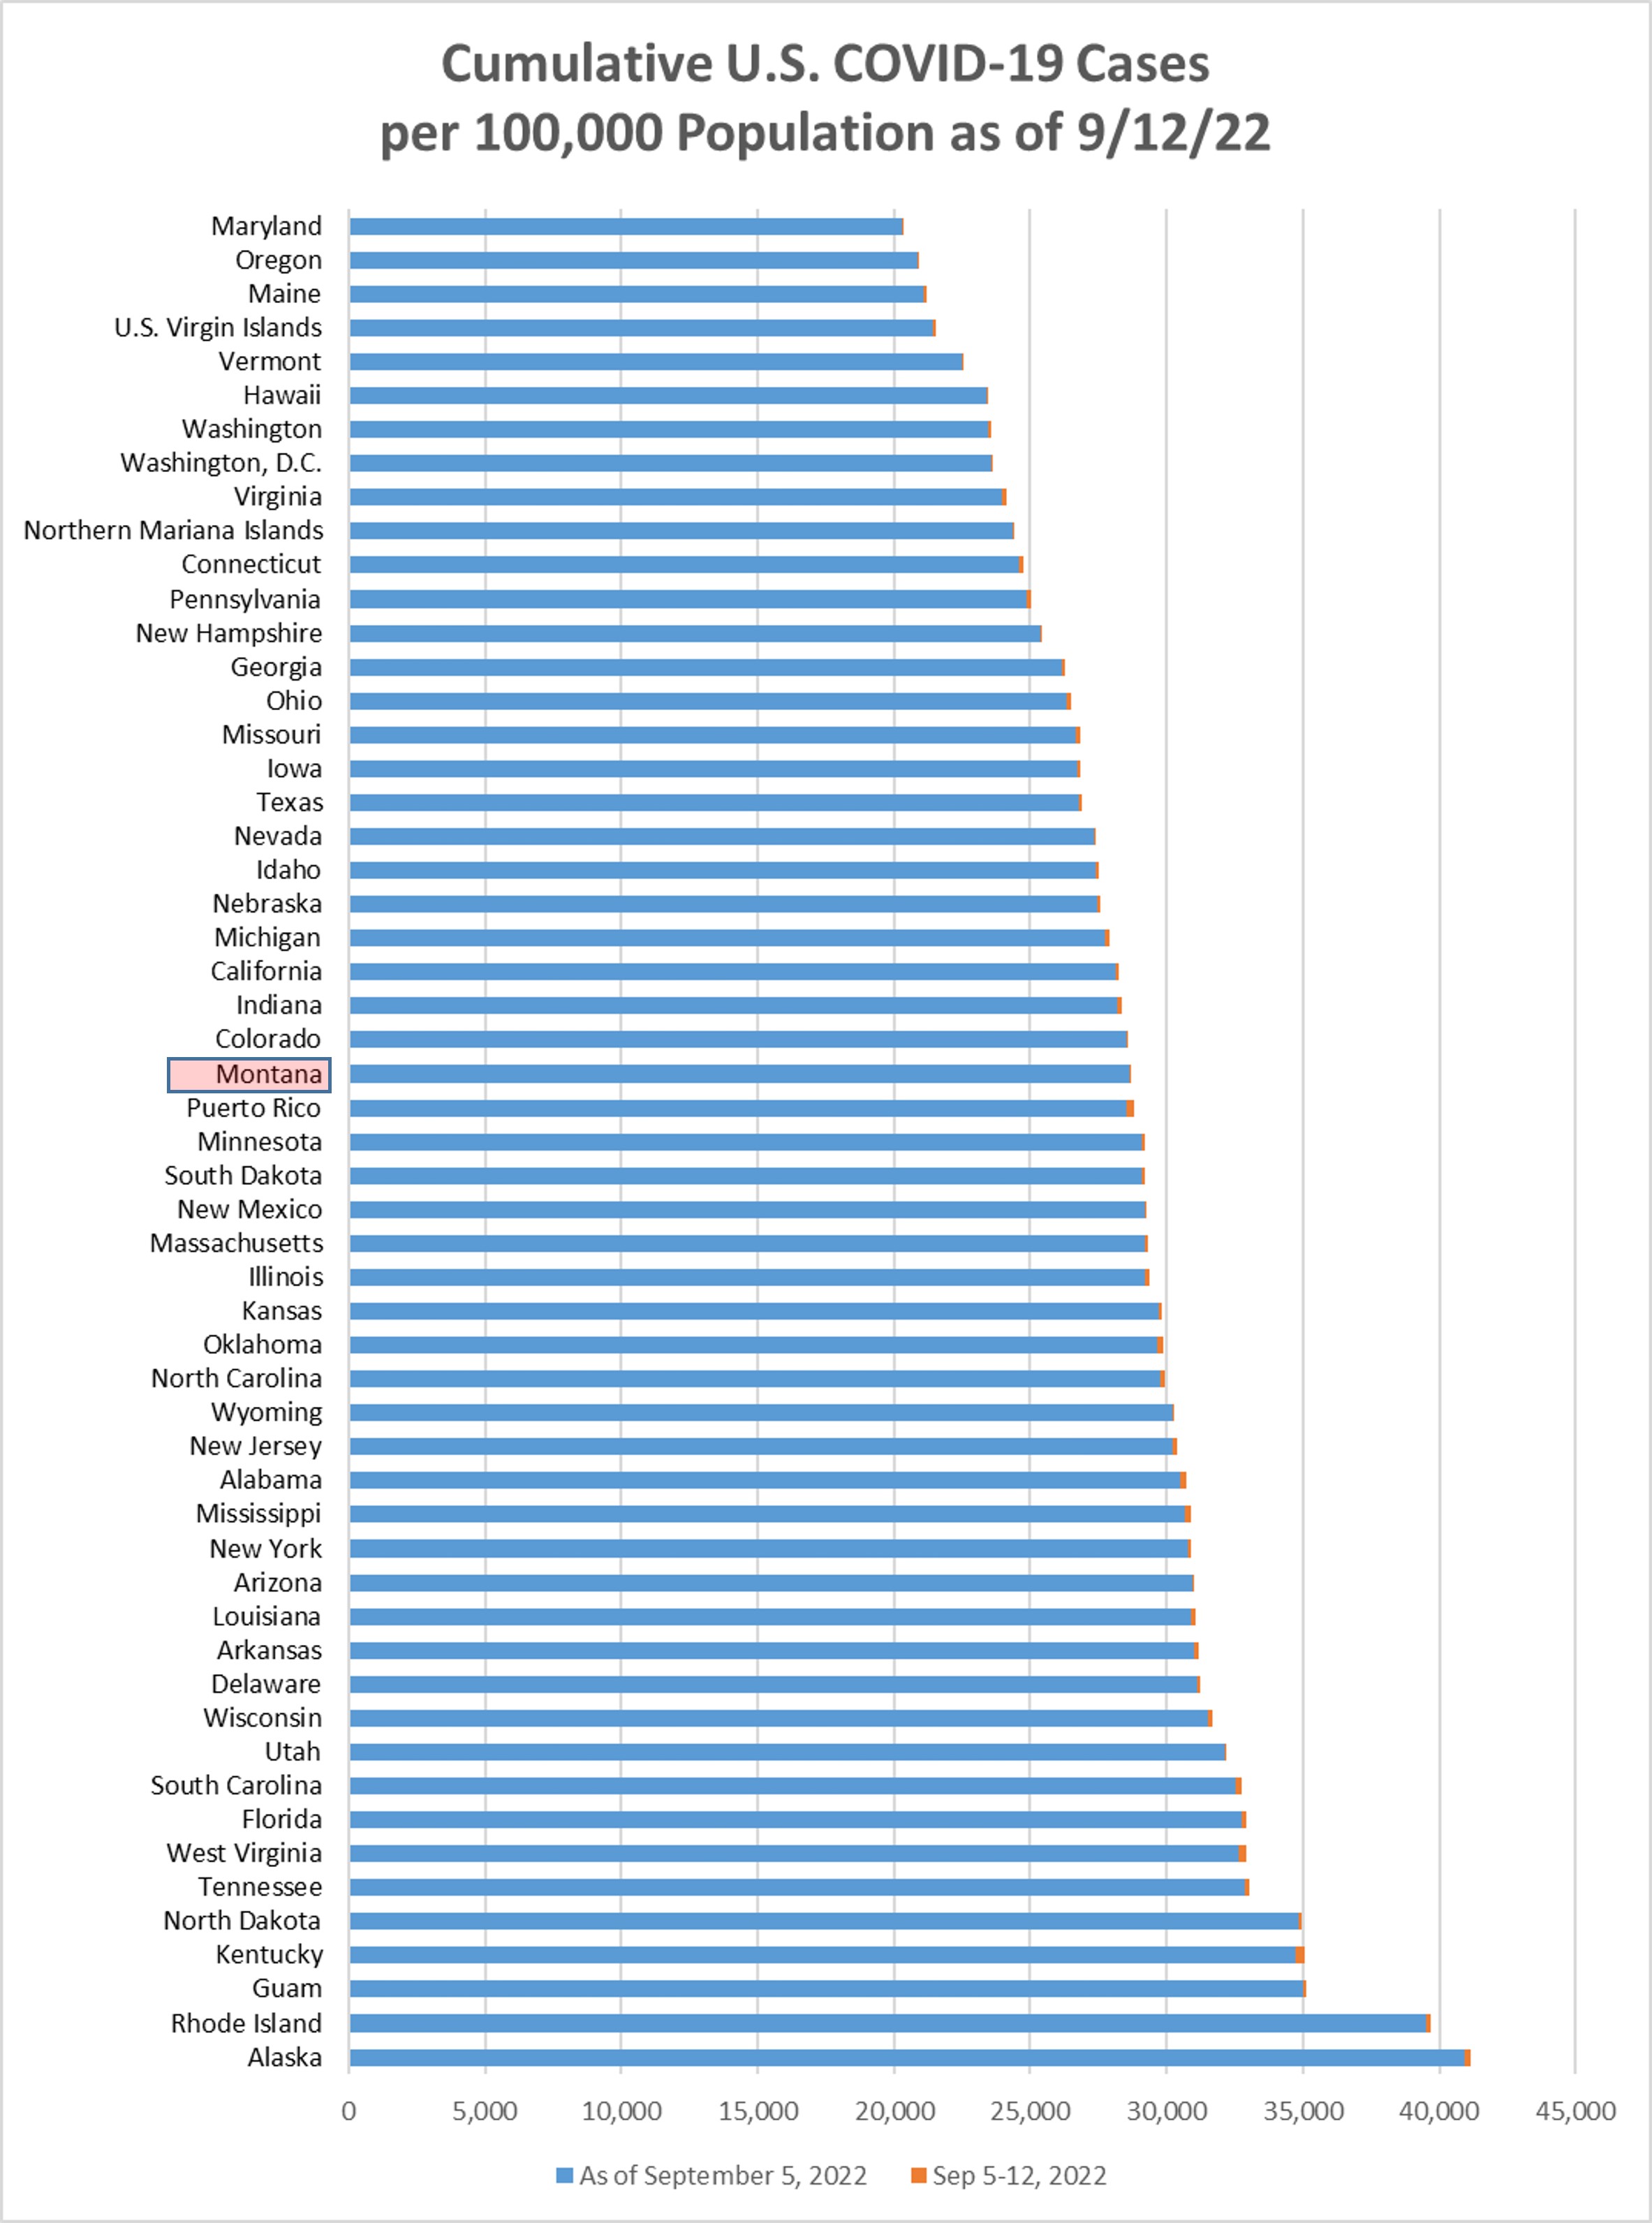
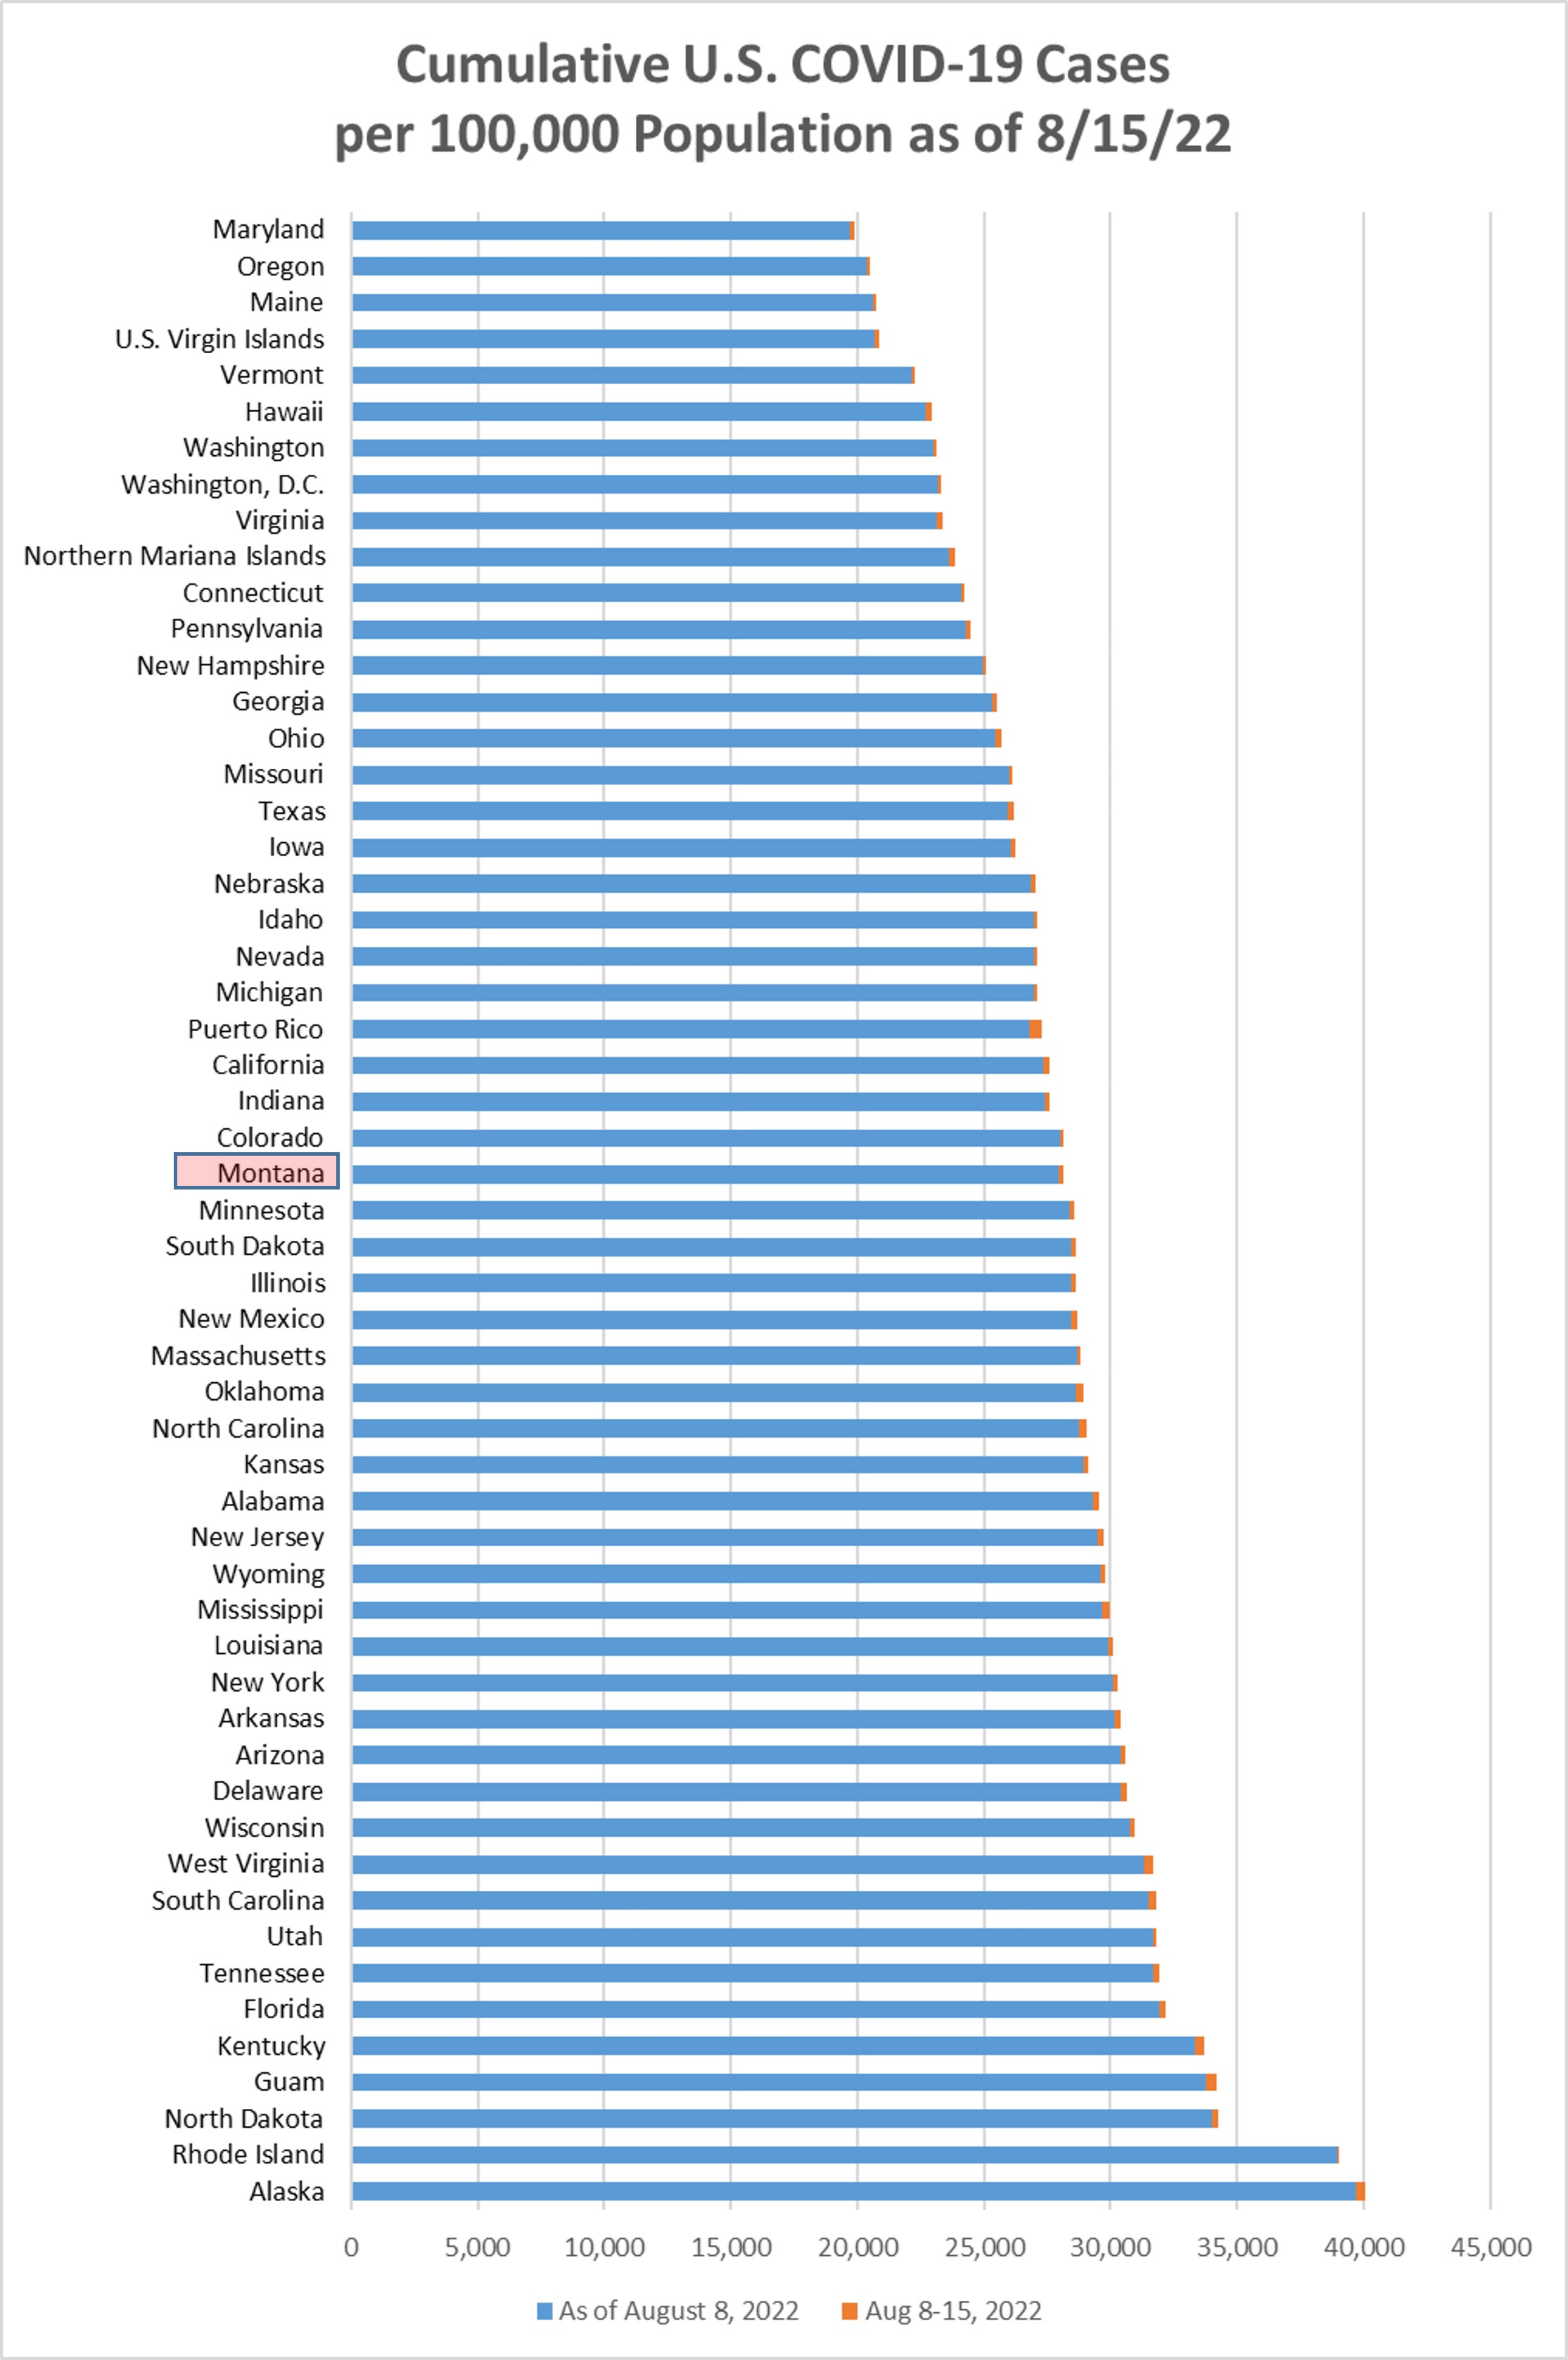
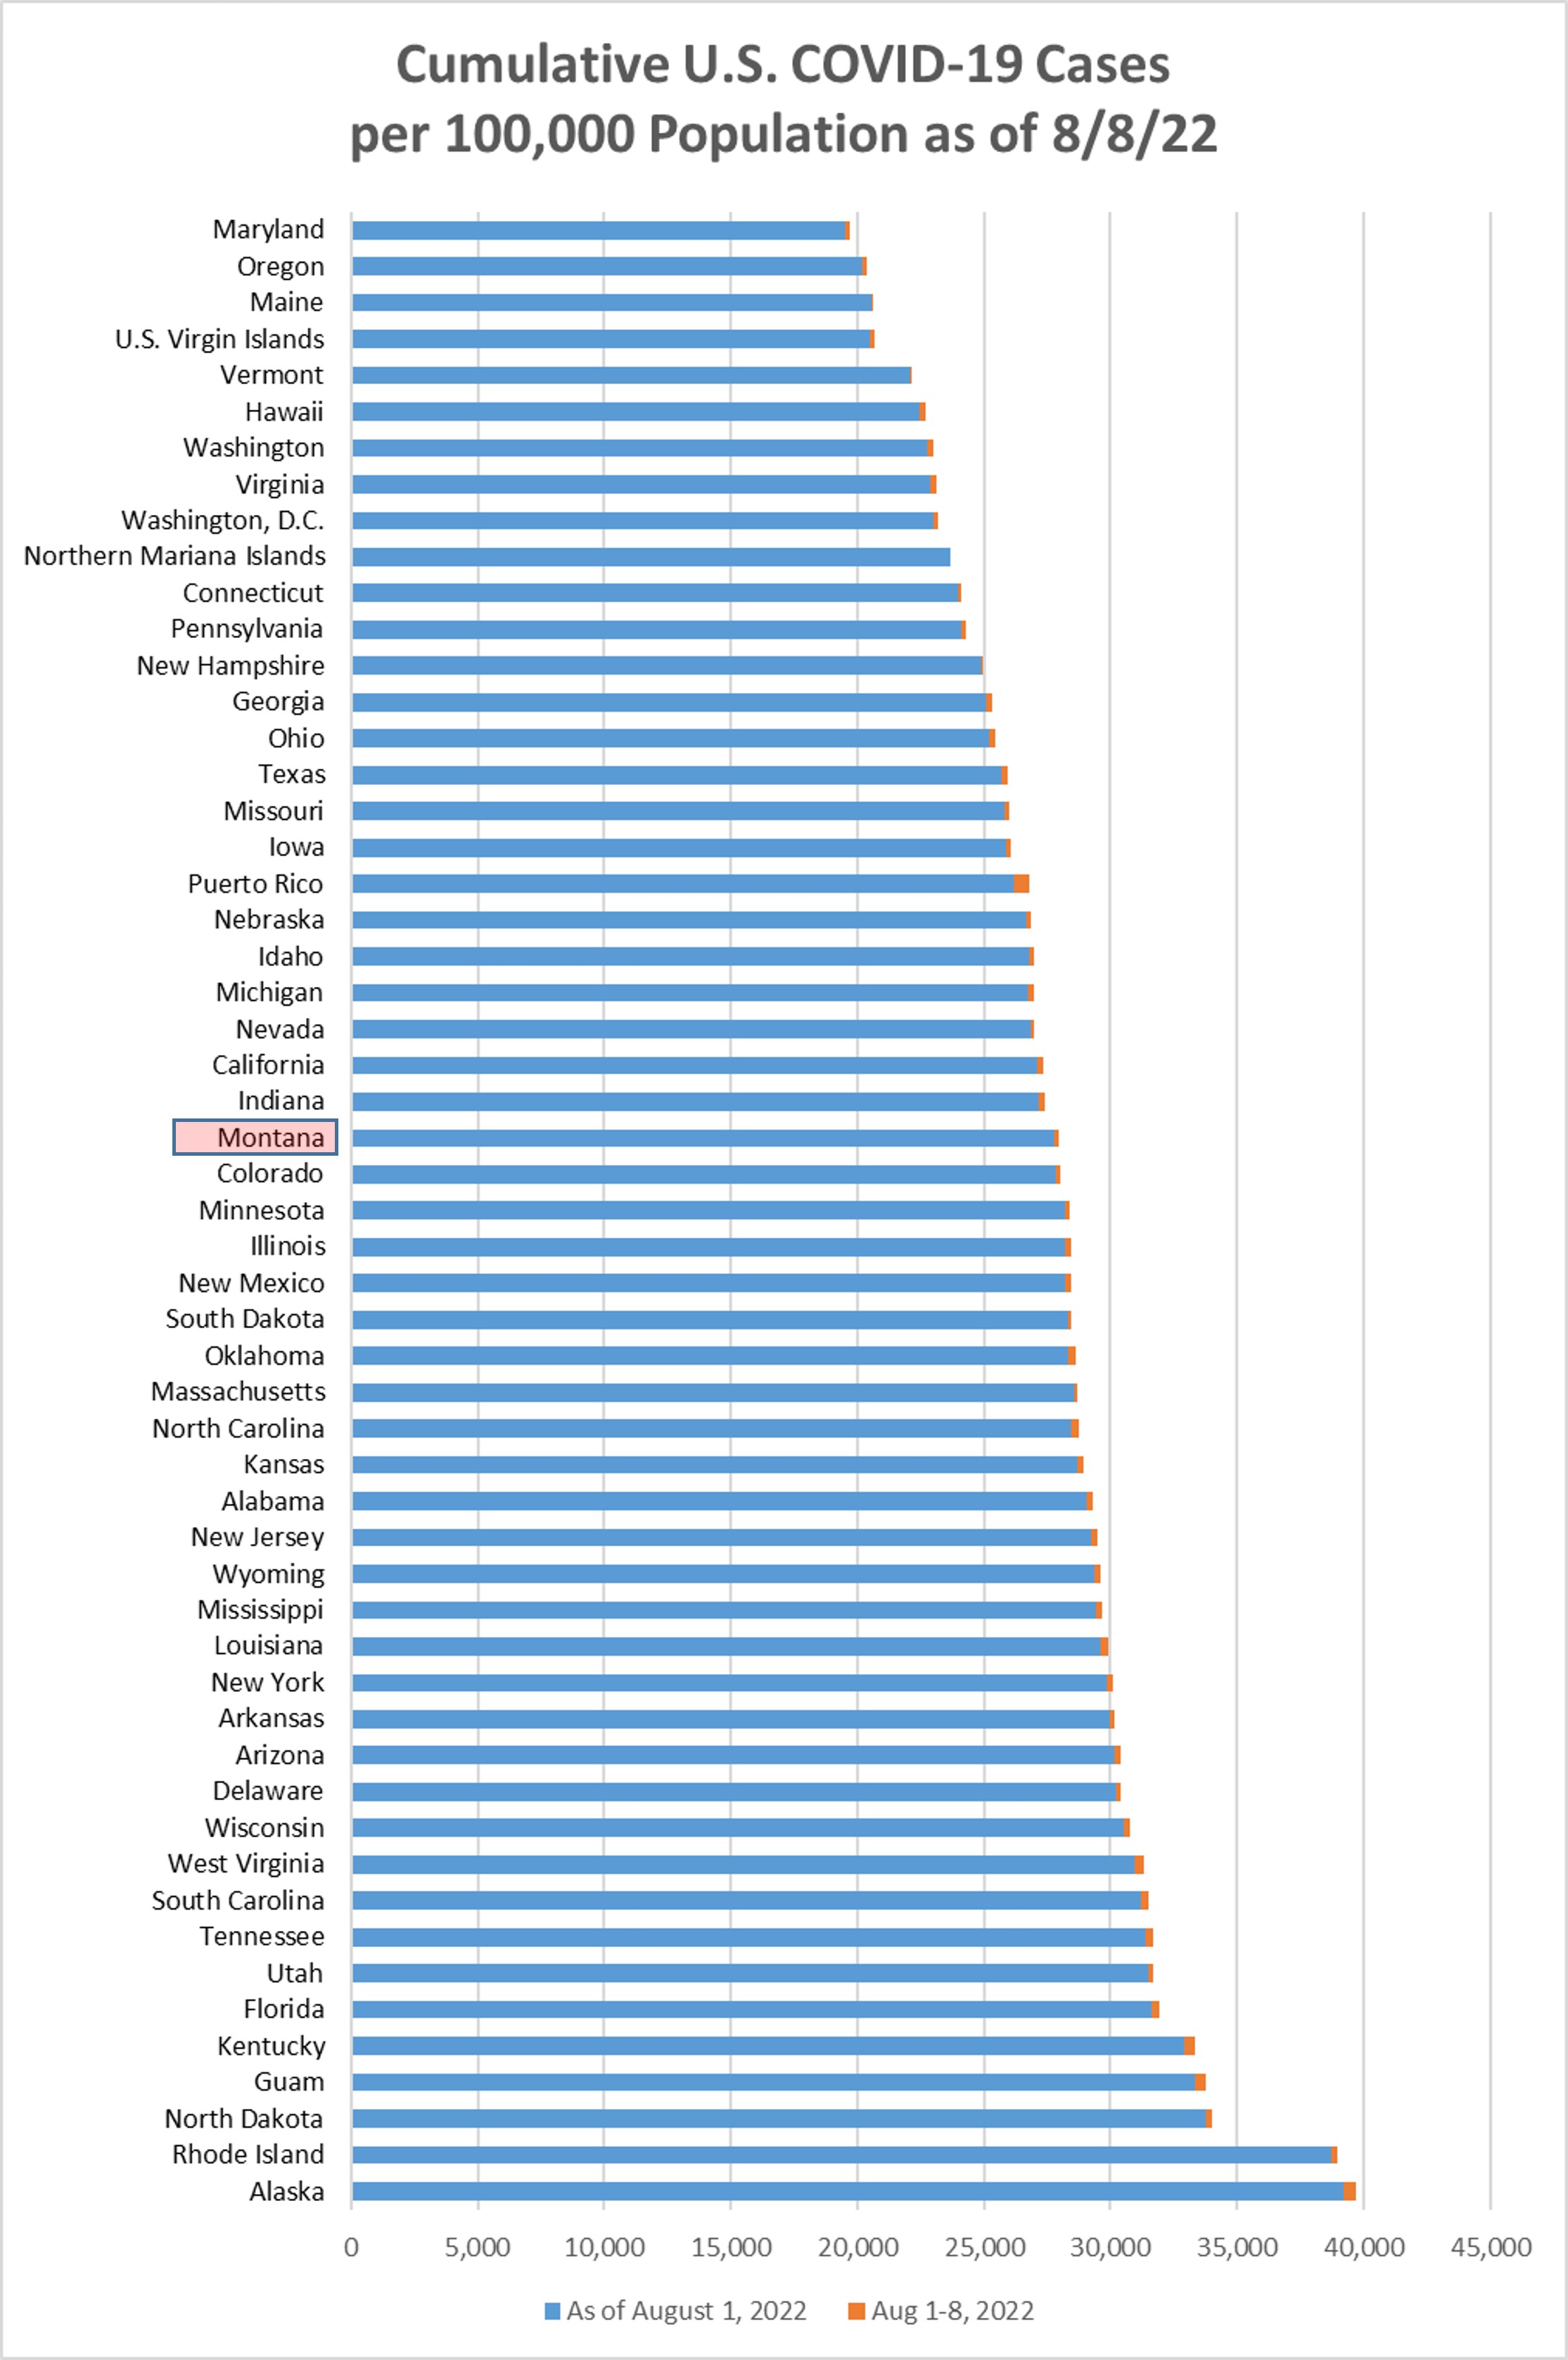
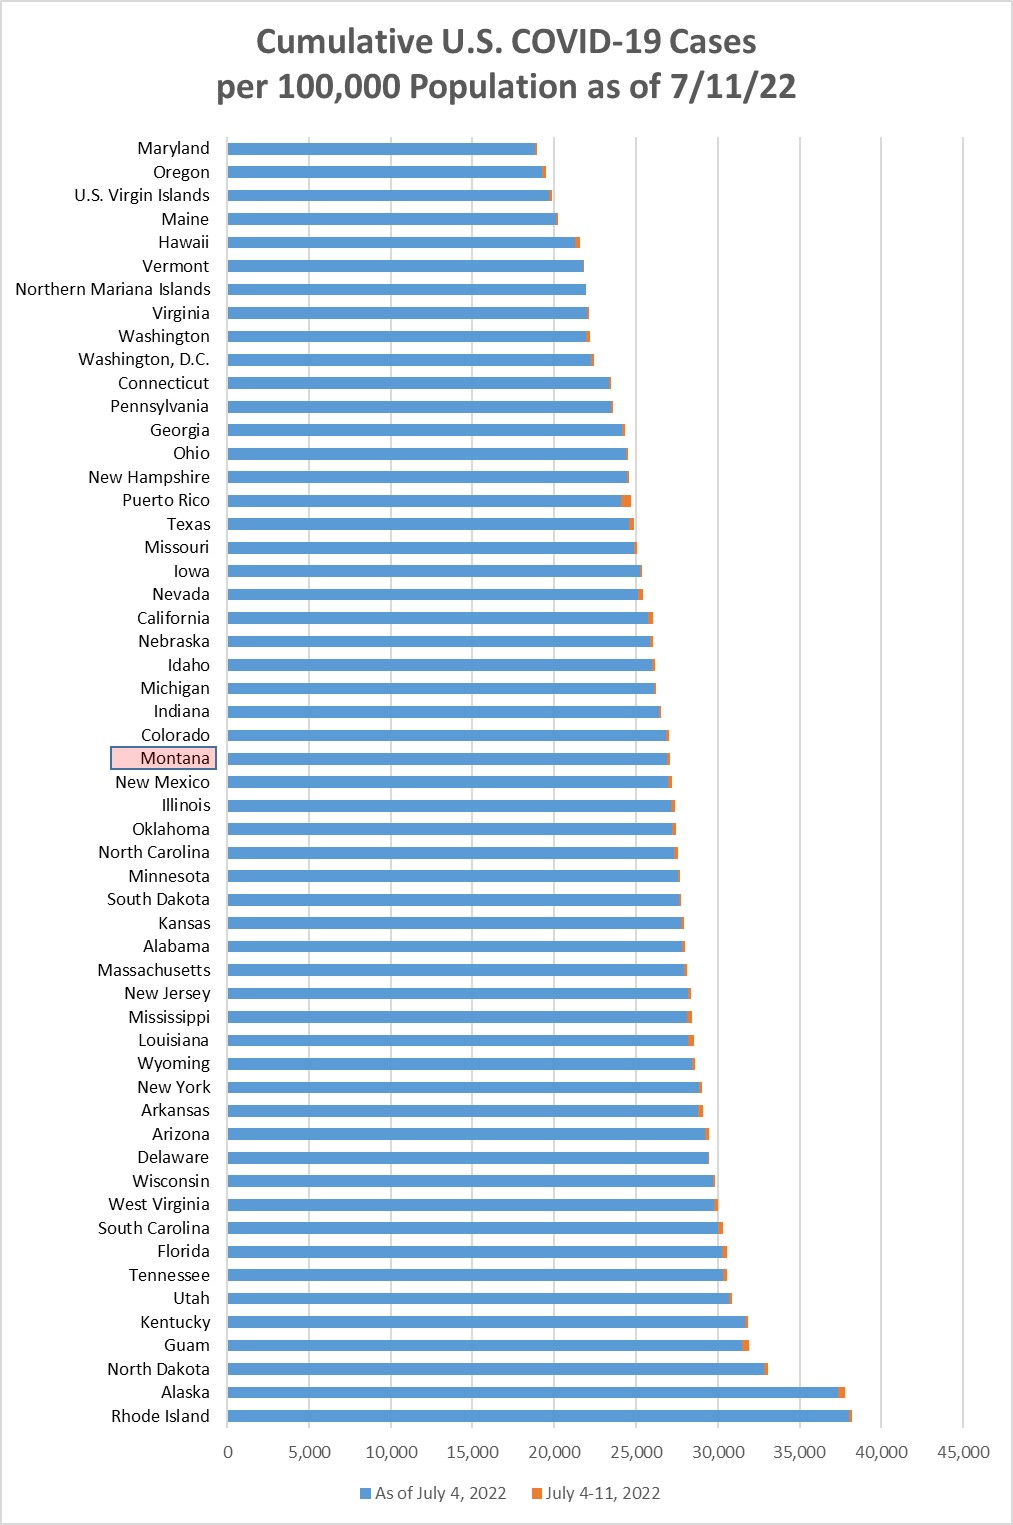
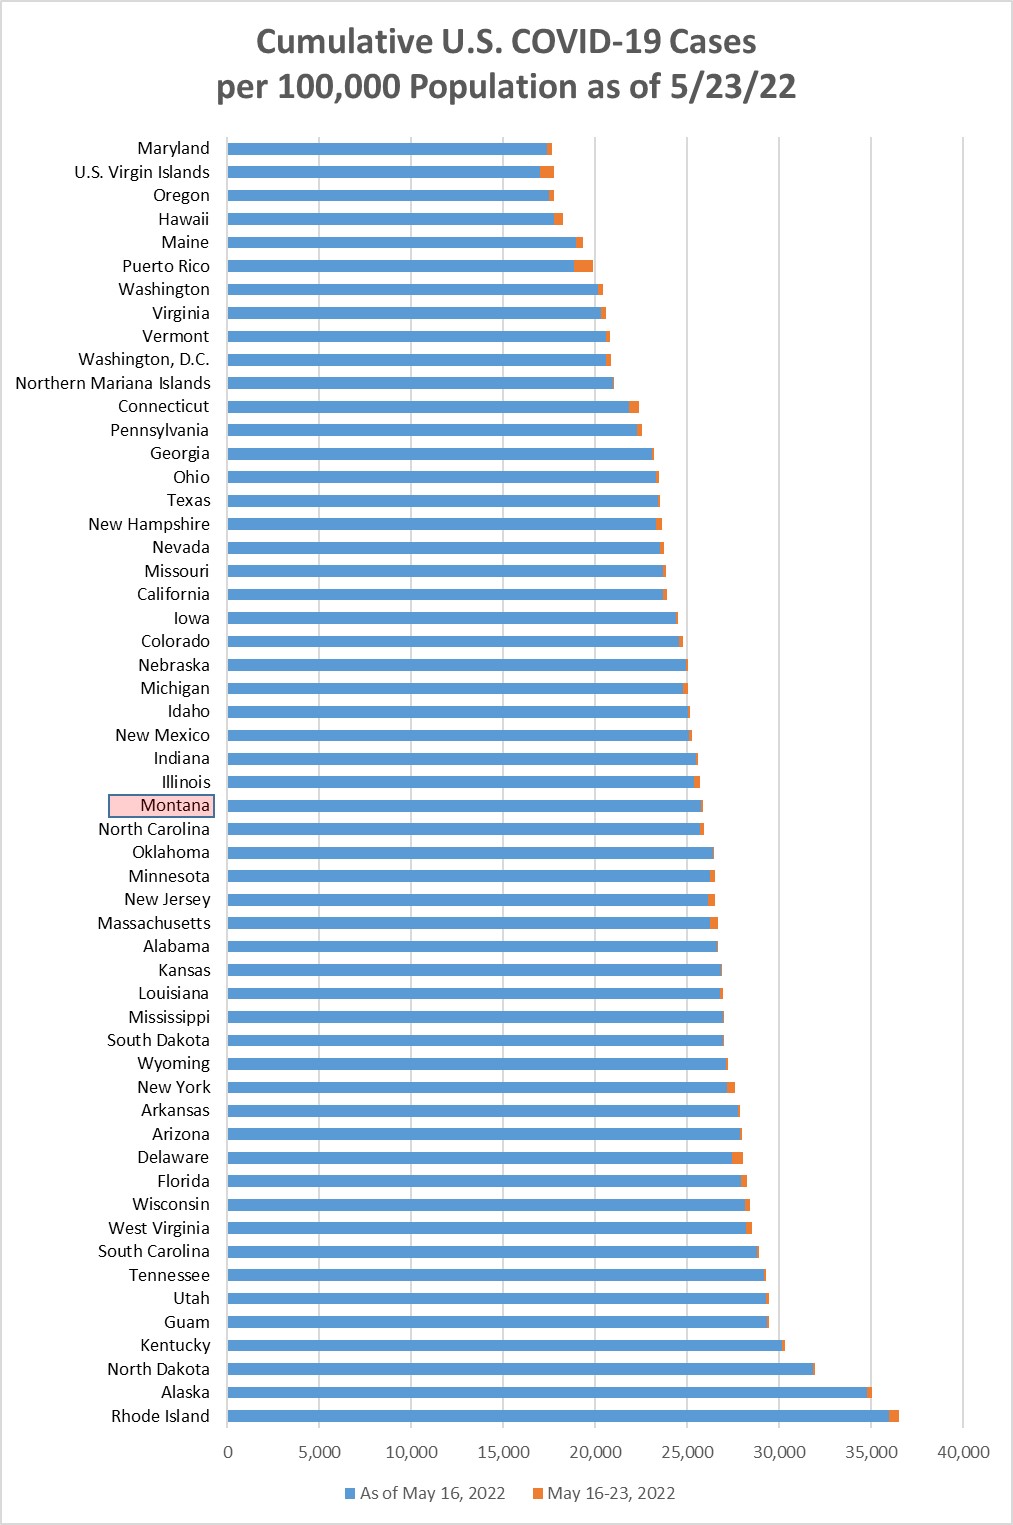
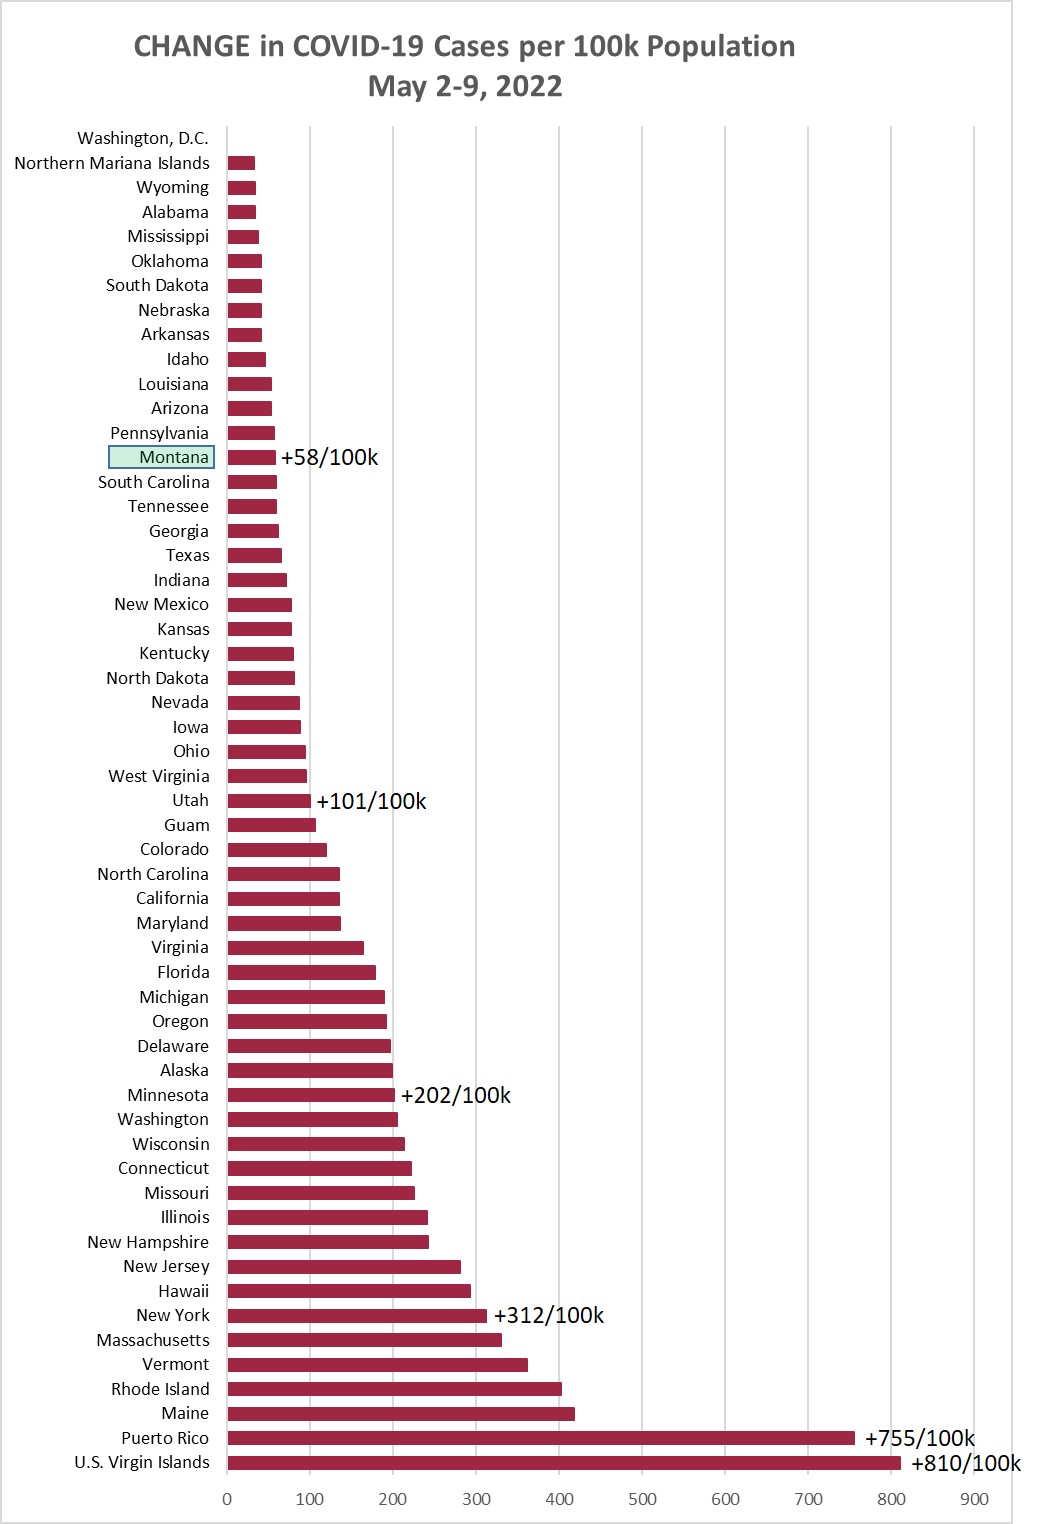
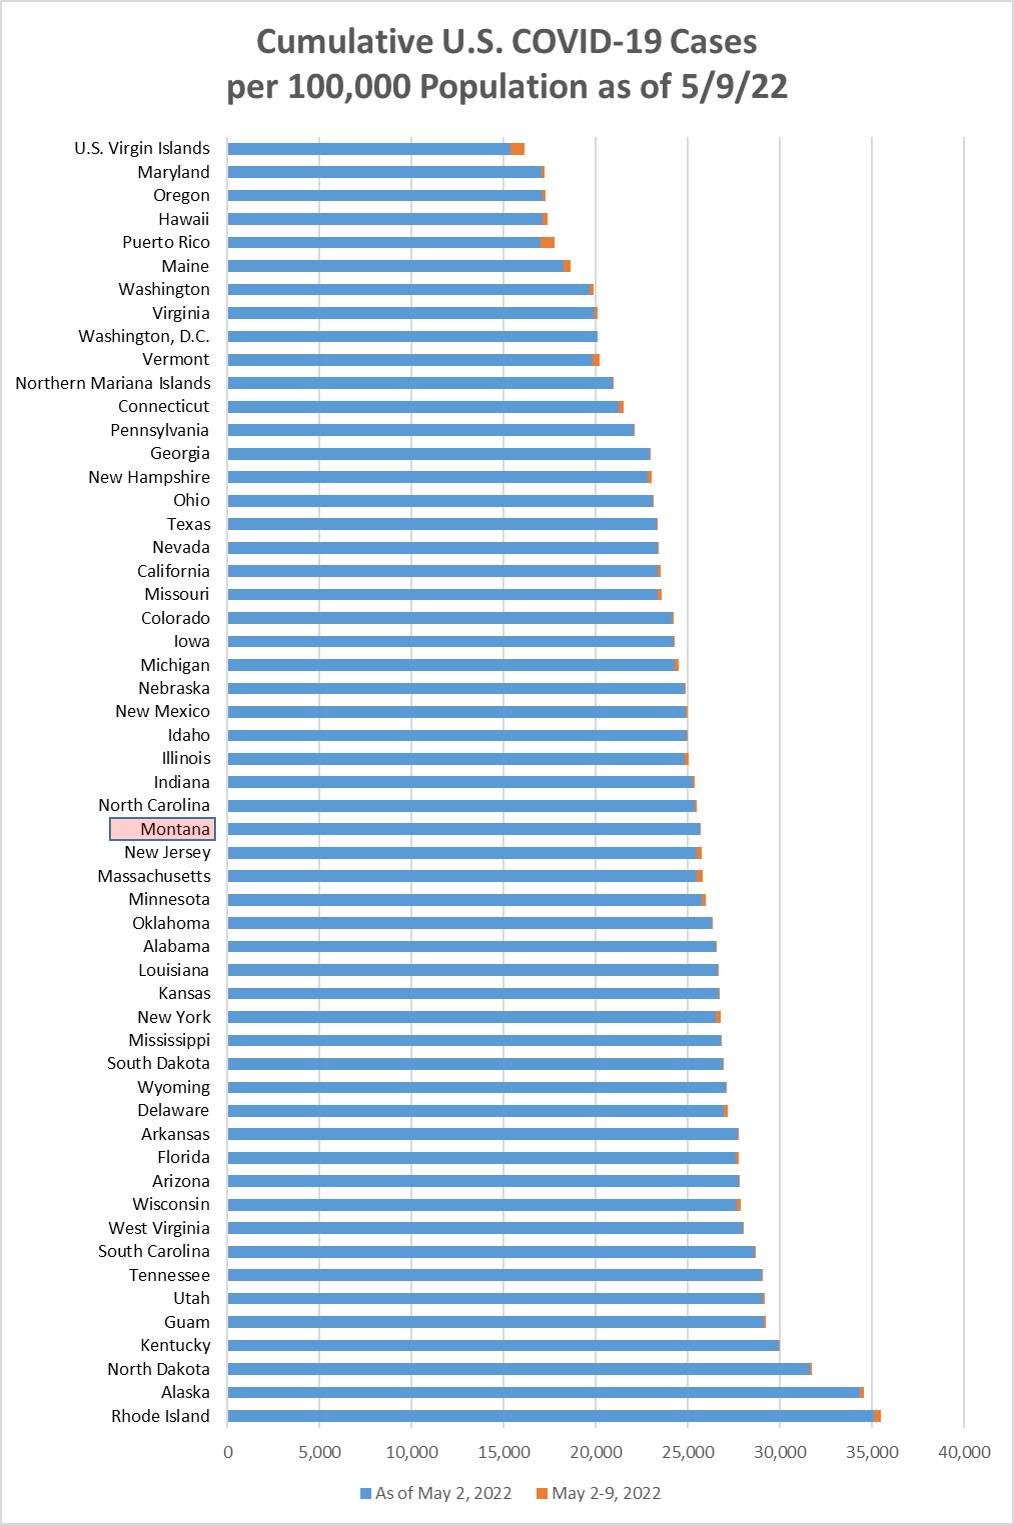
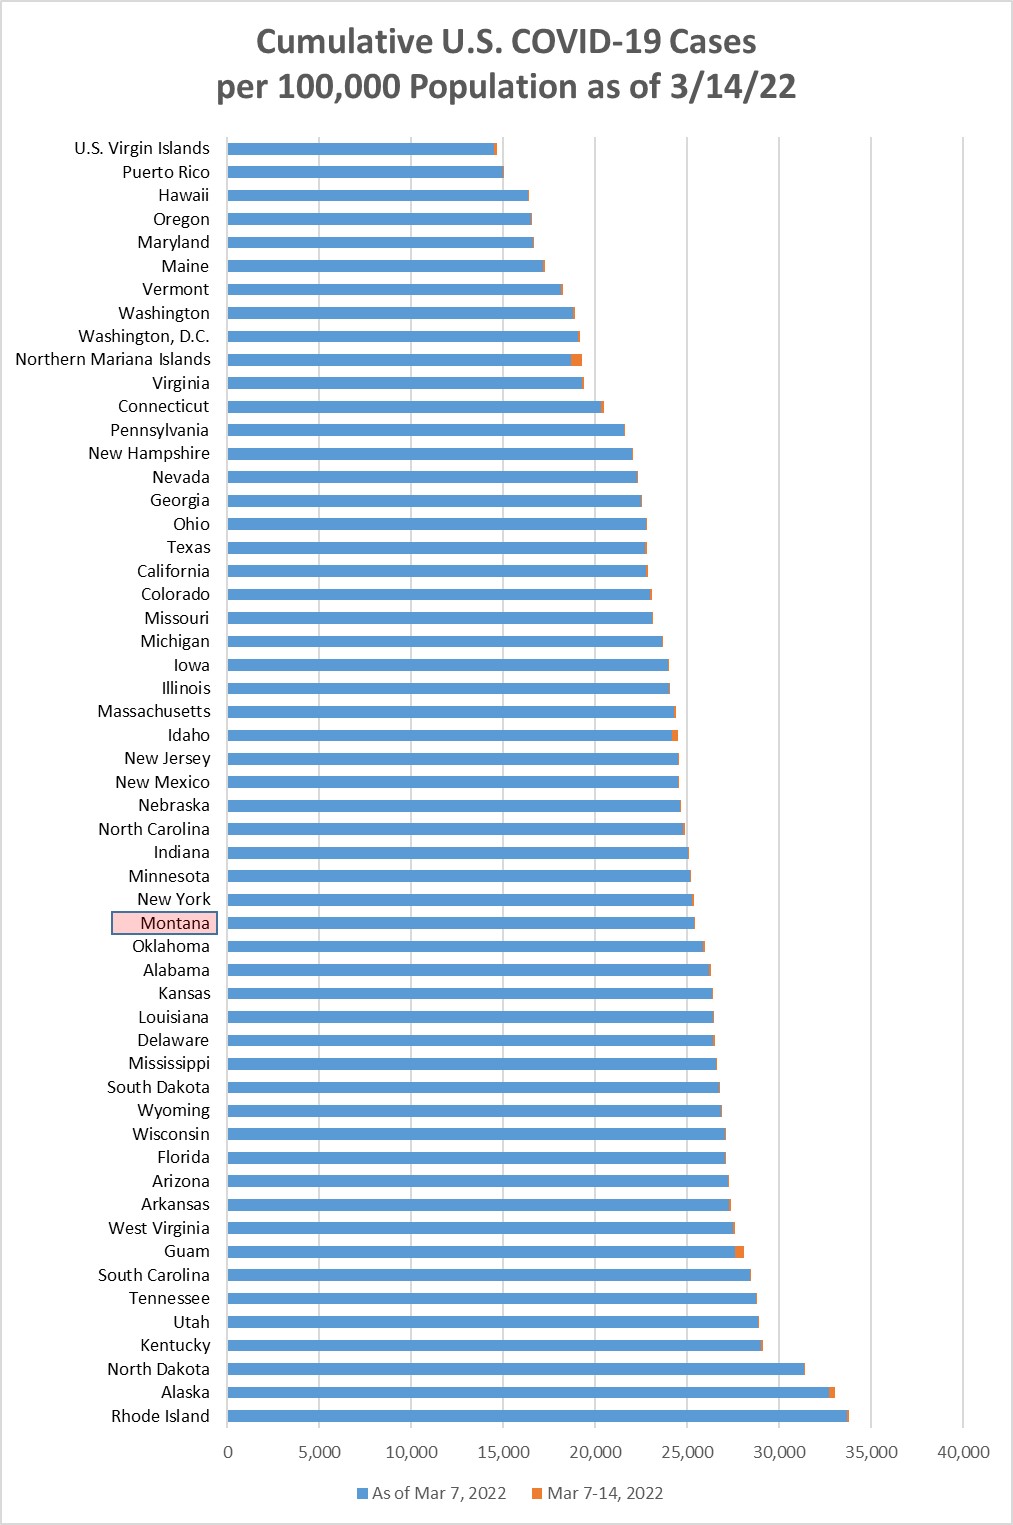
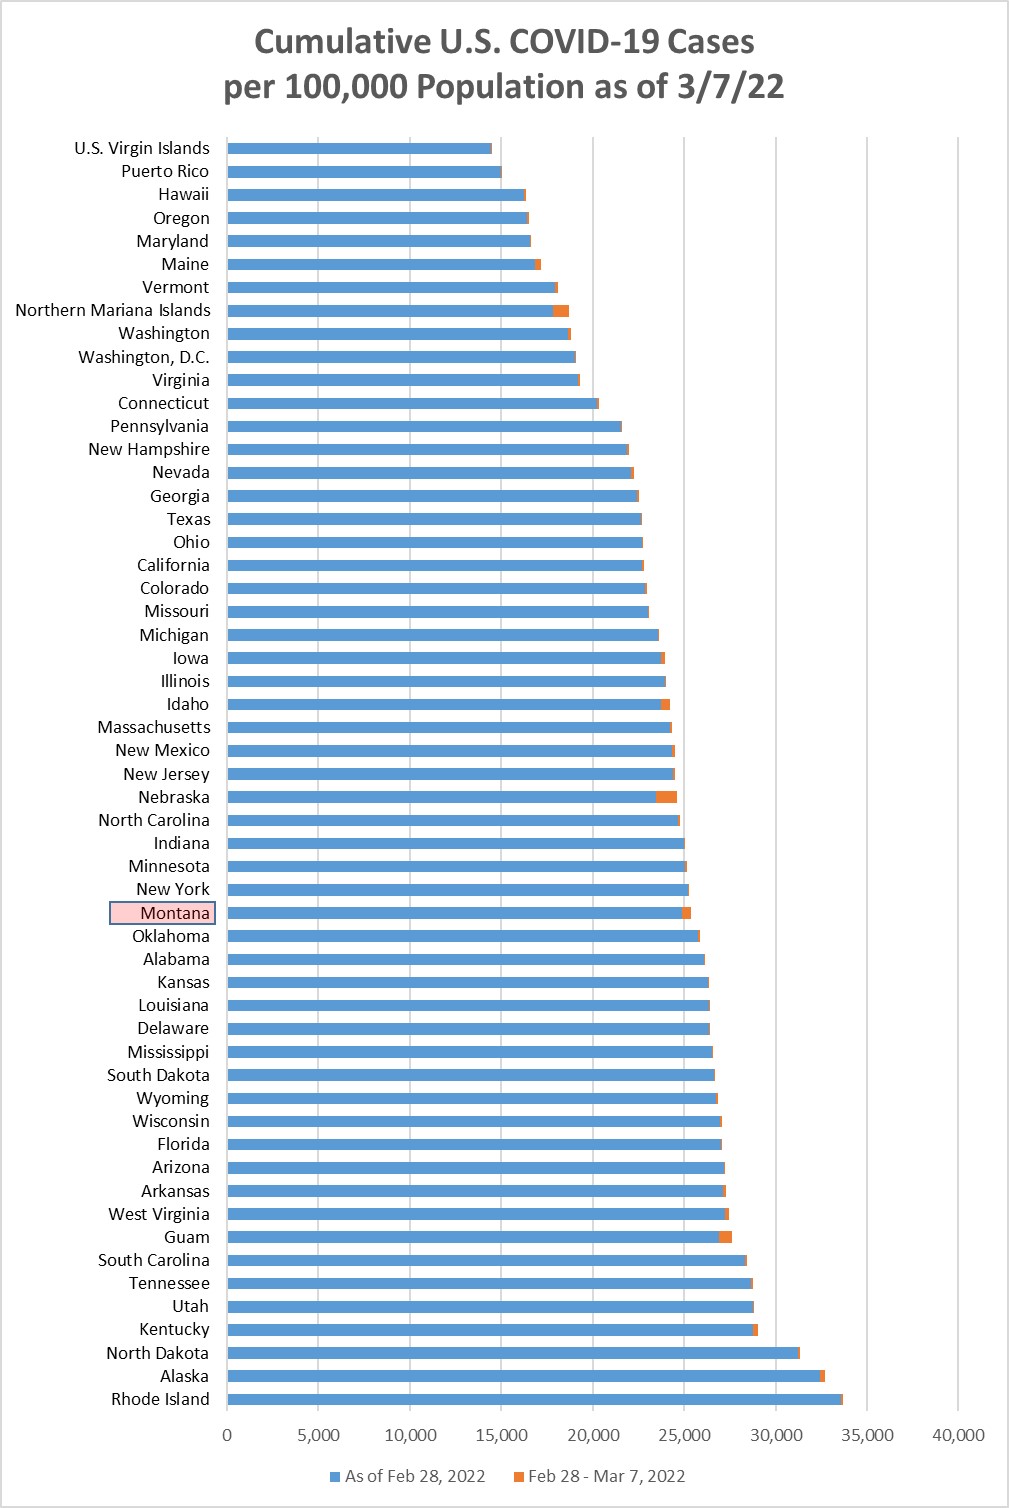
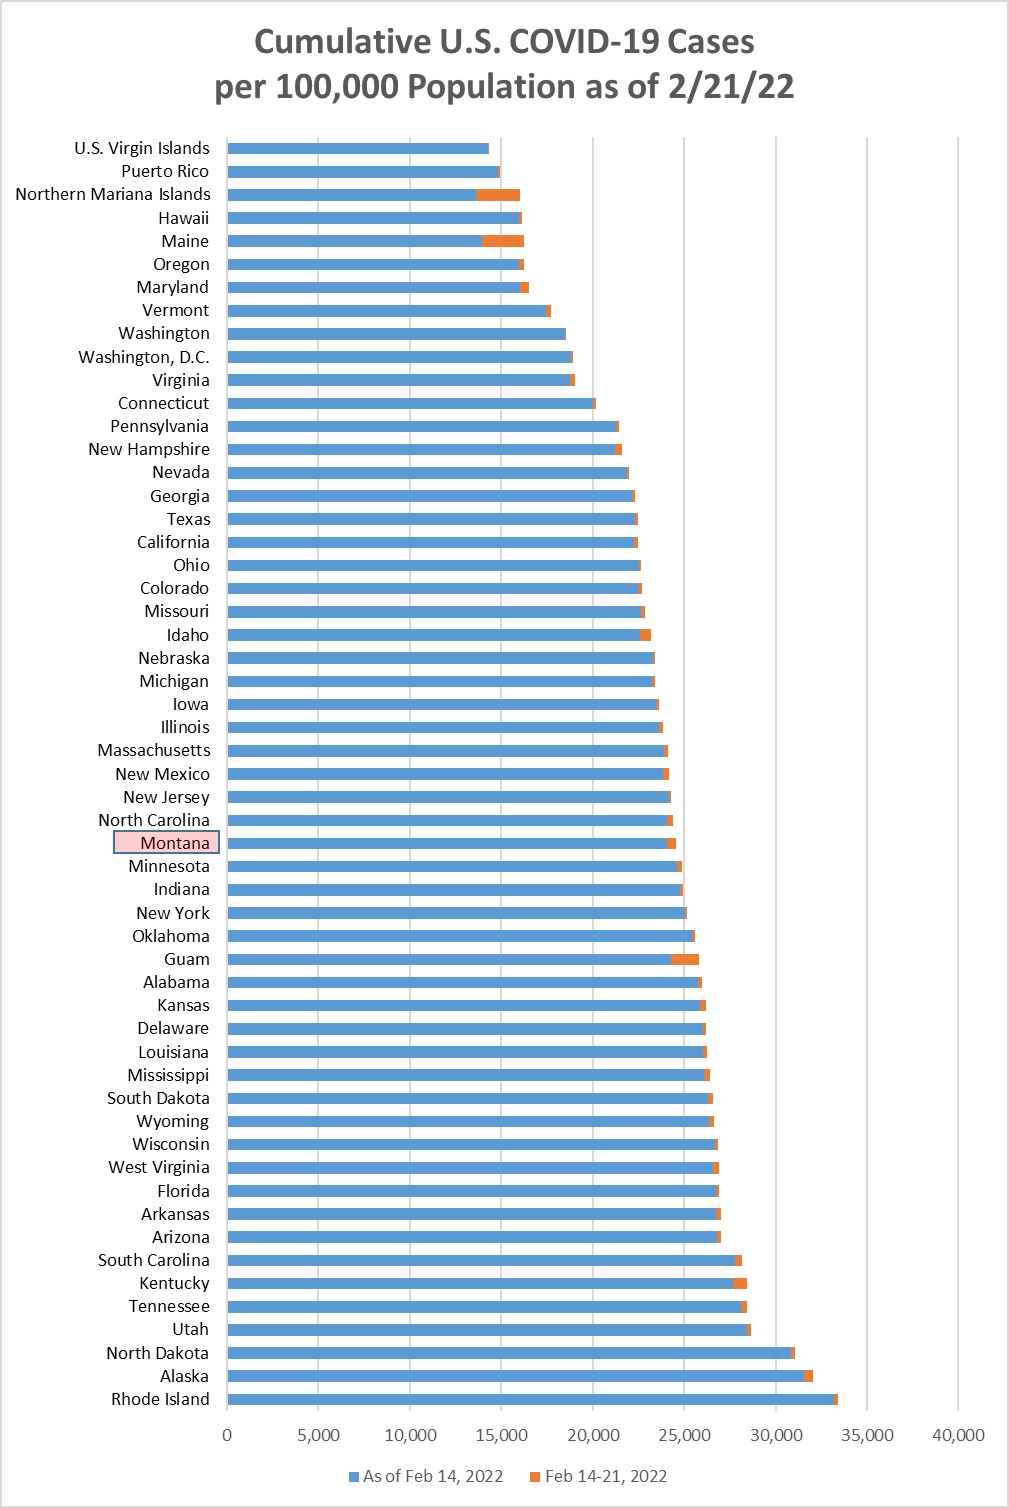
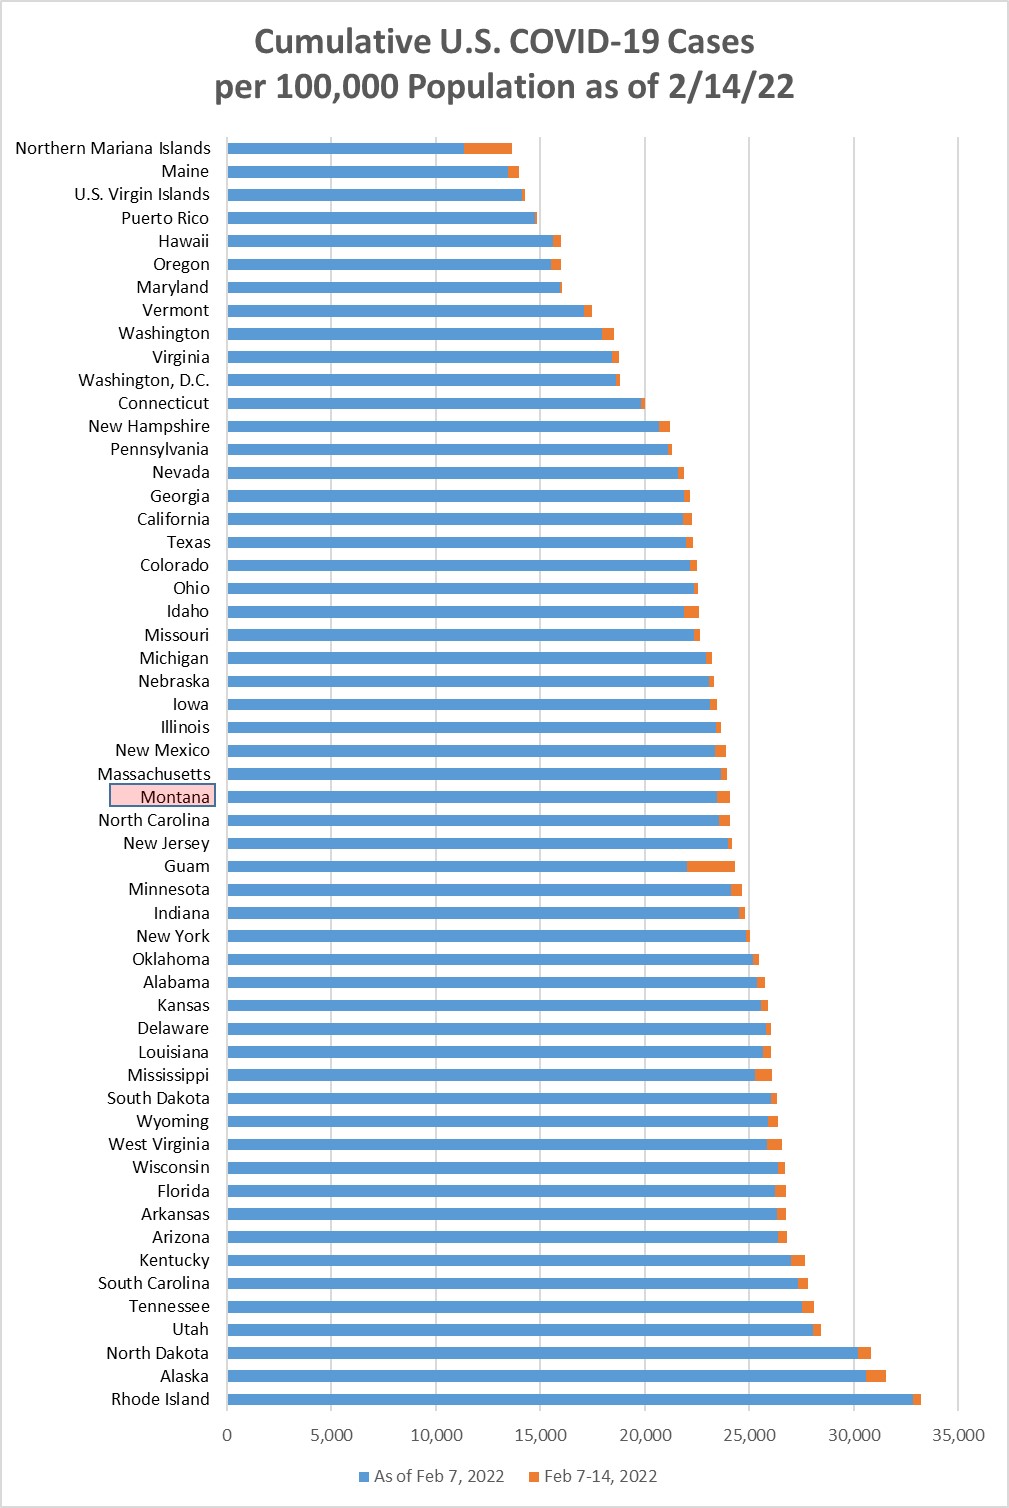
Chart 2 shows the same information as Chart 1, but with the overall cumulative cases
per 100k in each state to February 7. Montana moved up from position 31 to 27 this
week.
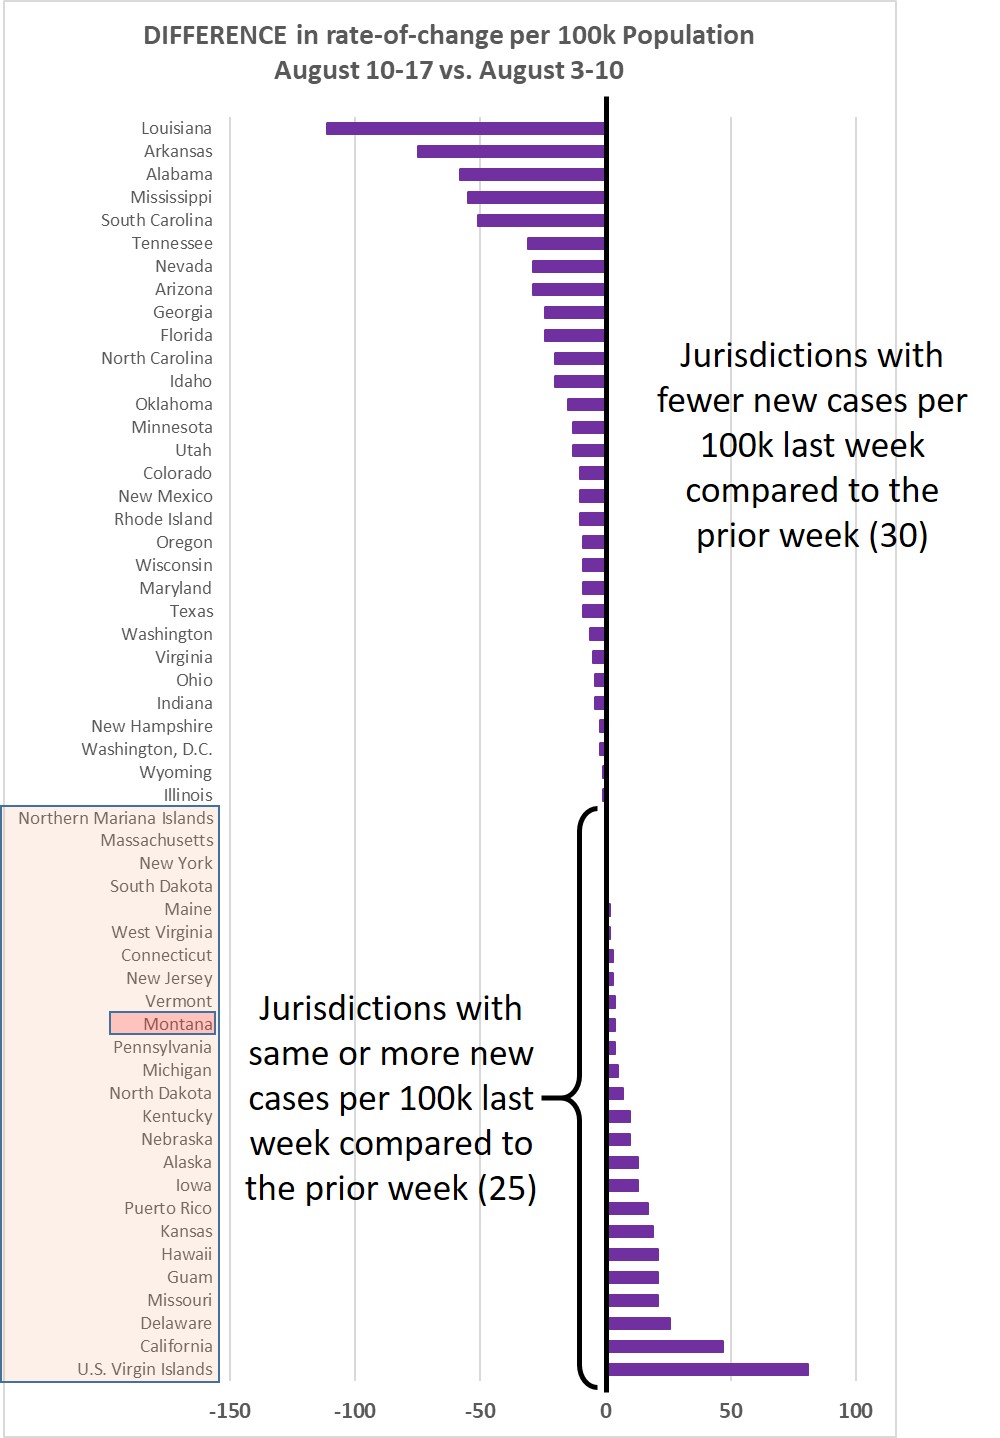
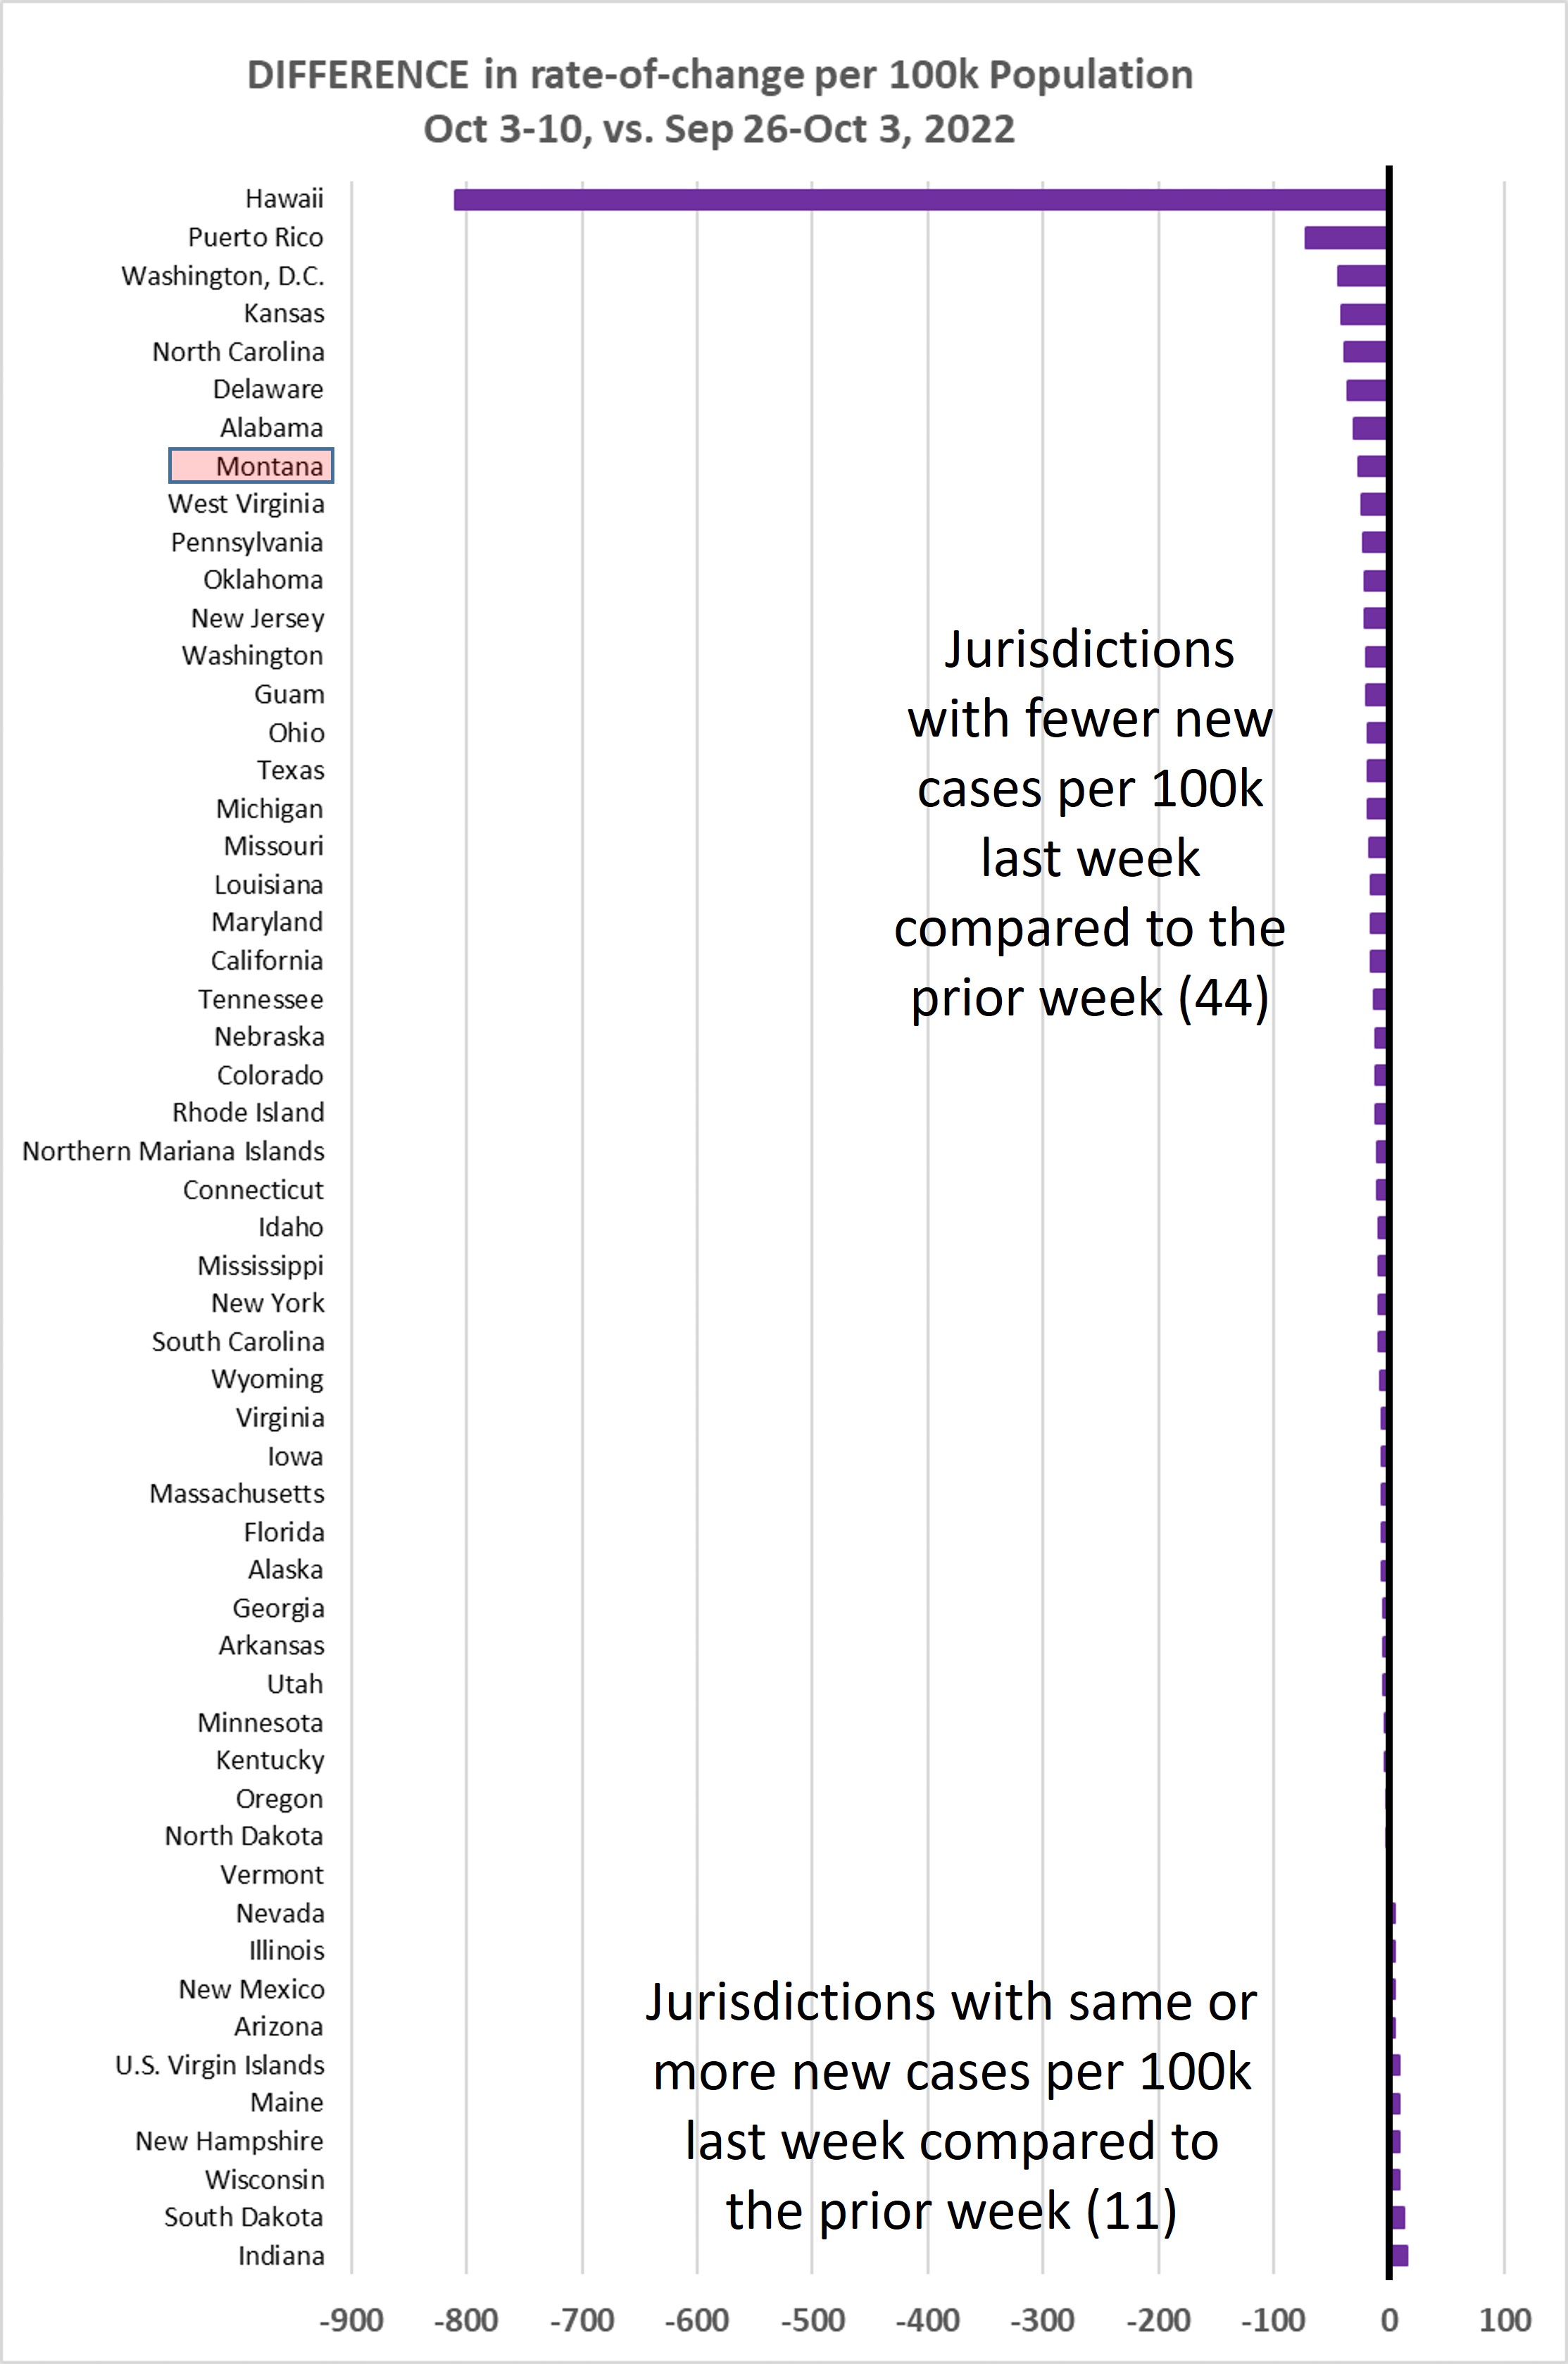
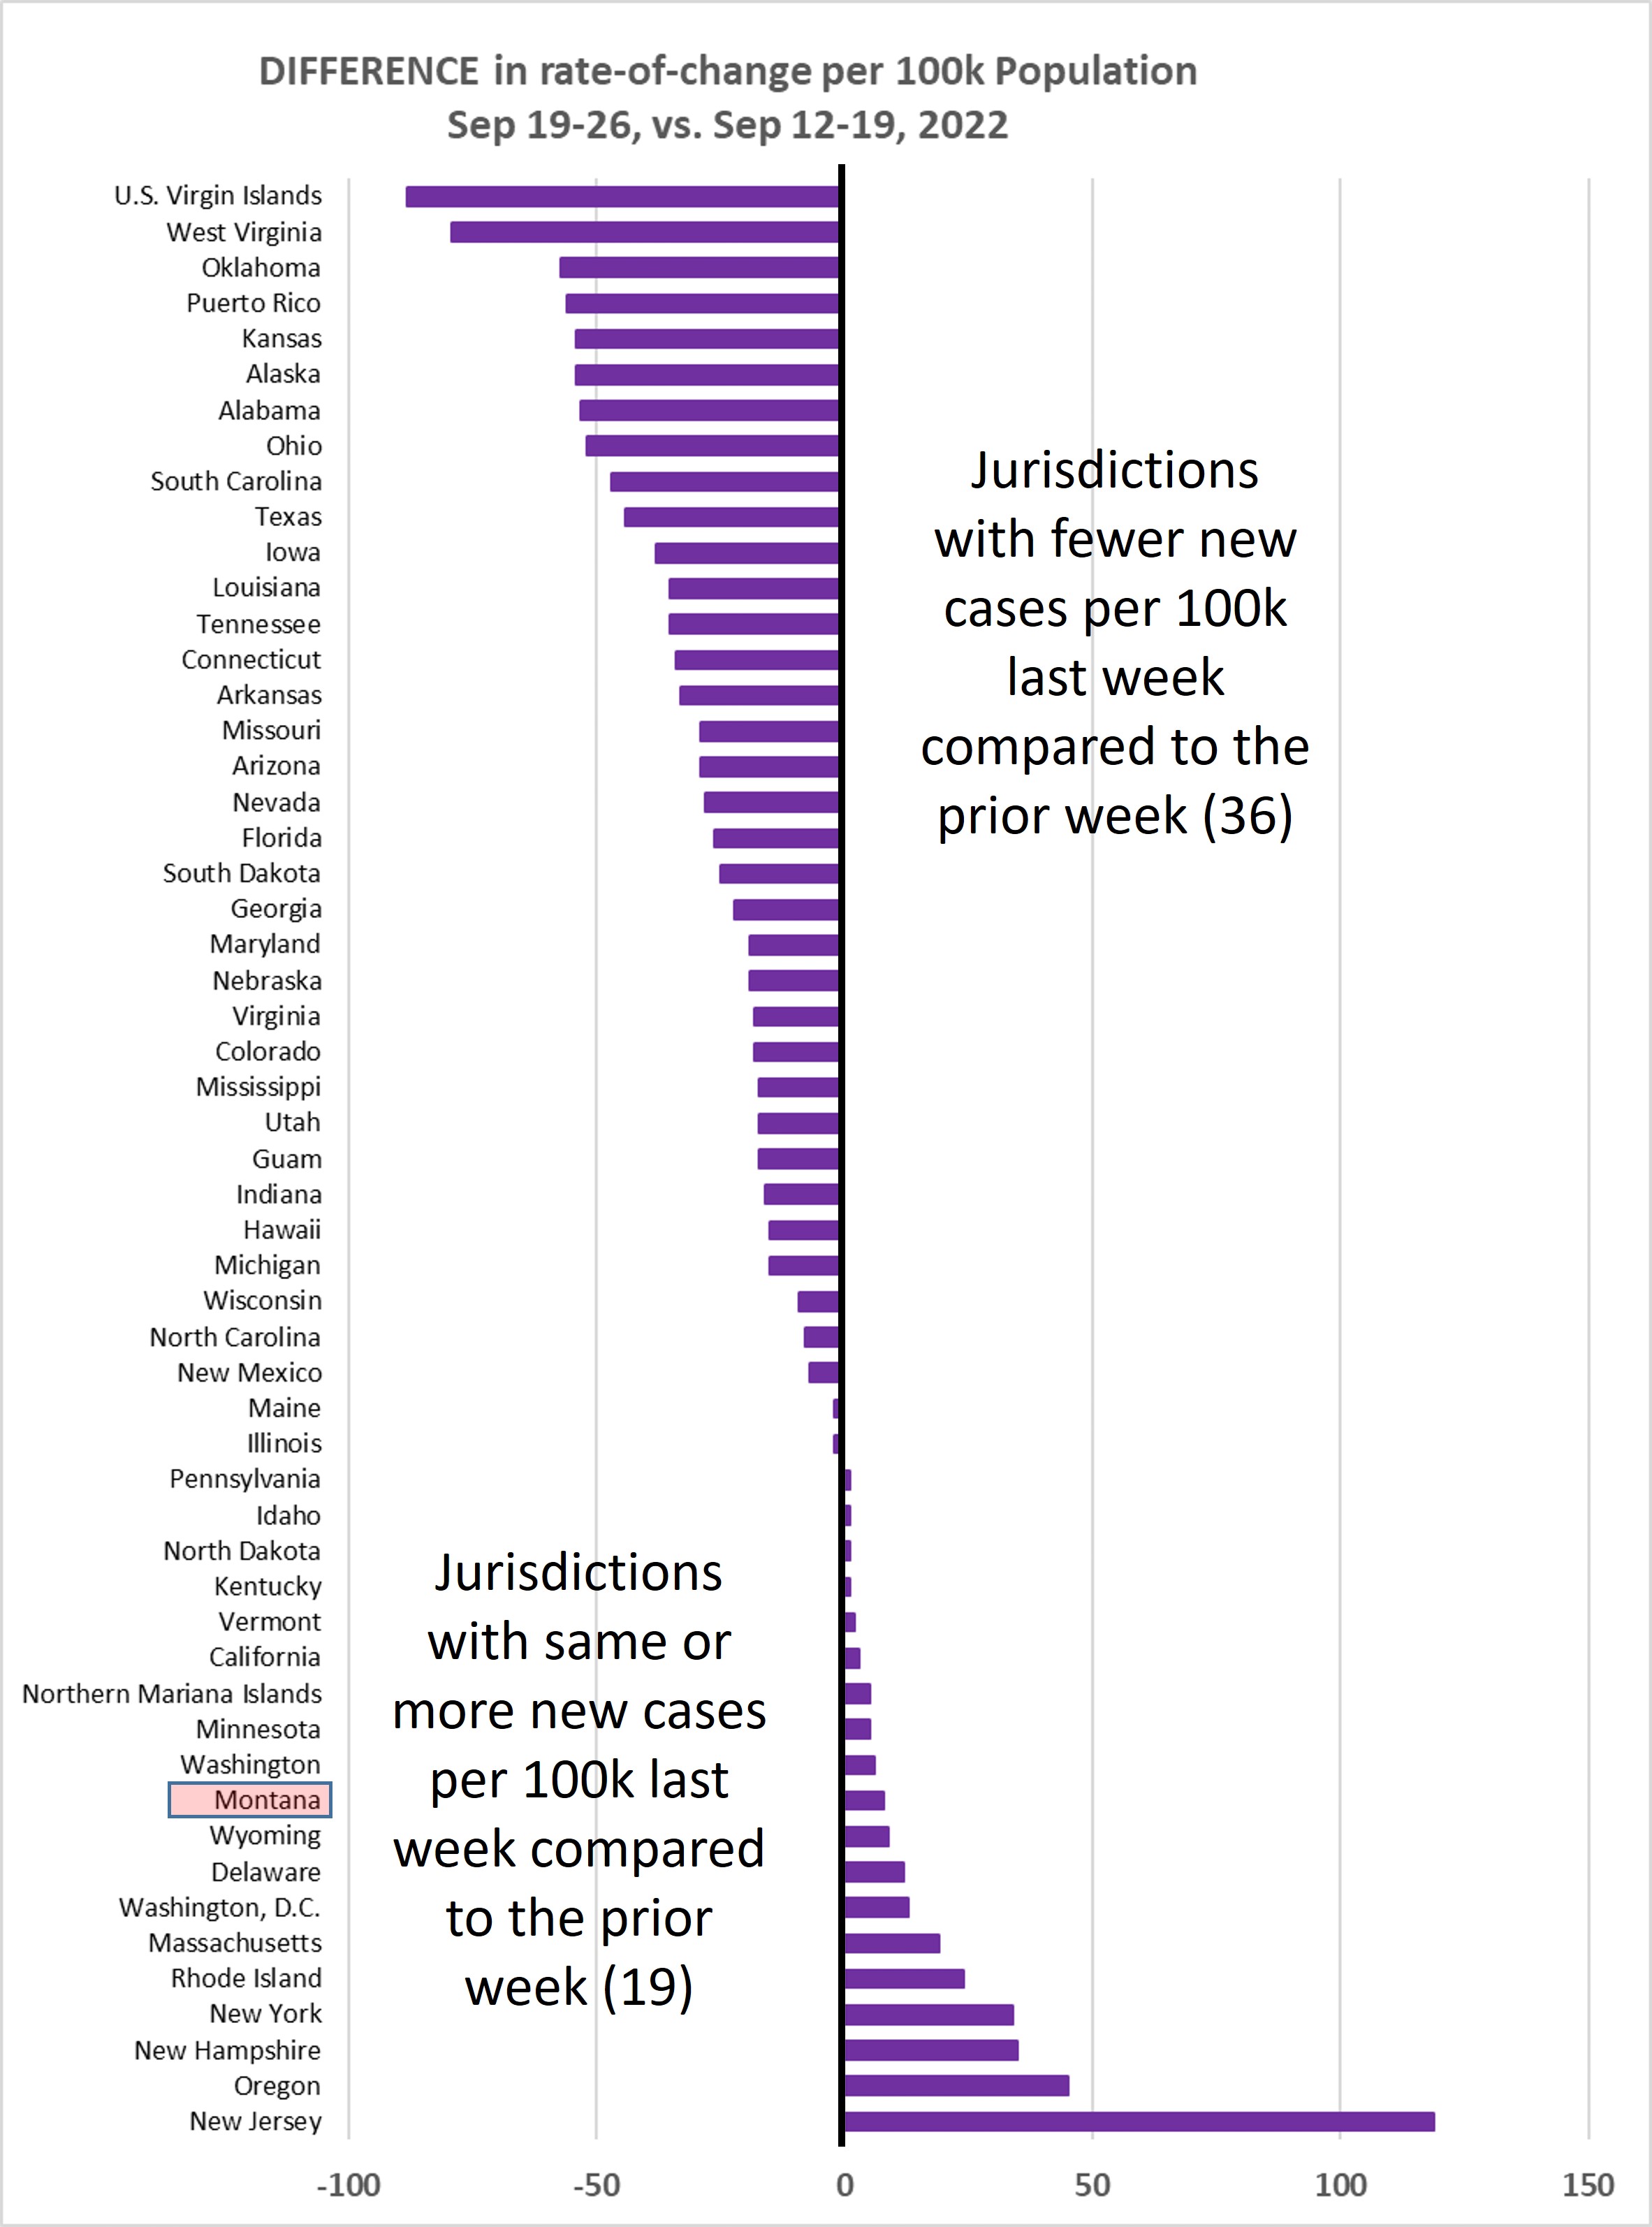
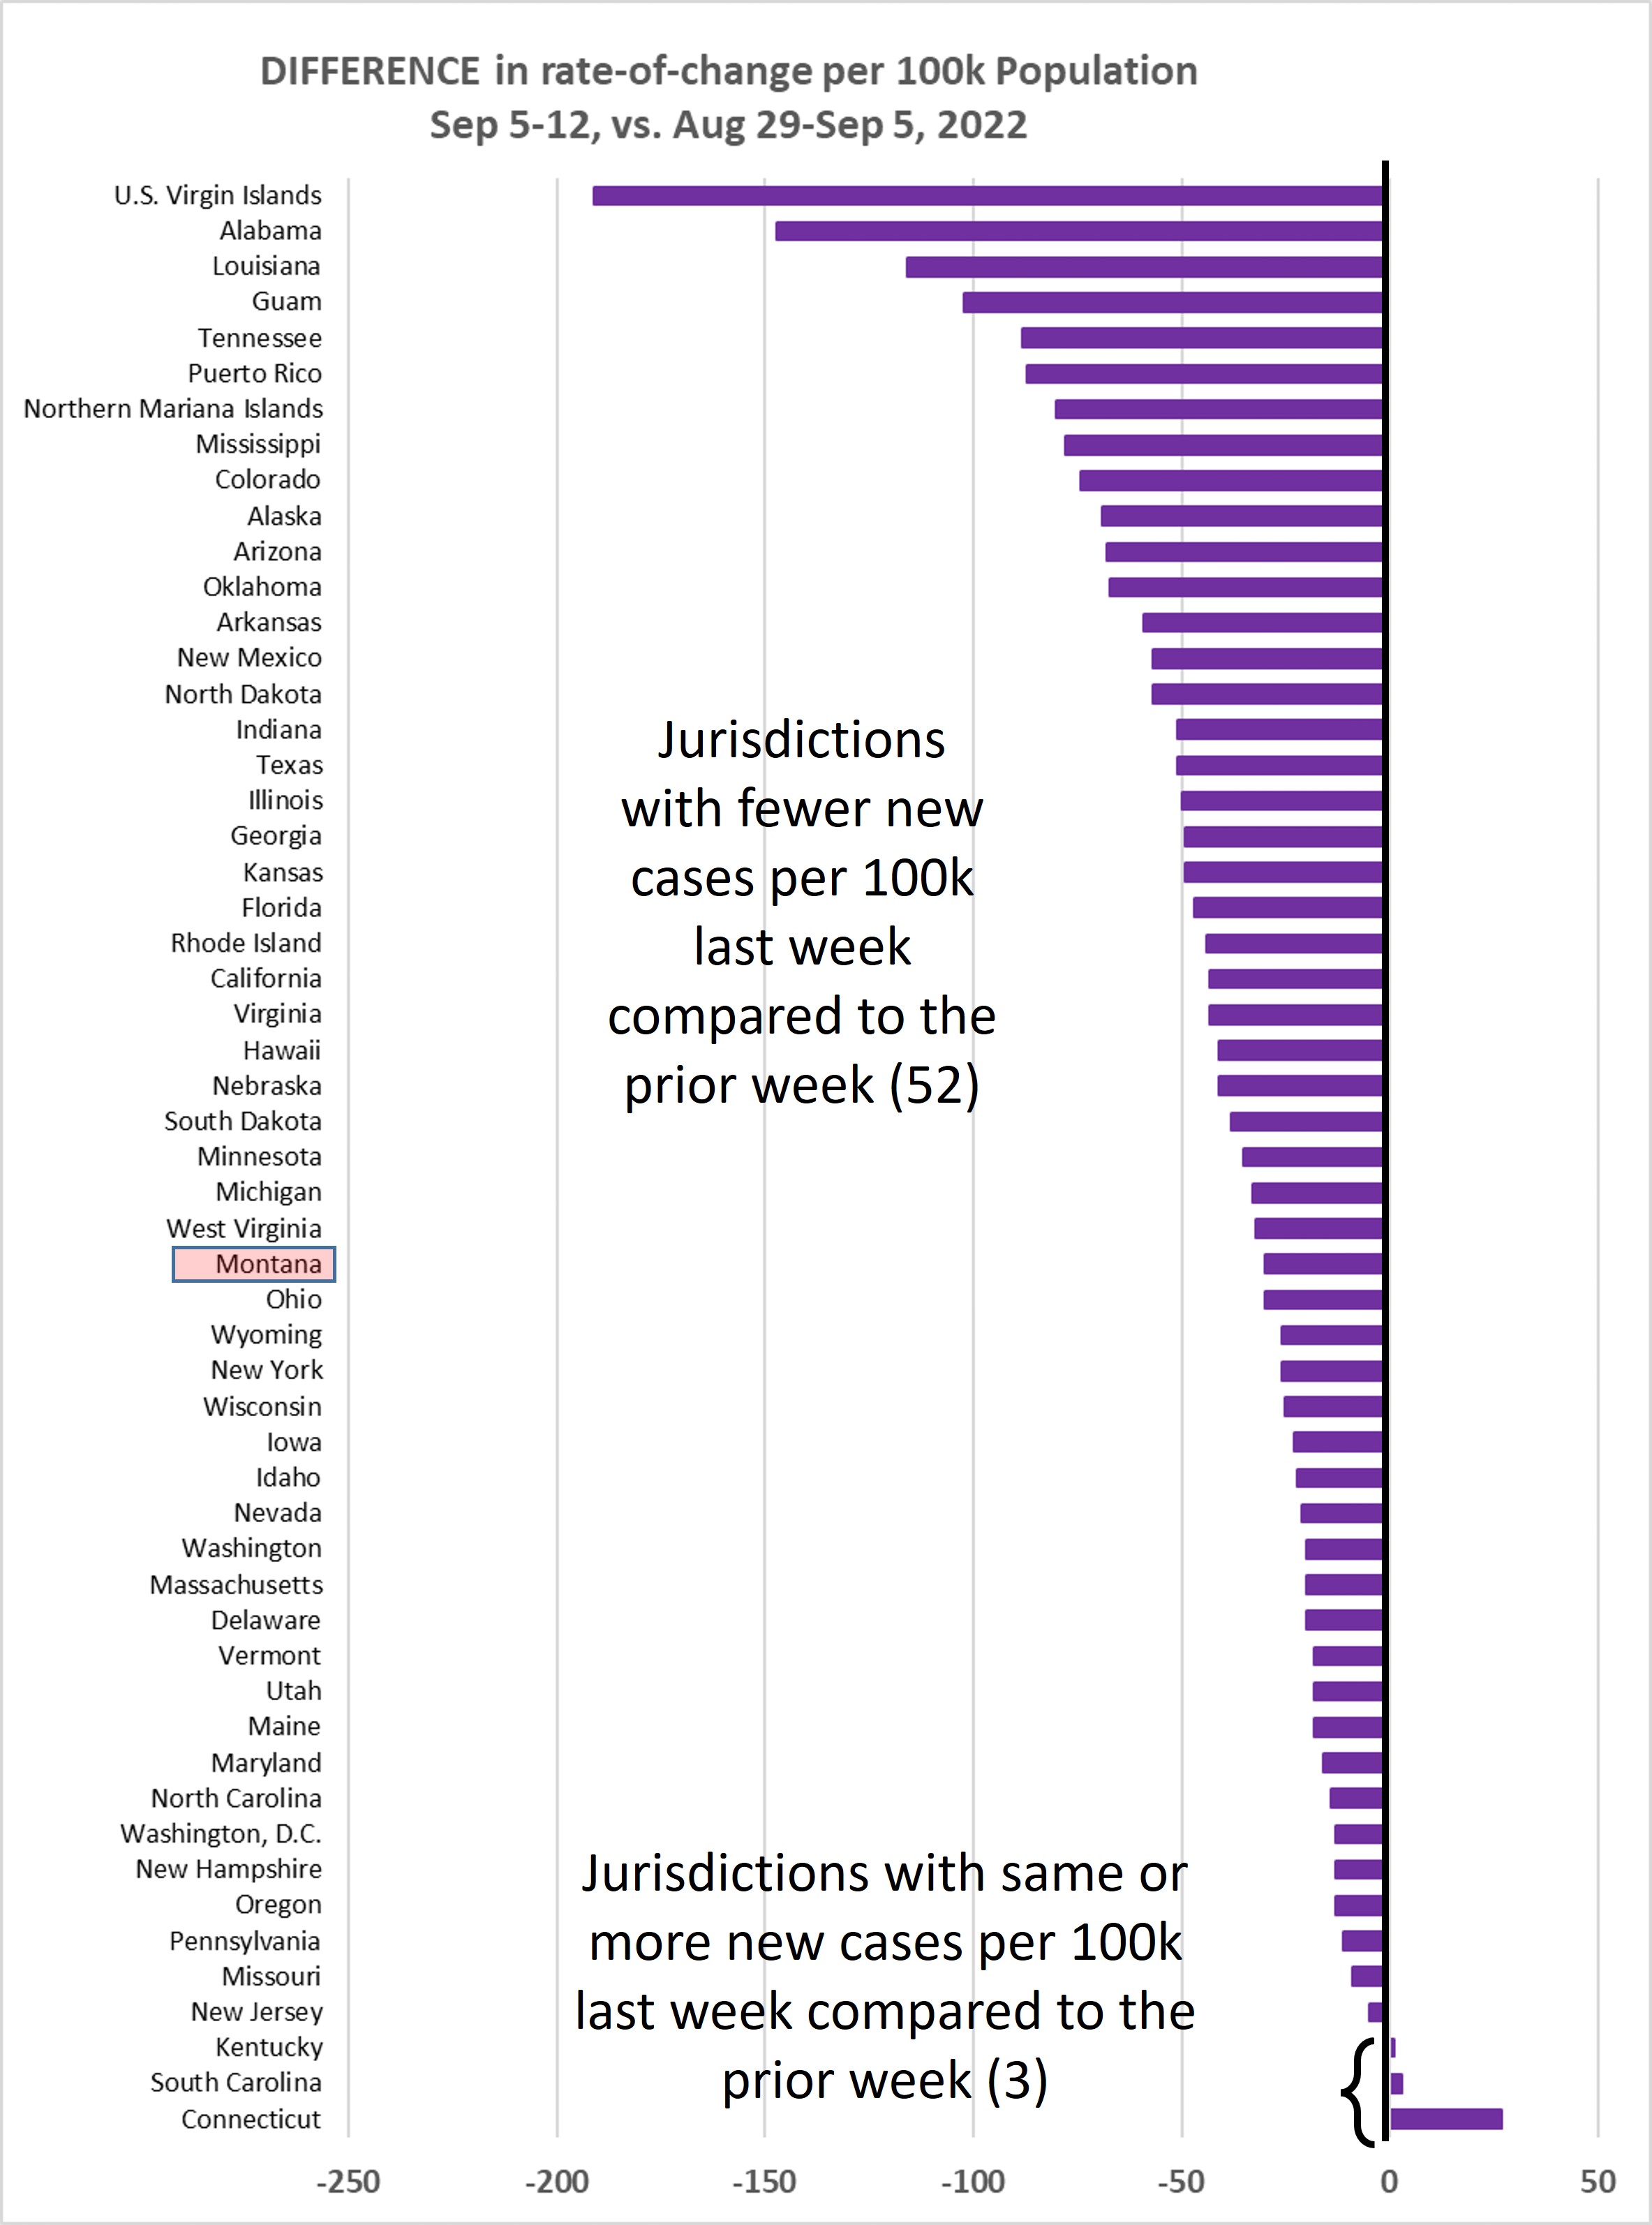
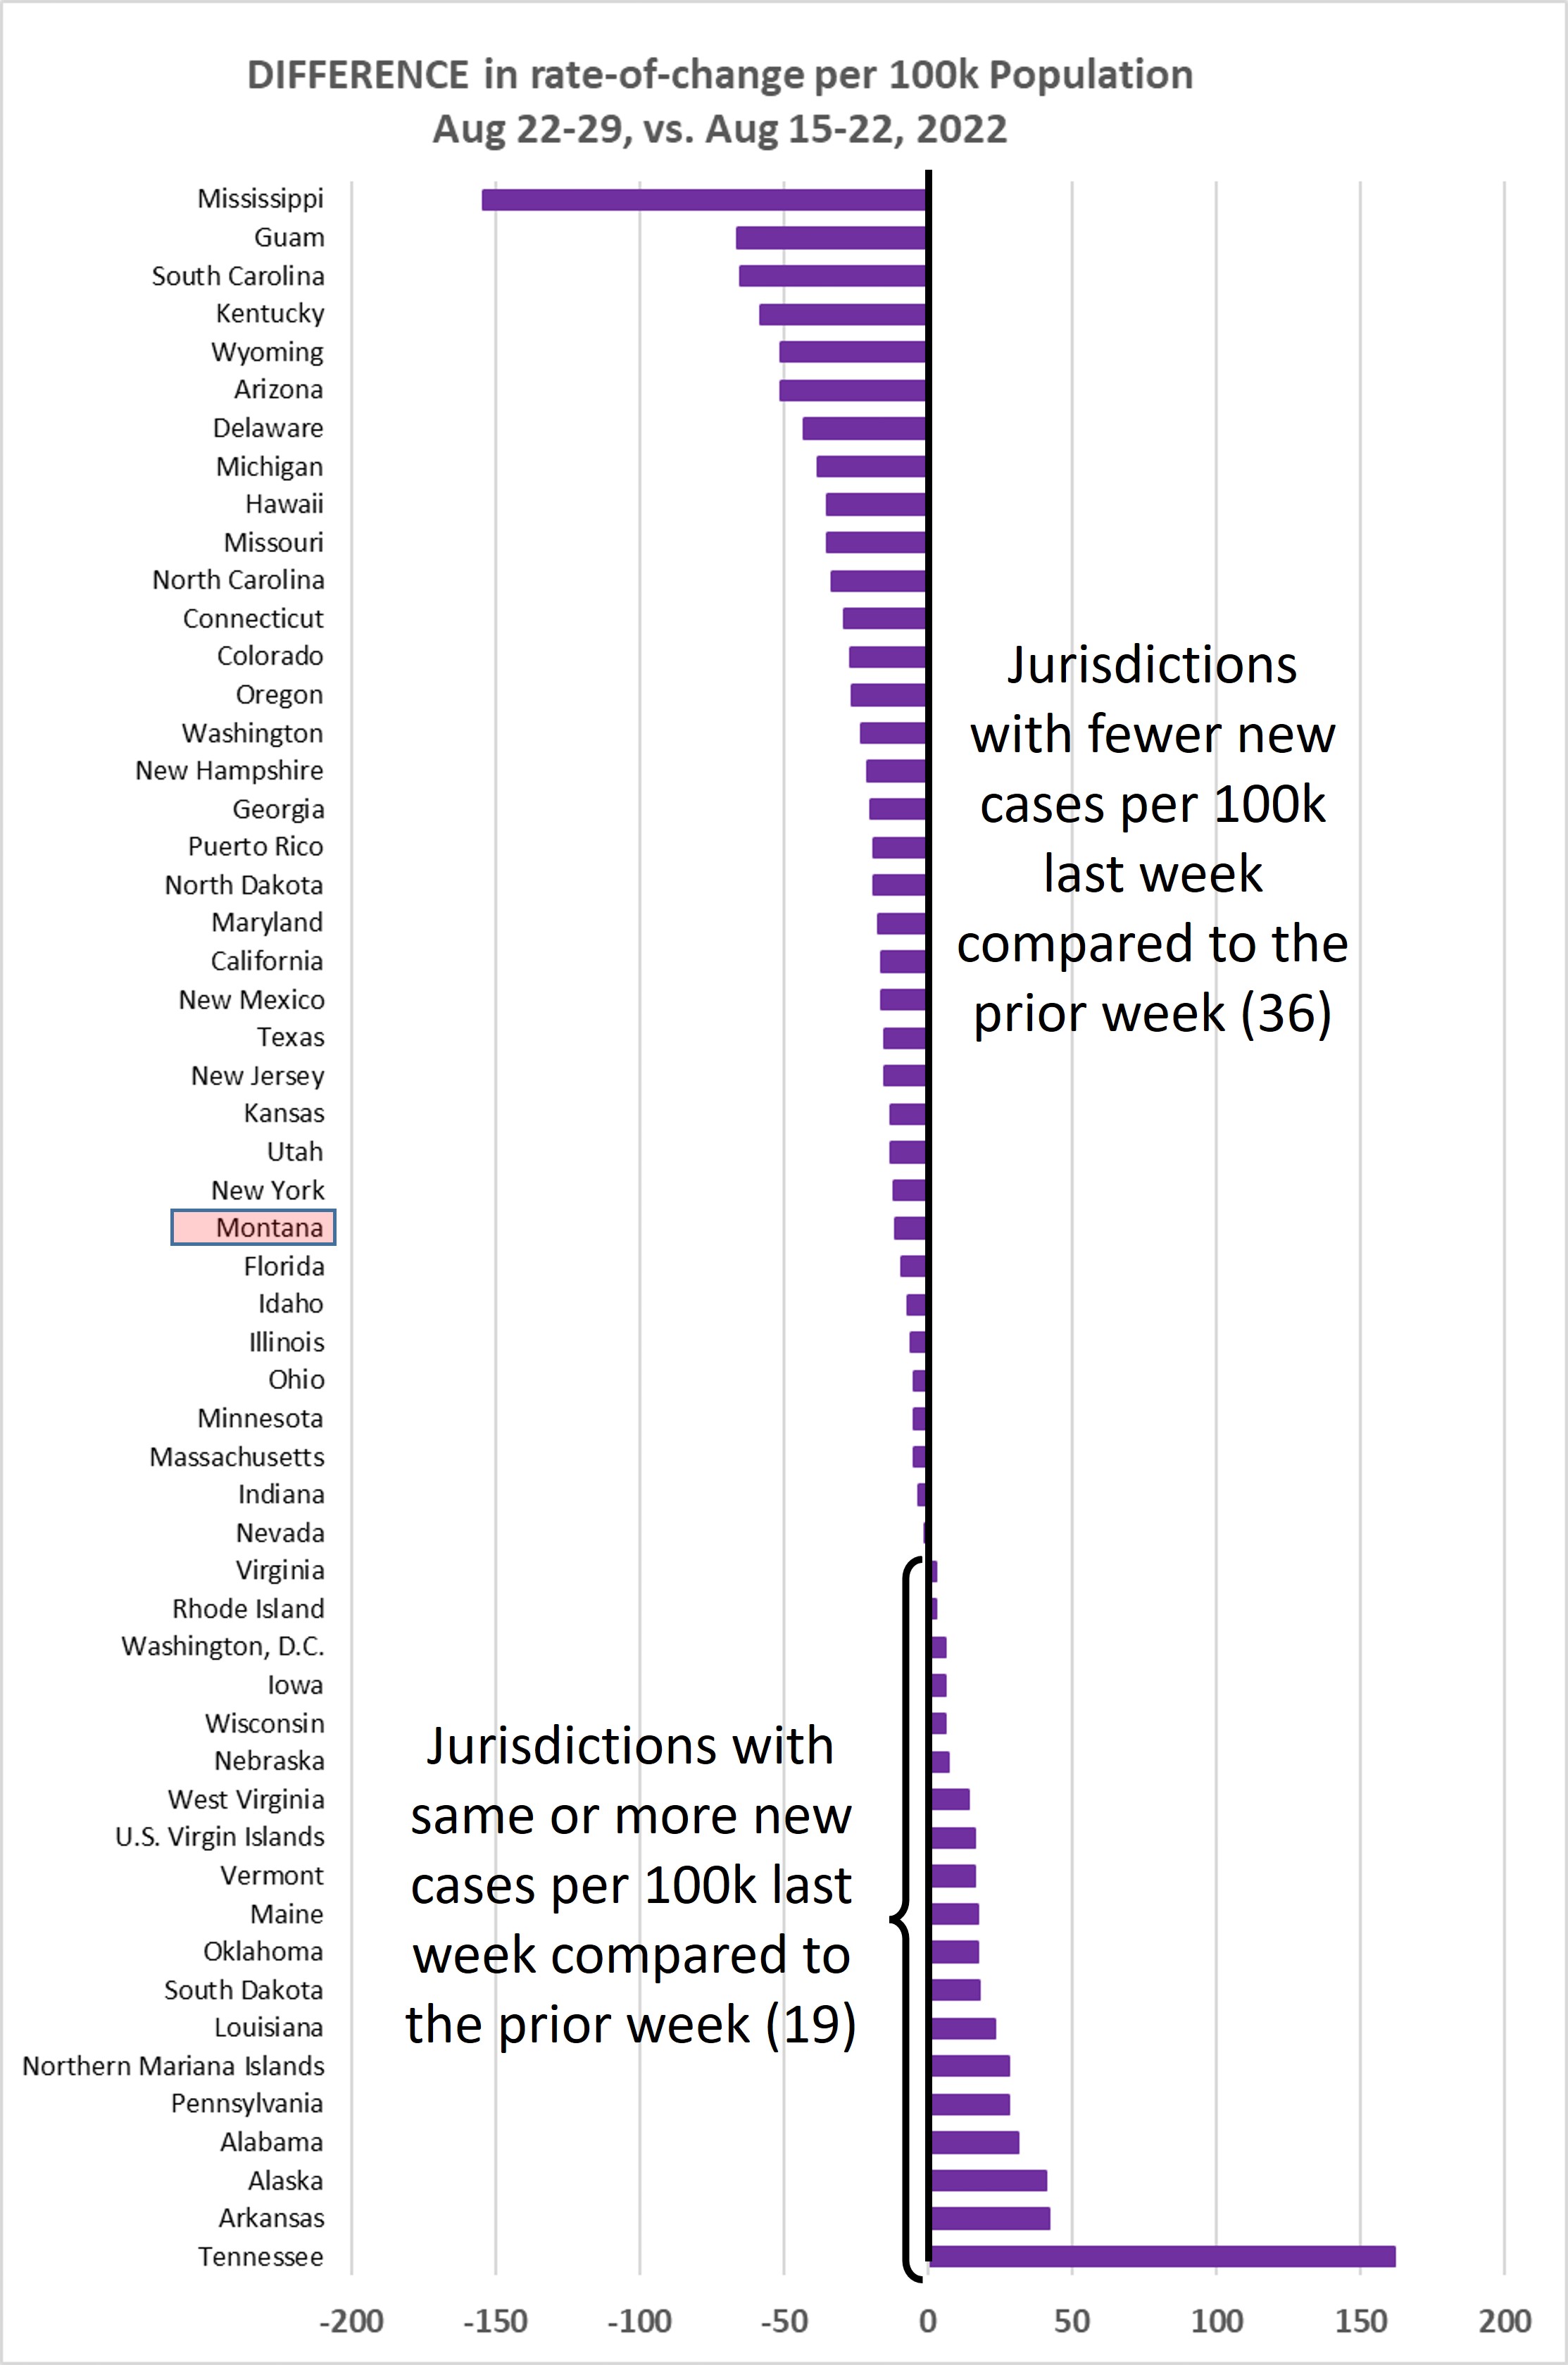
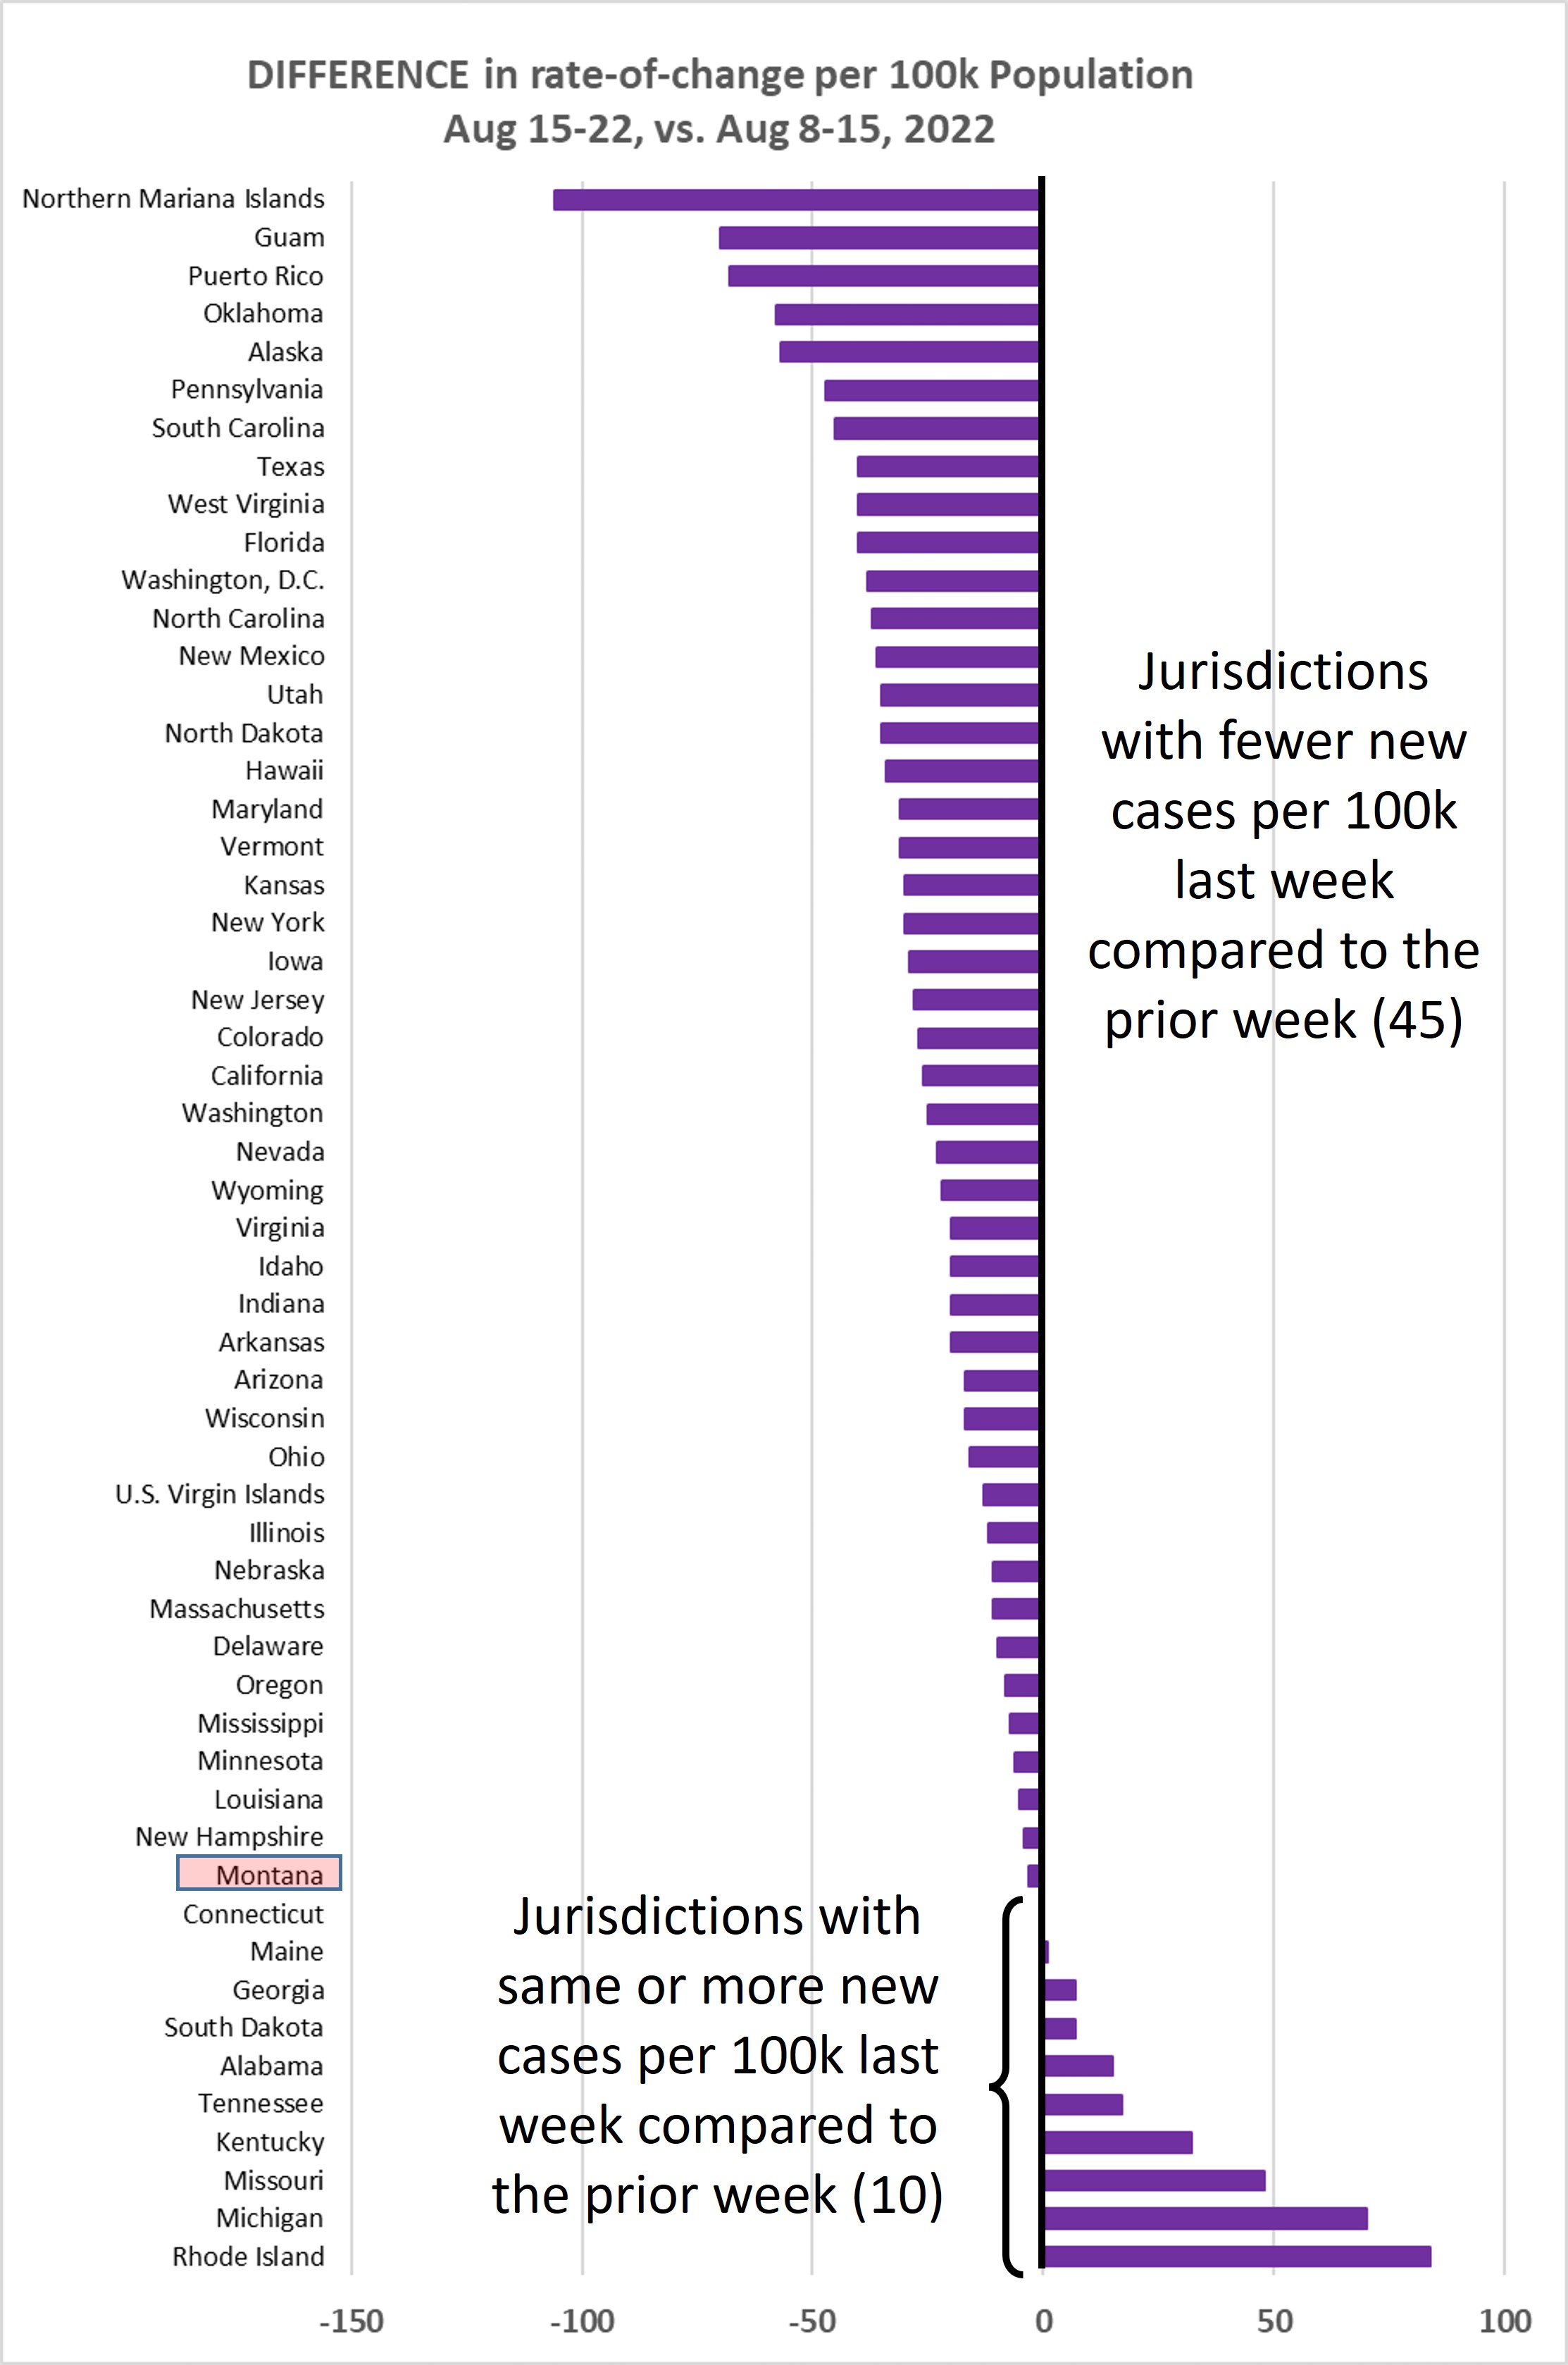
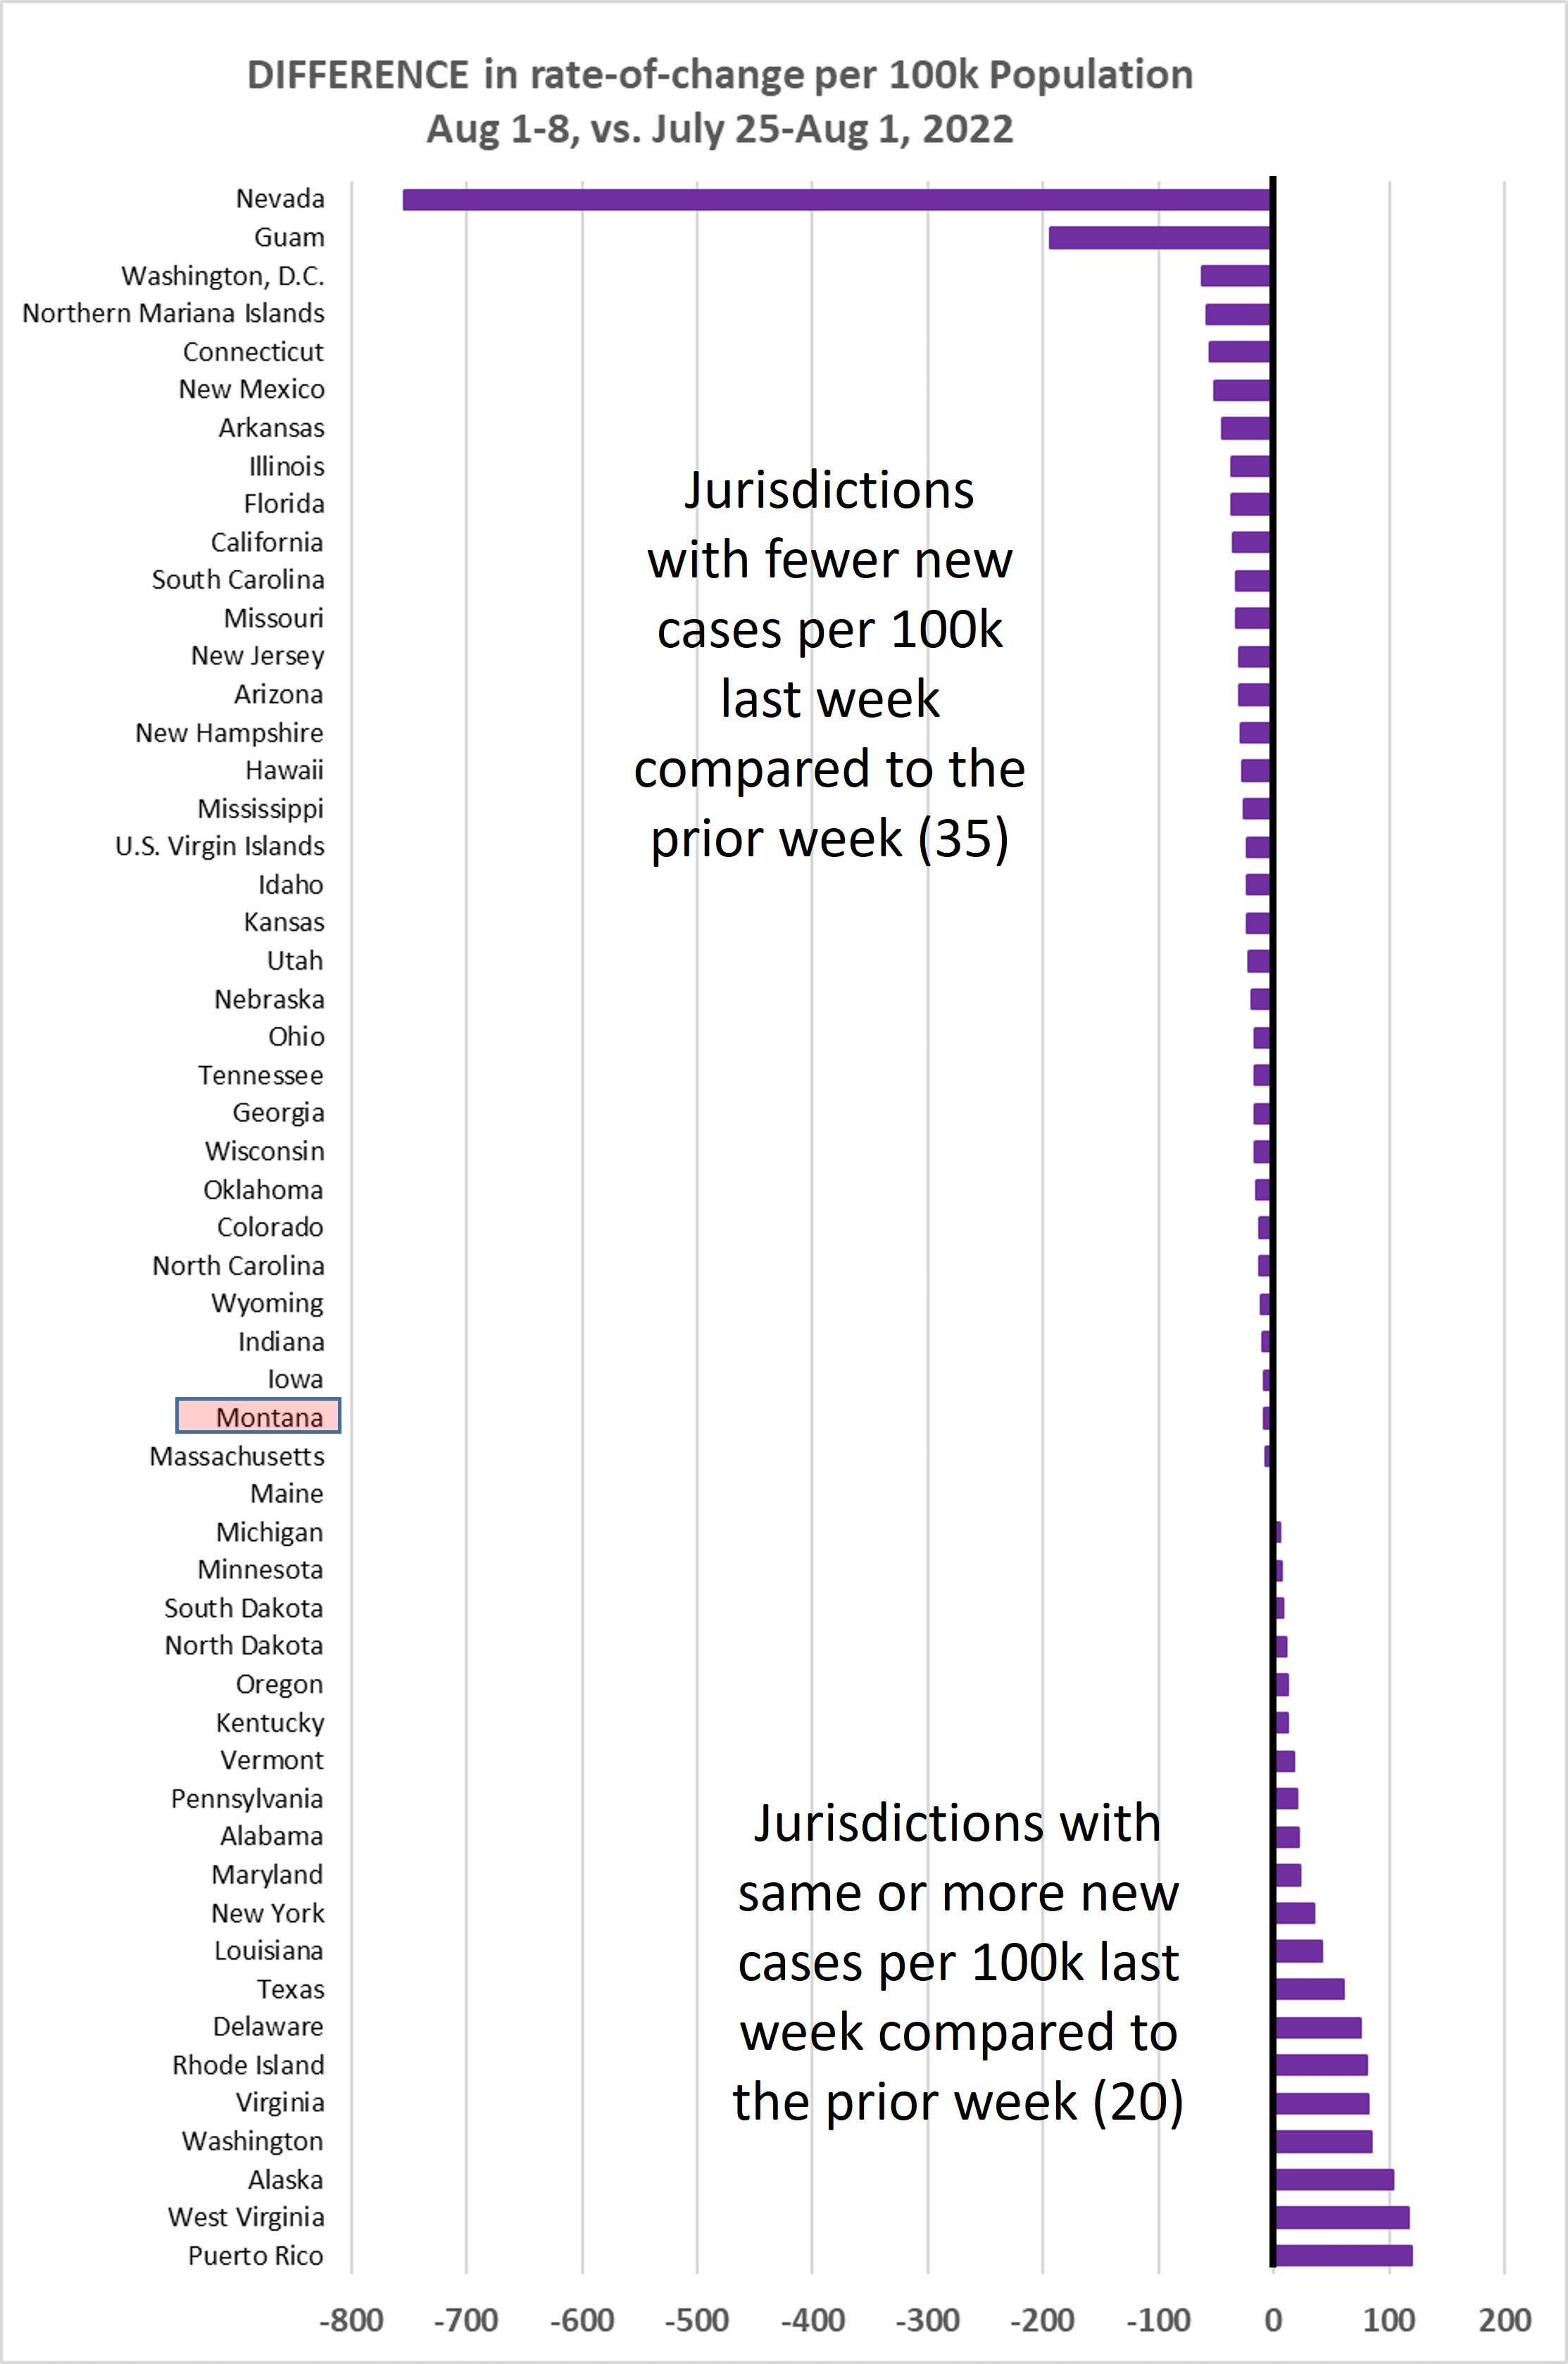
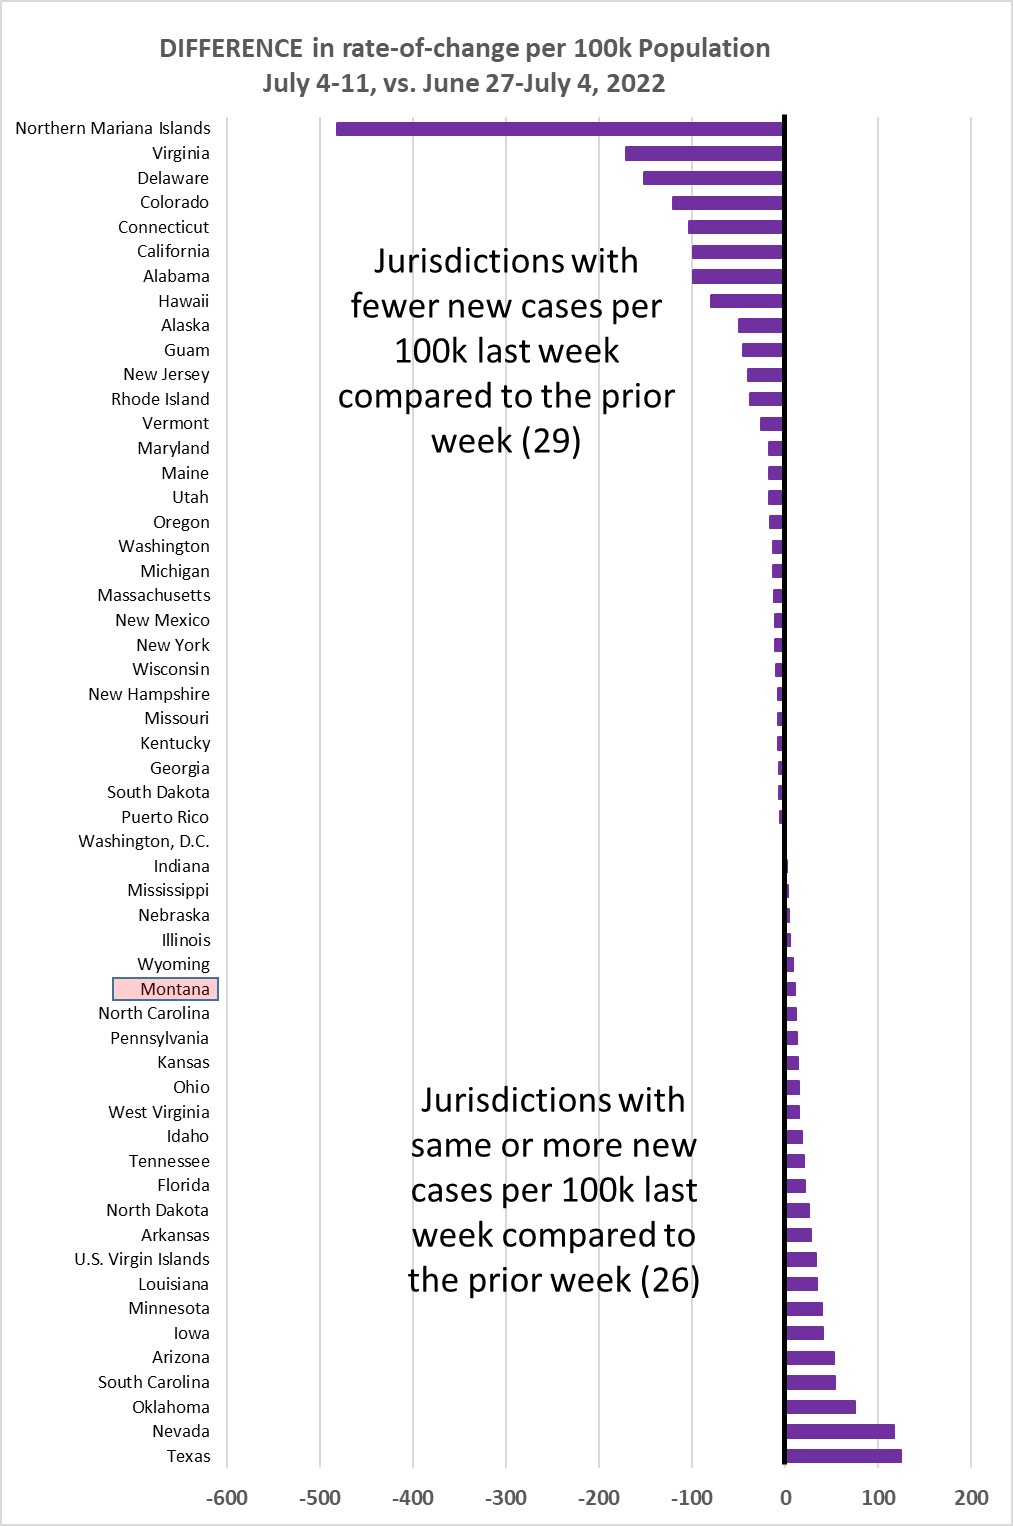
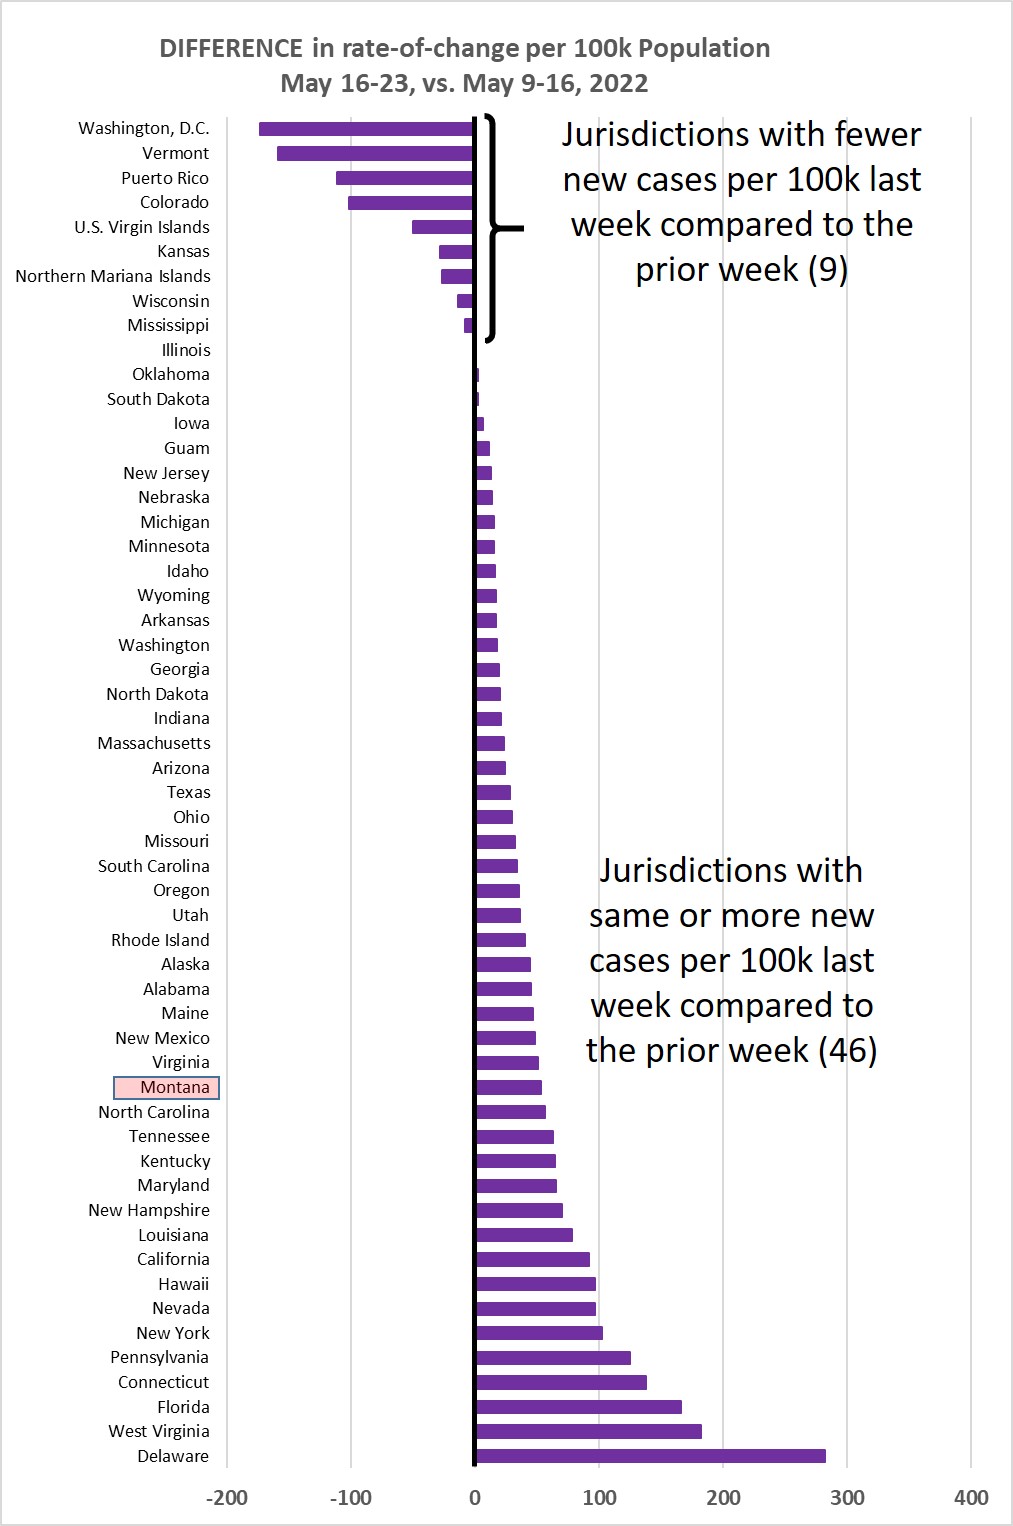
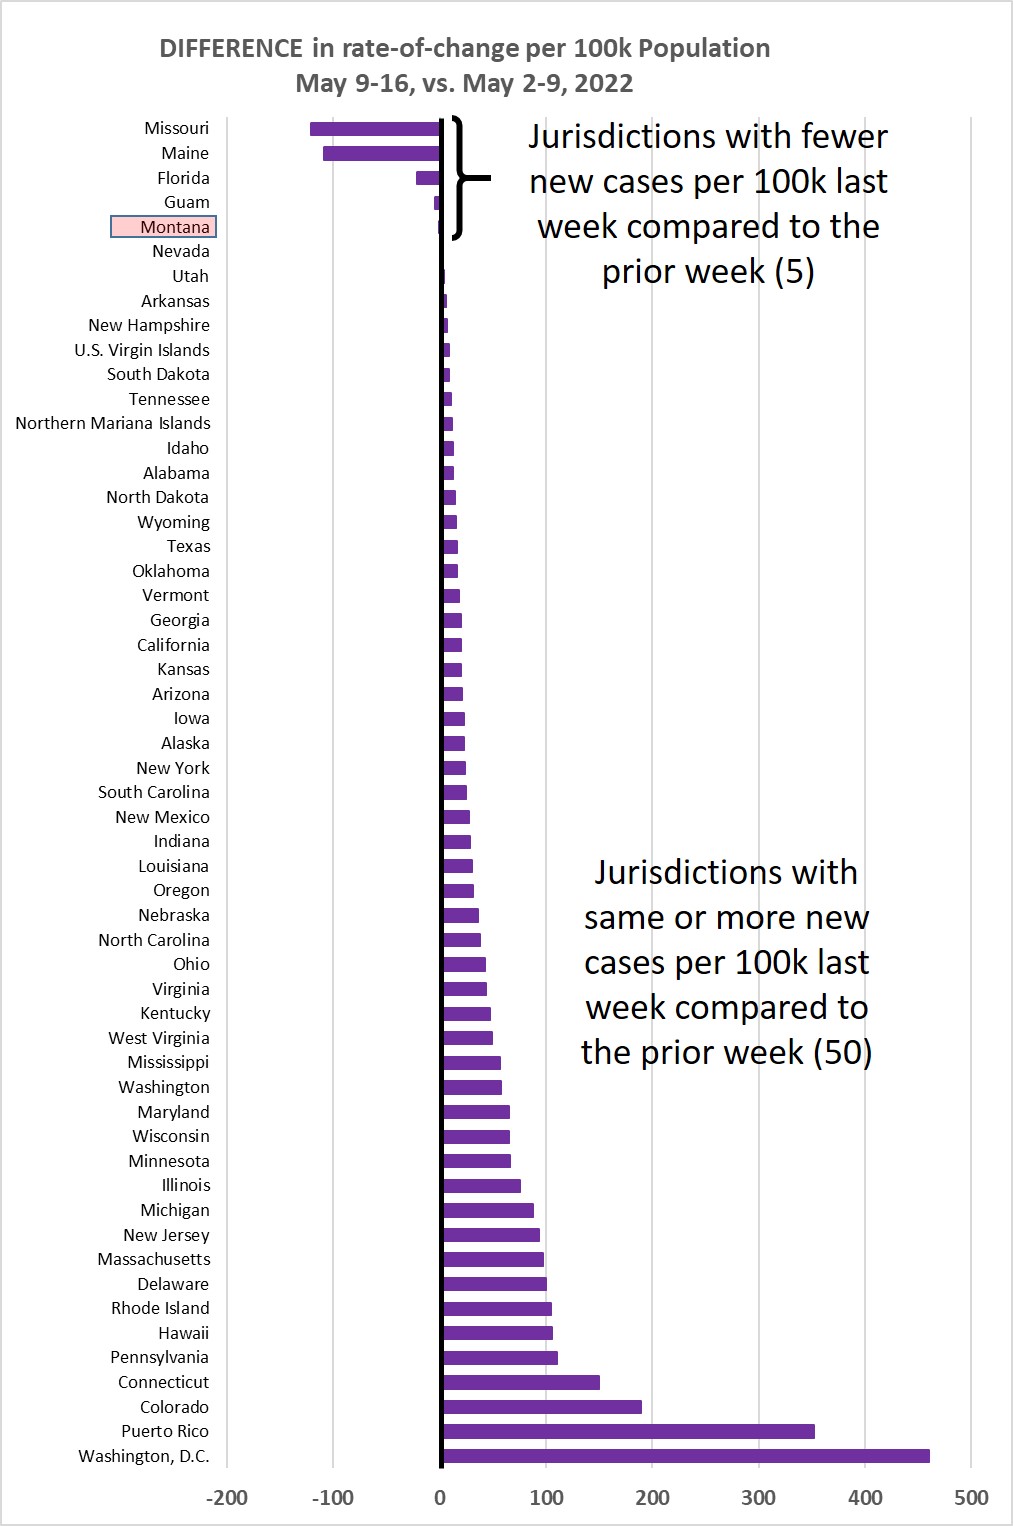
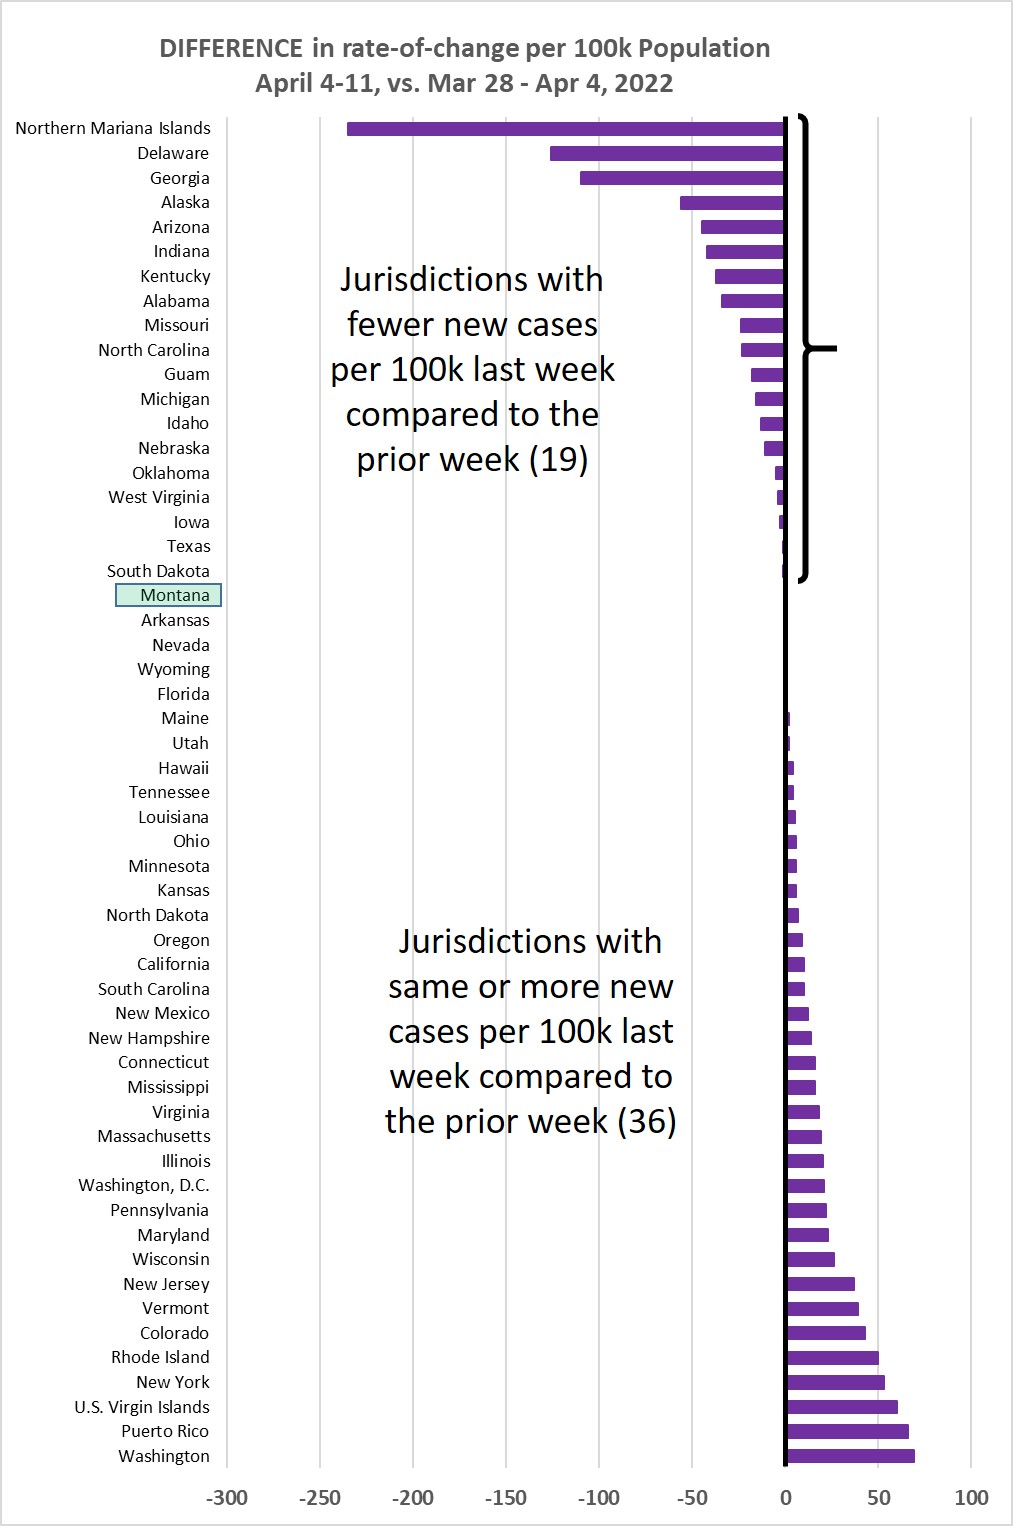
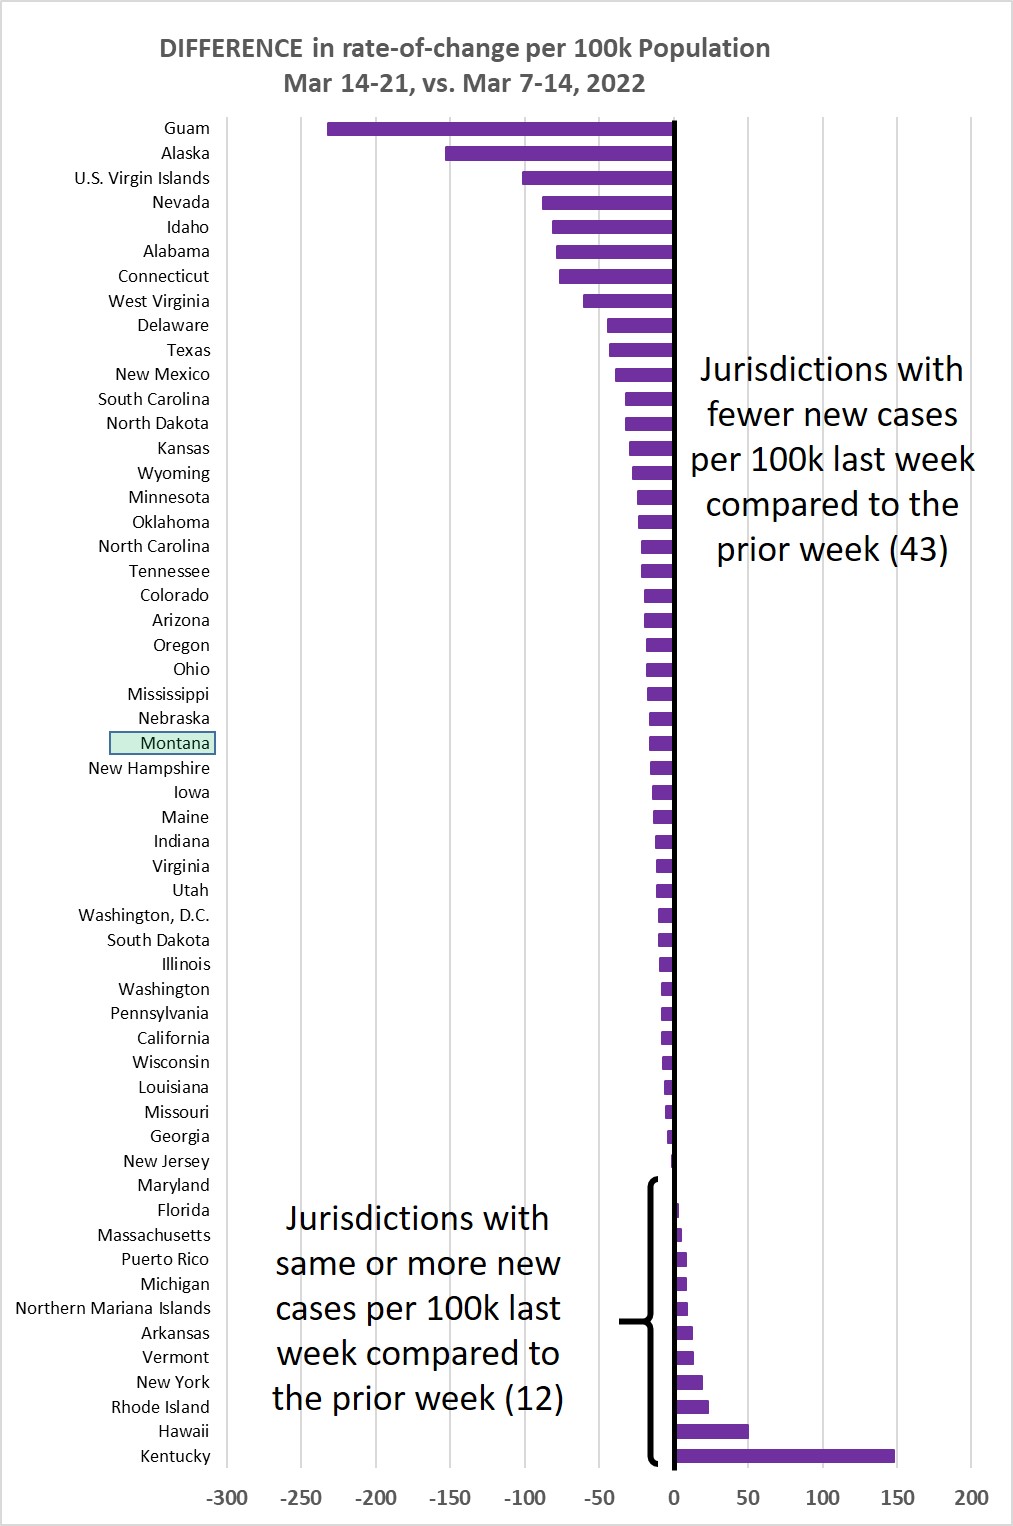
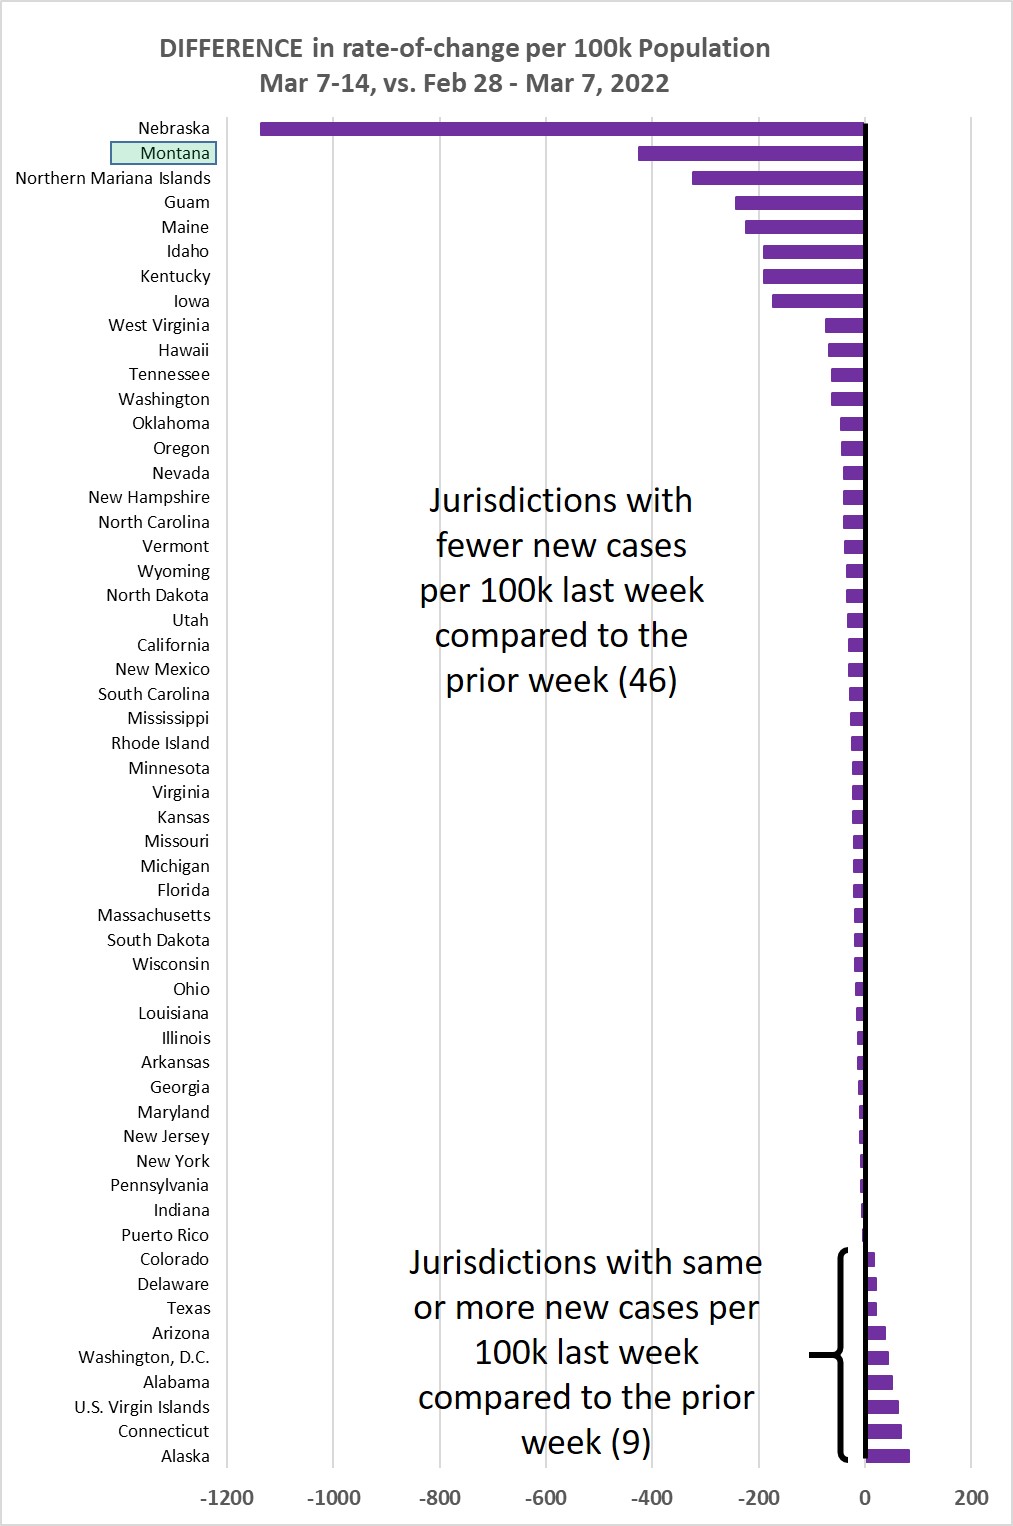
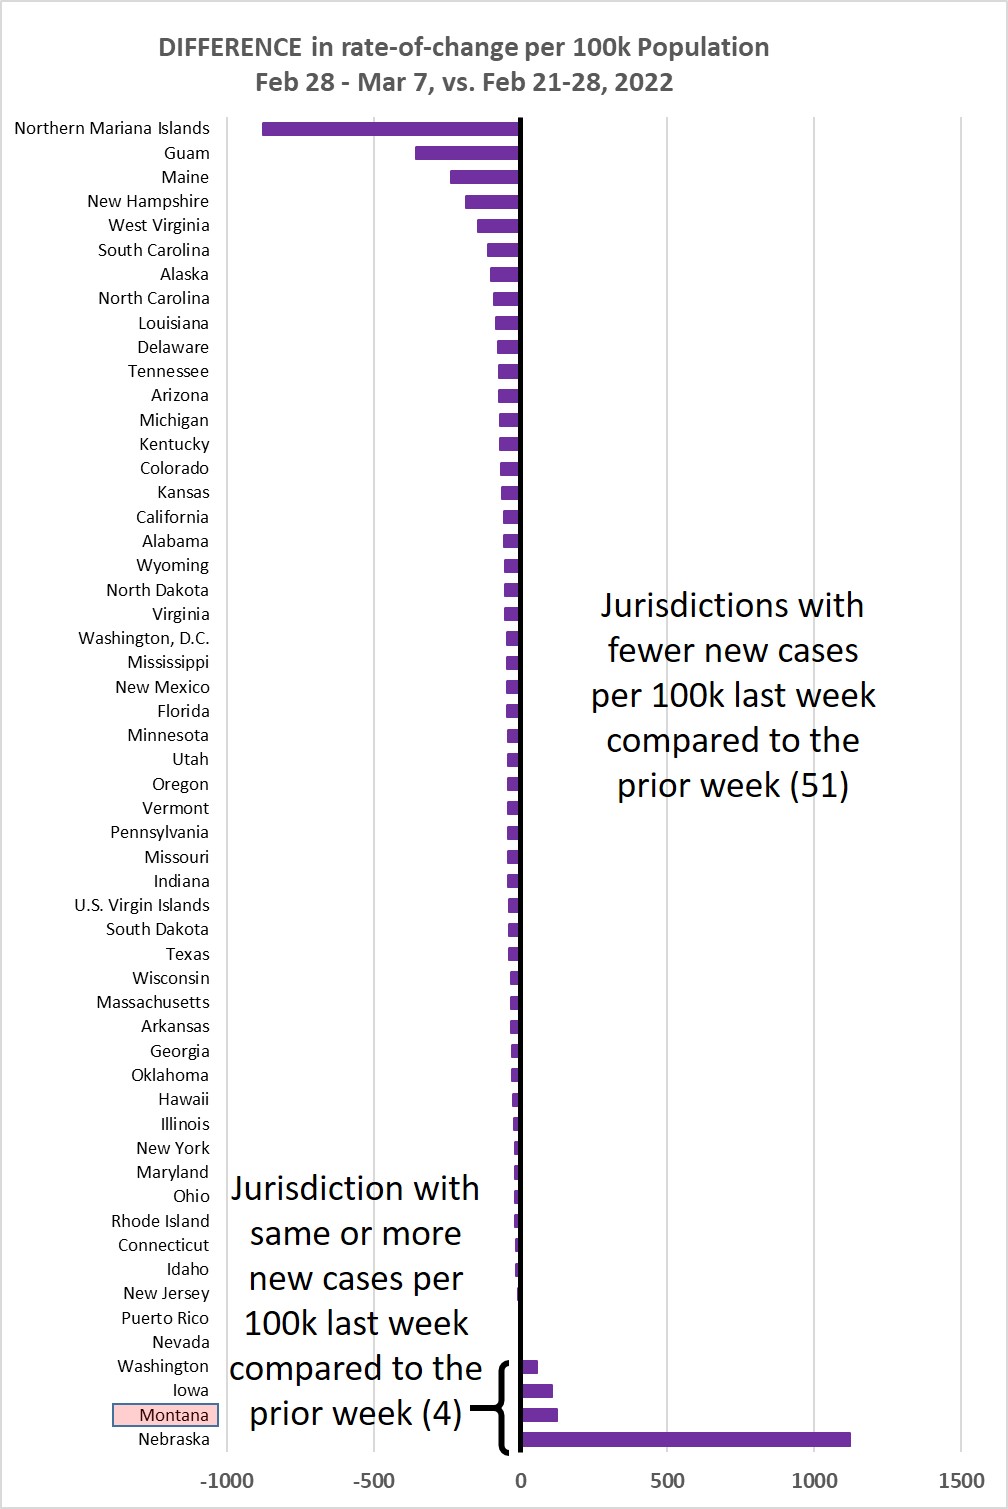
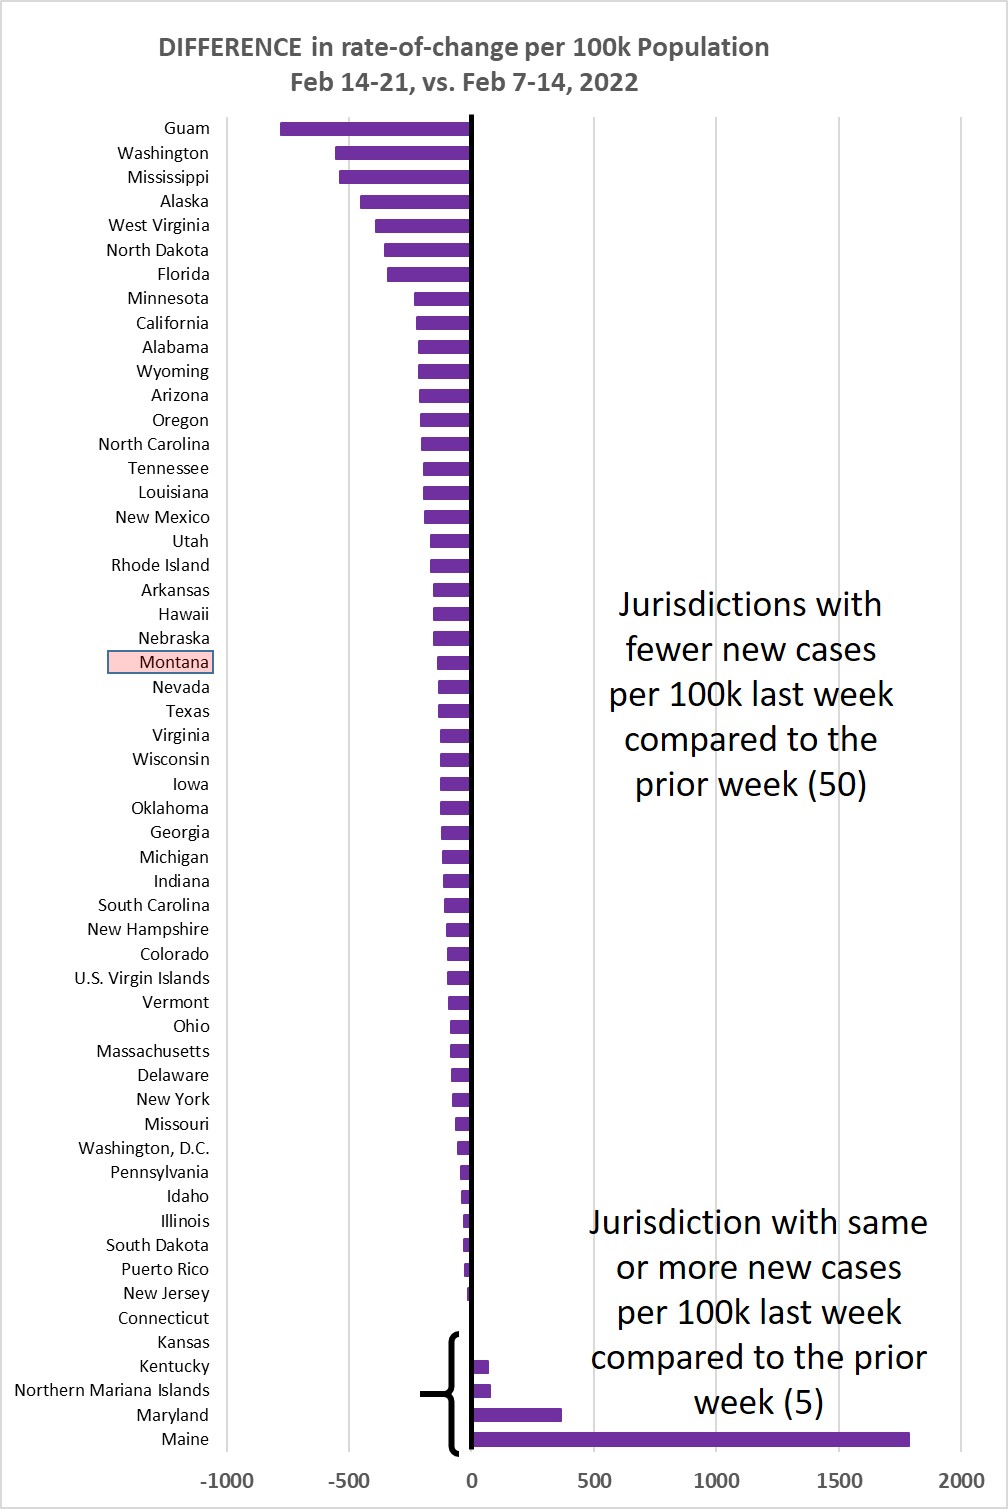
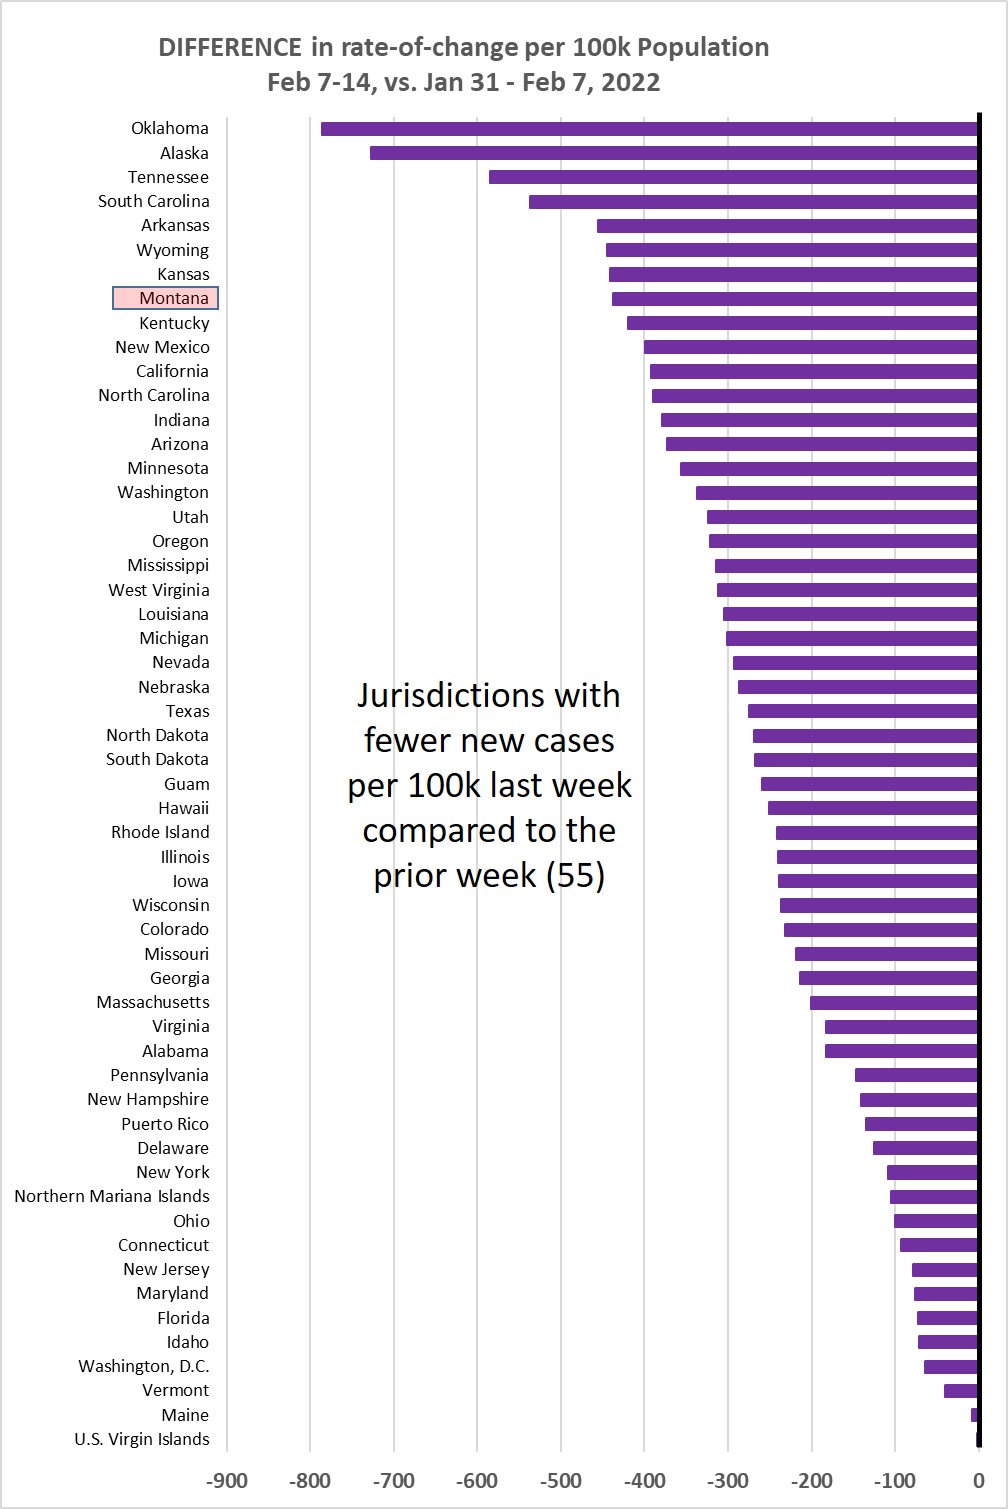
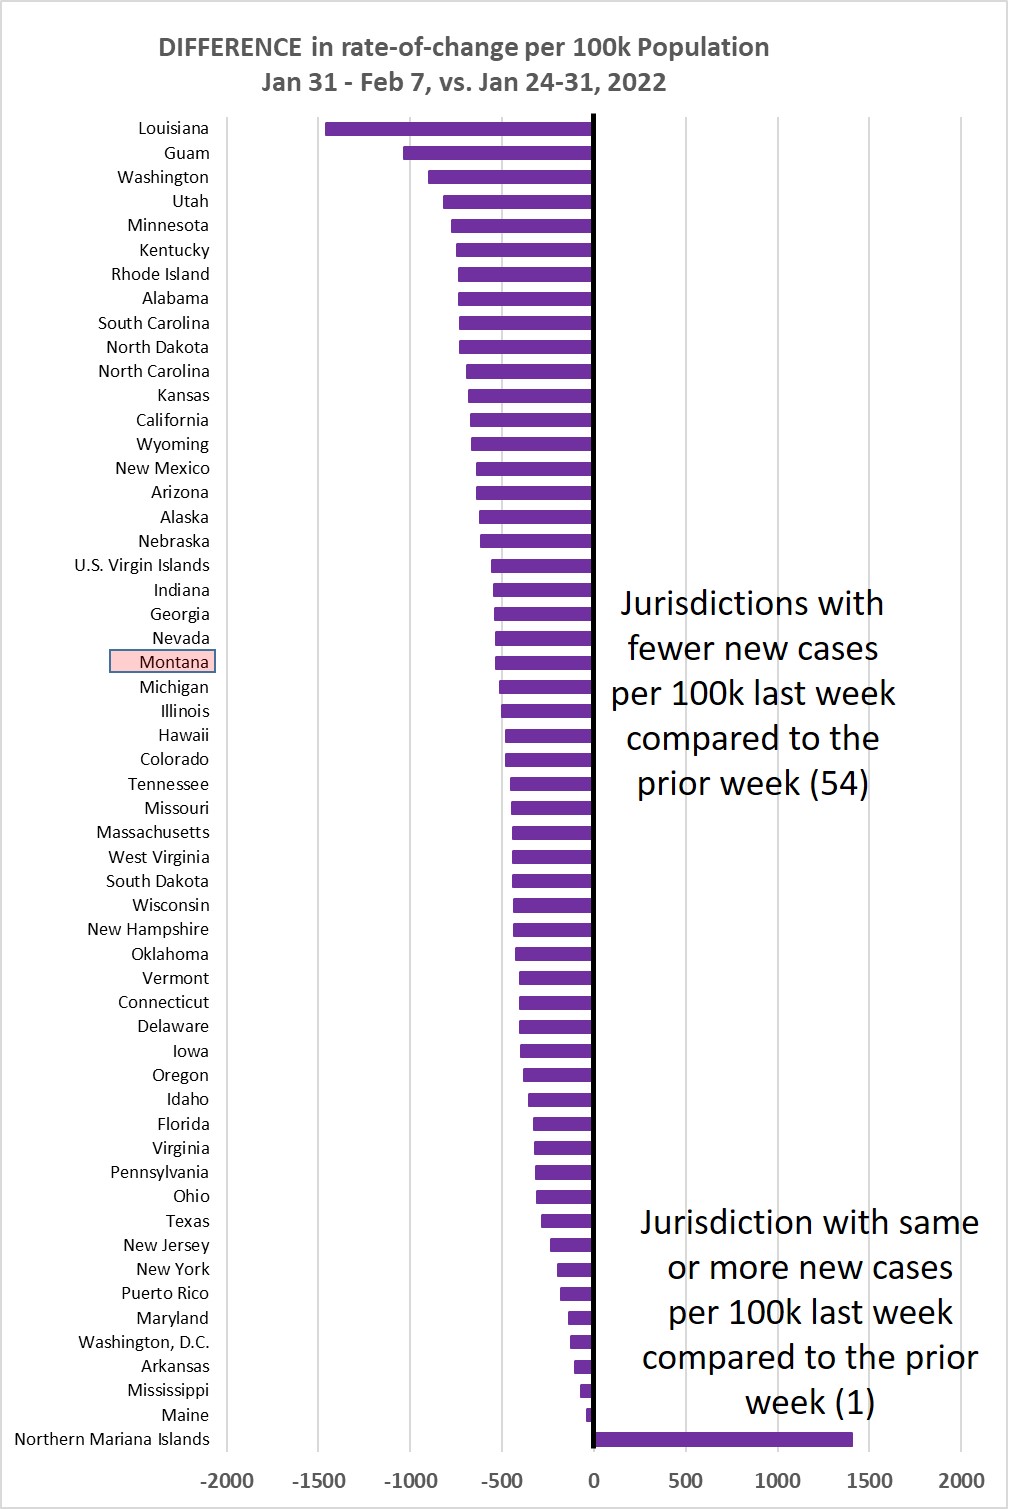
Chart 3 shows the difference in weekly new cases per 100k population for Jan 31-Feb
7, vs. Jan 24-31, 2022. This past week 54/55 jurisdictions (98.2%) showed a lower
rate of new cases. Nationally, we contine to move beyond the Omicron peak.
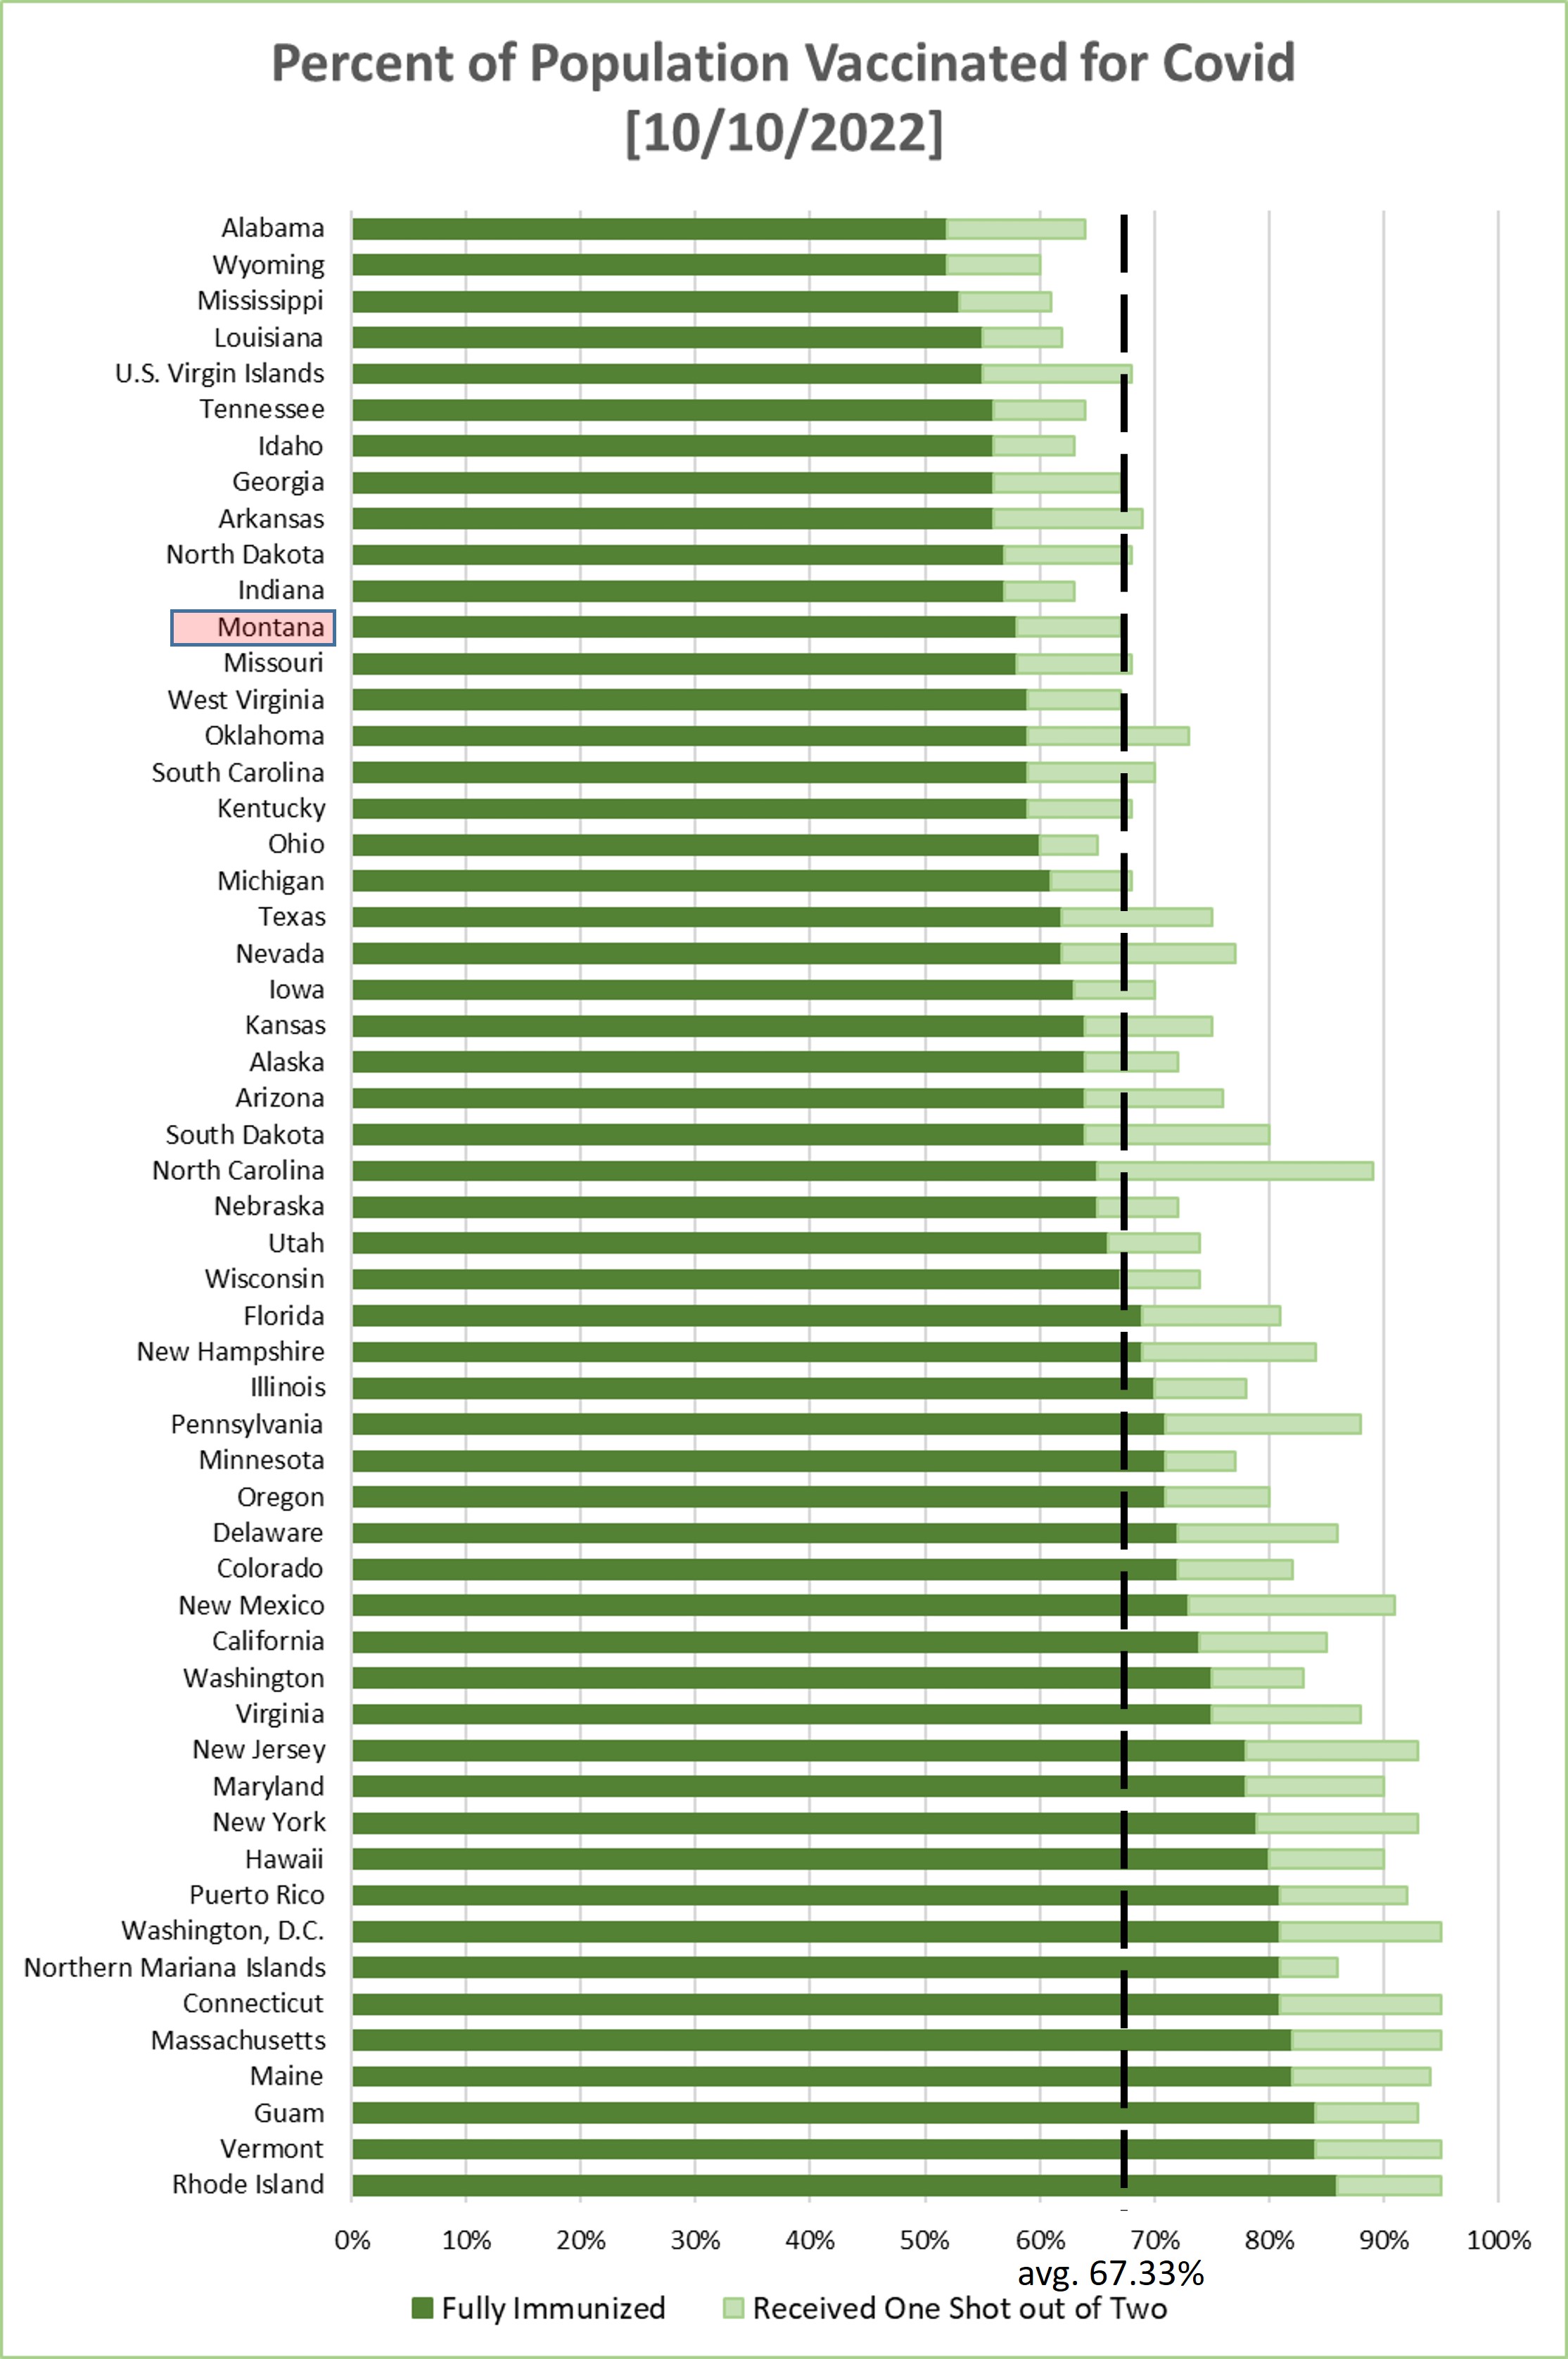
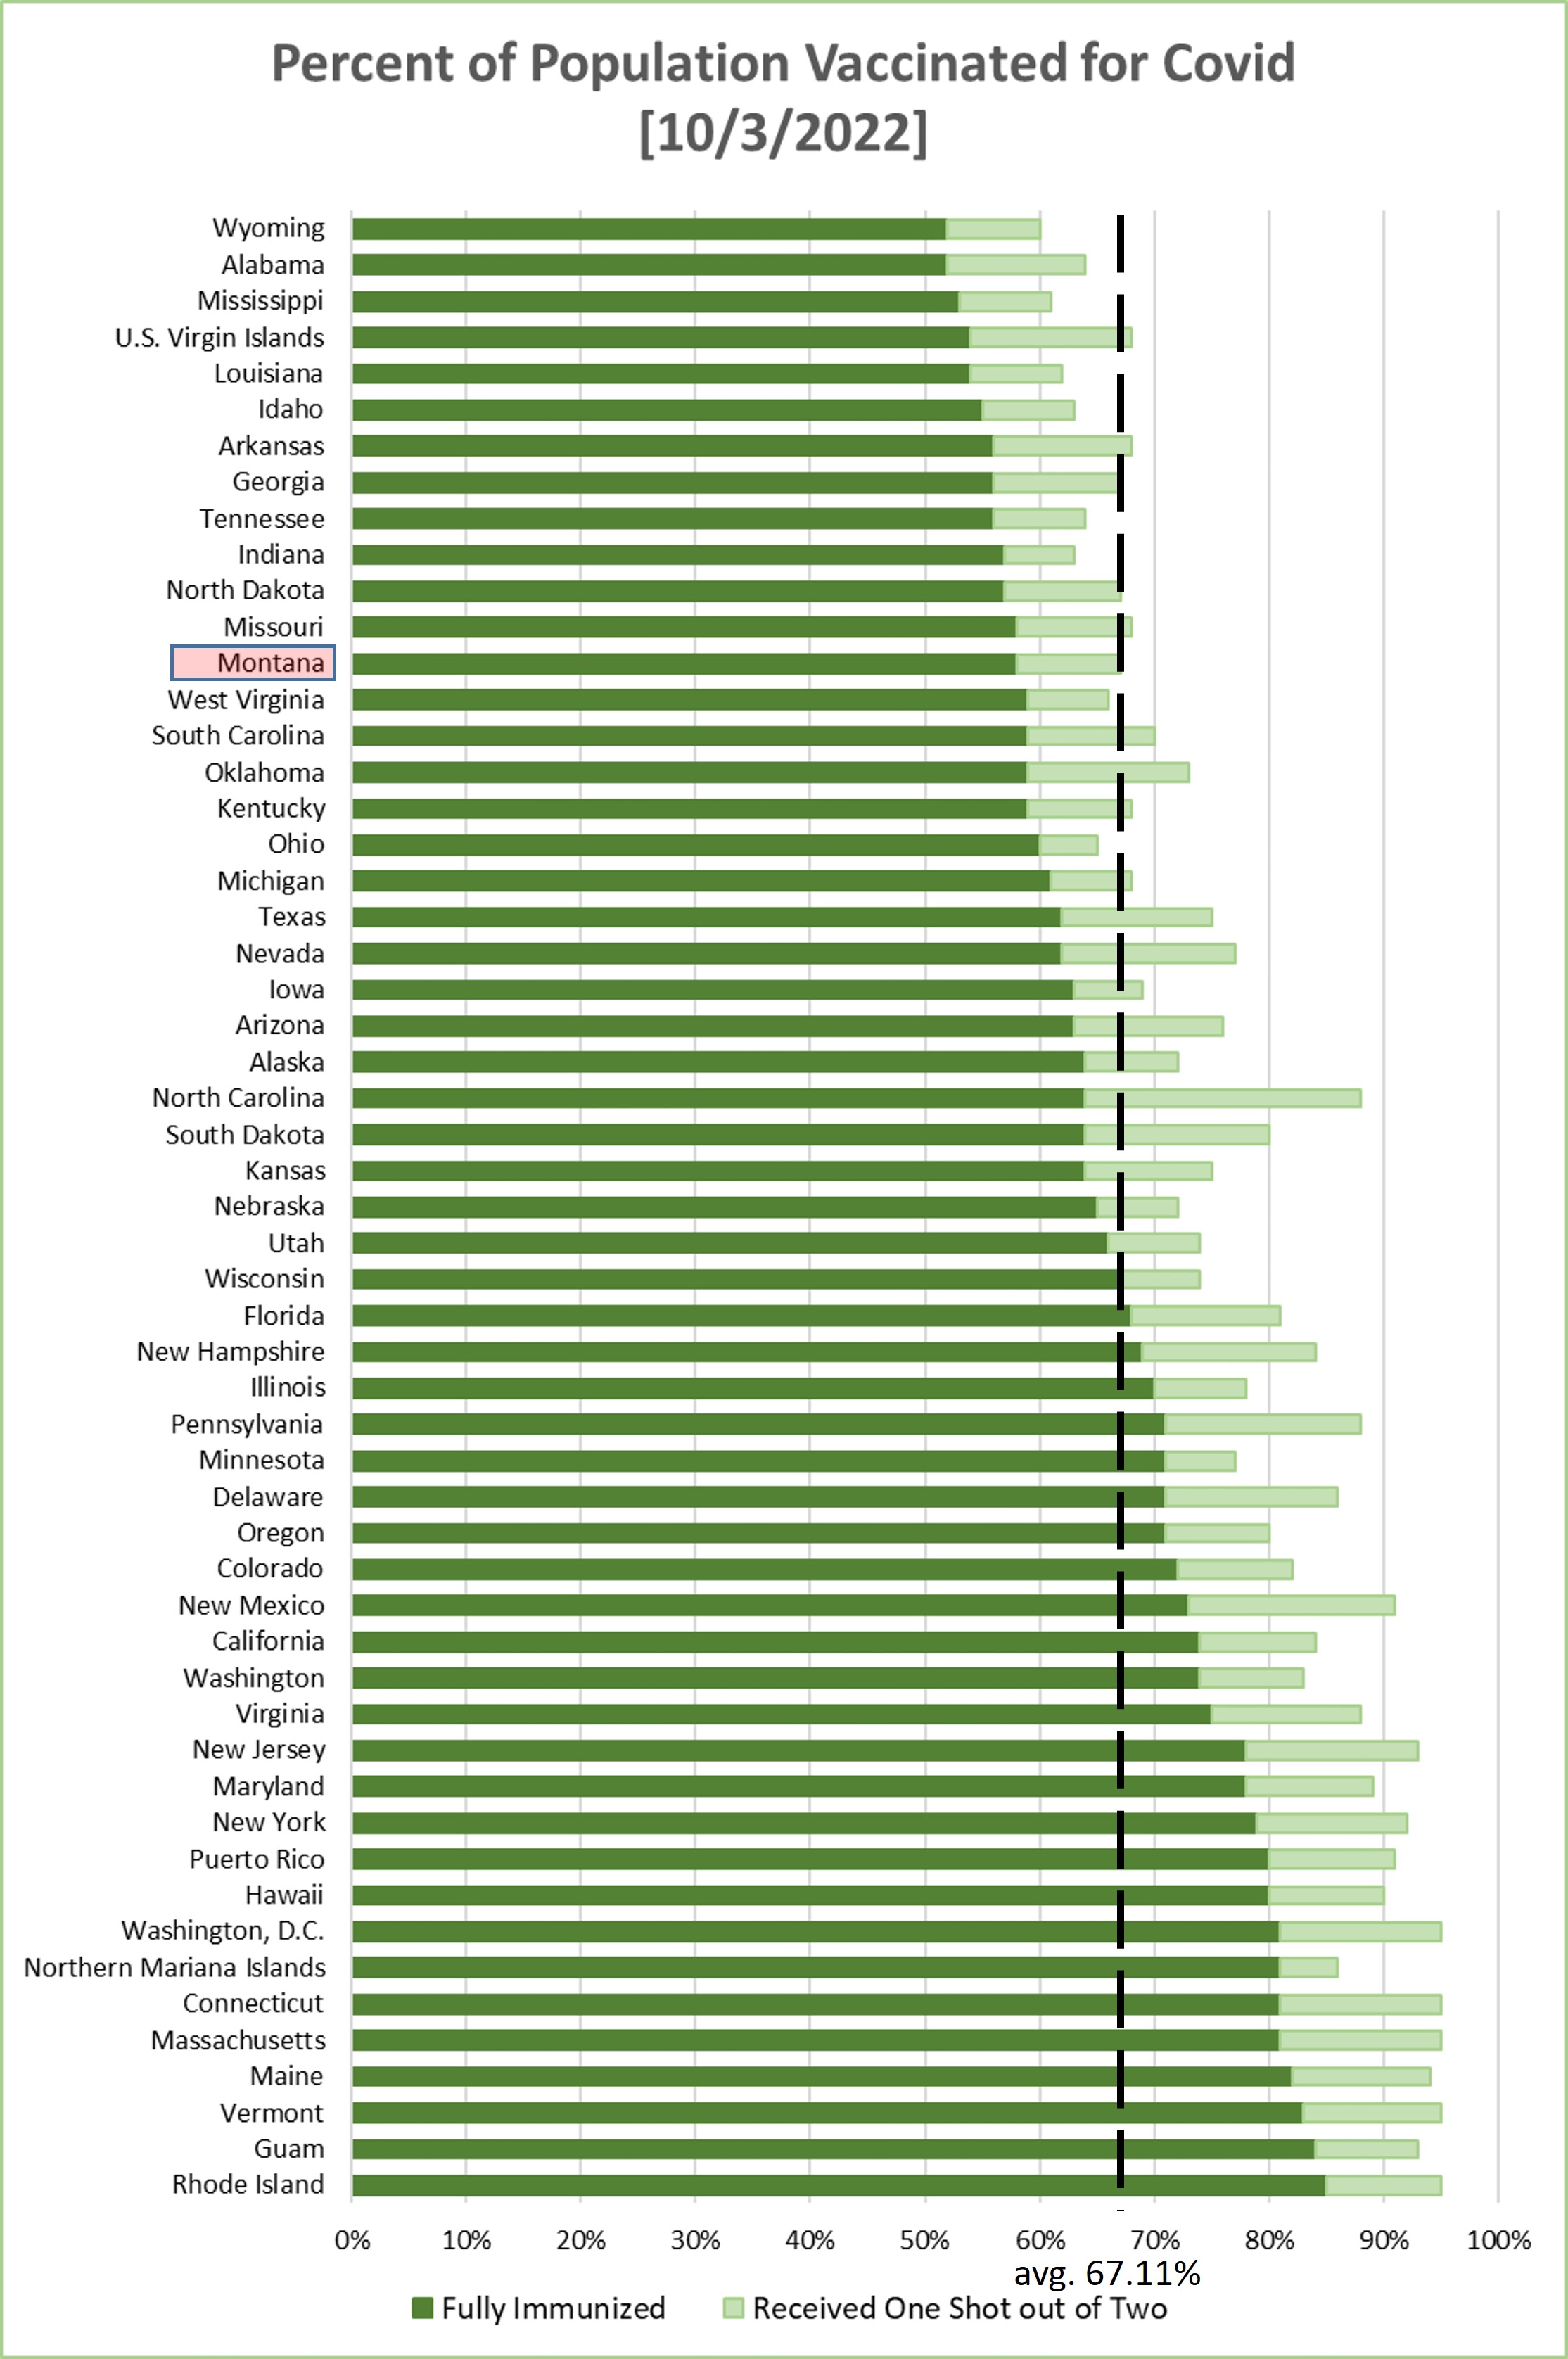
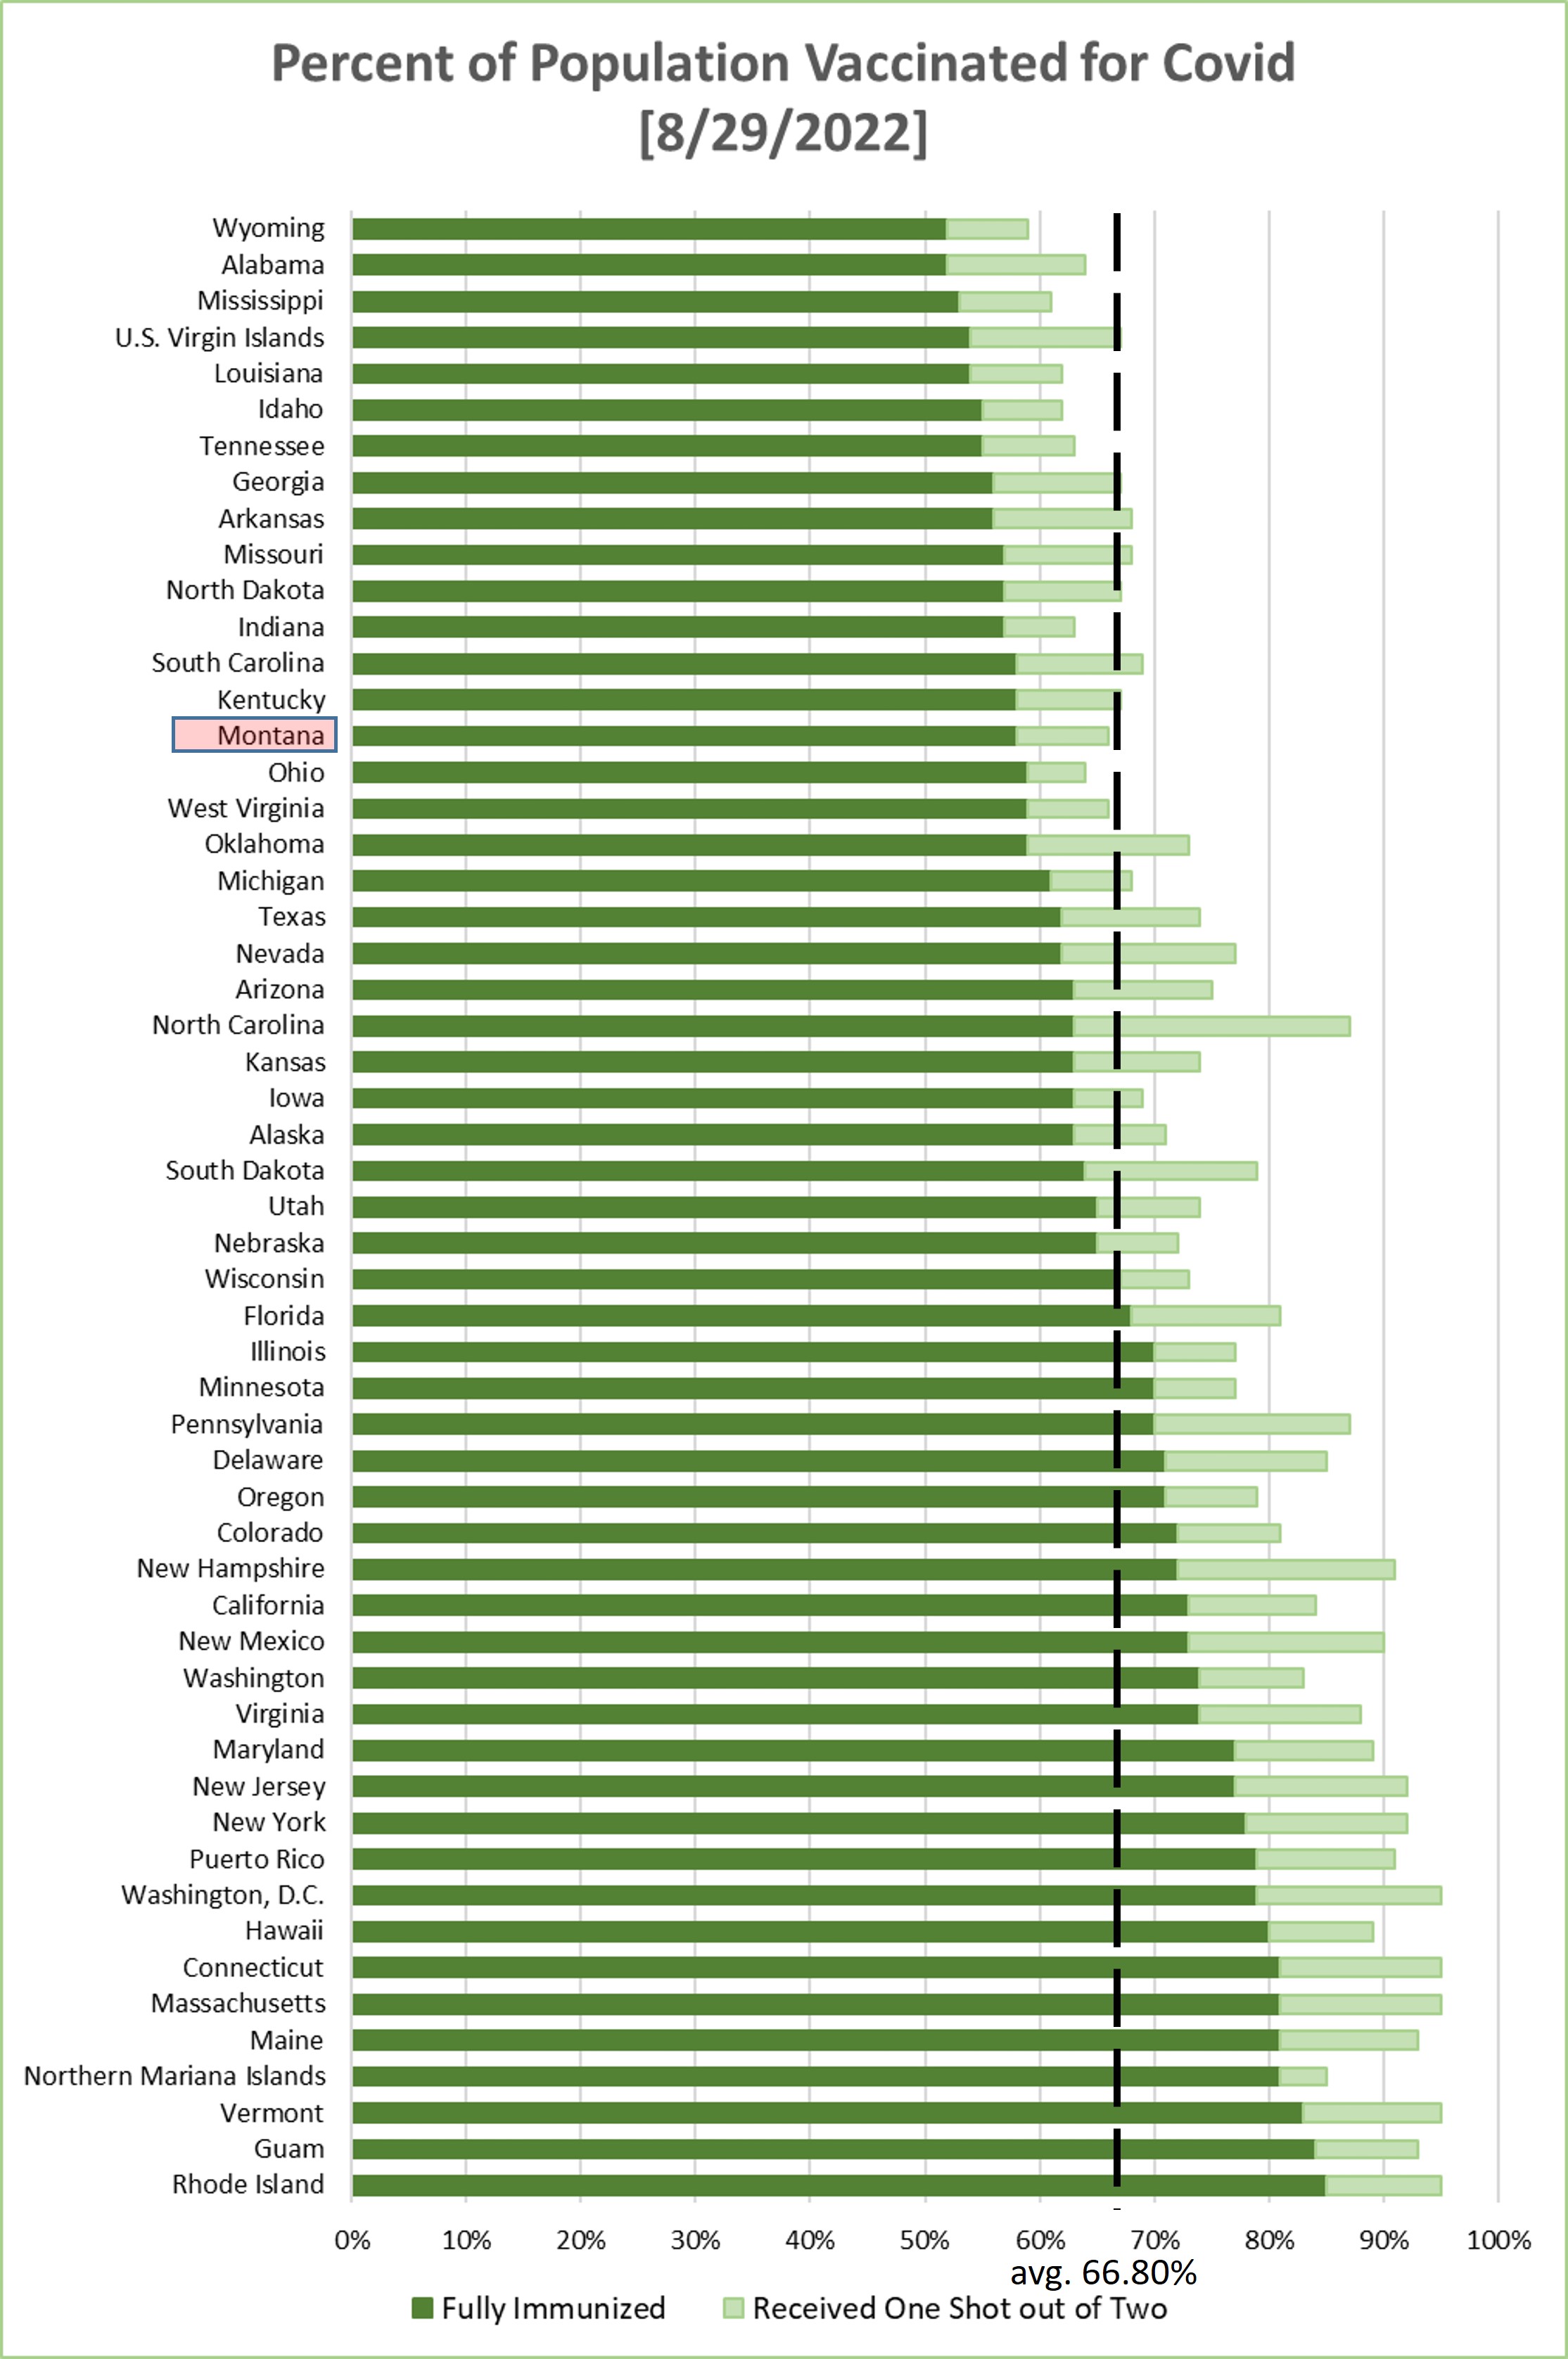
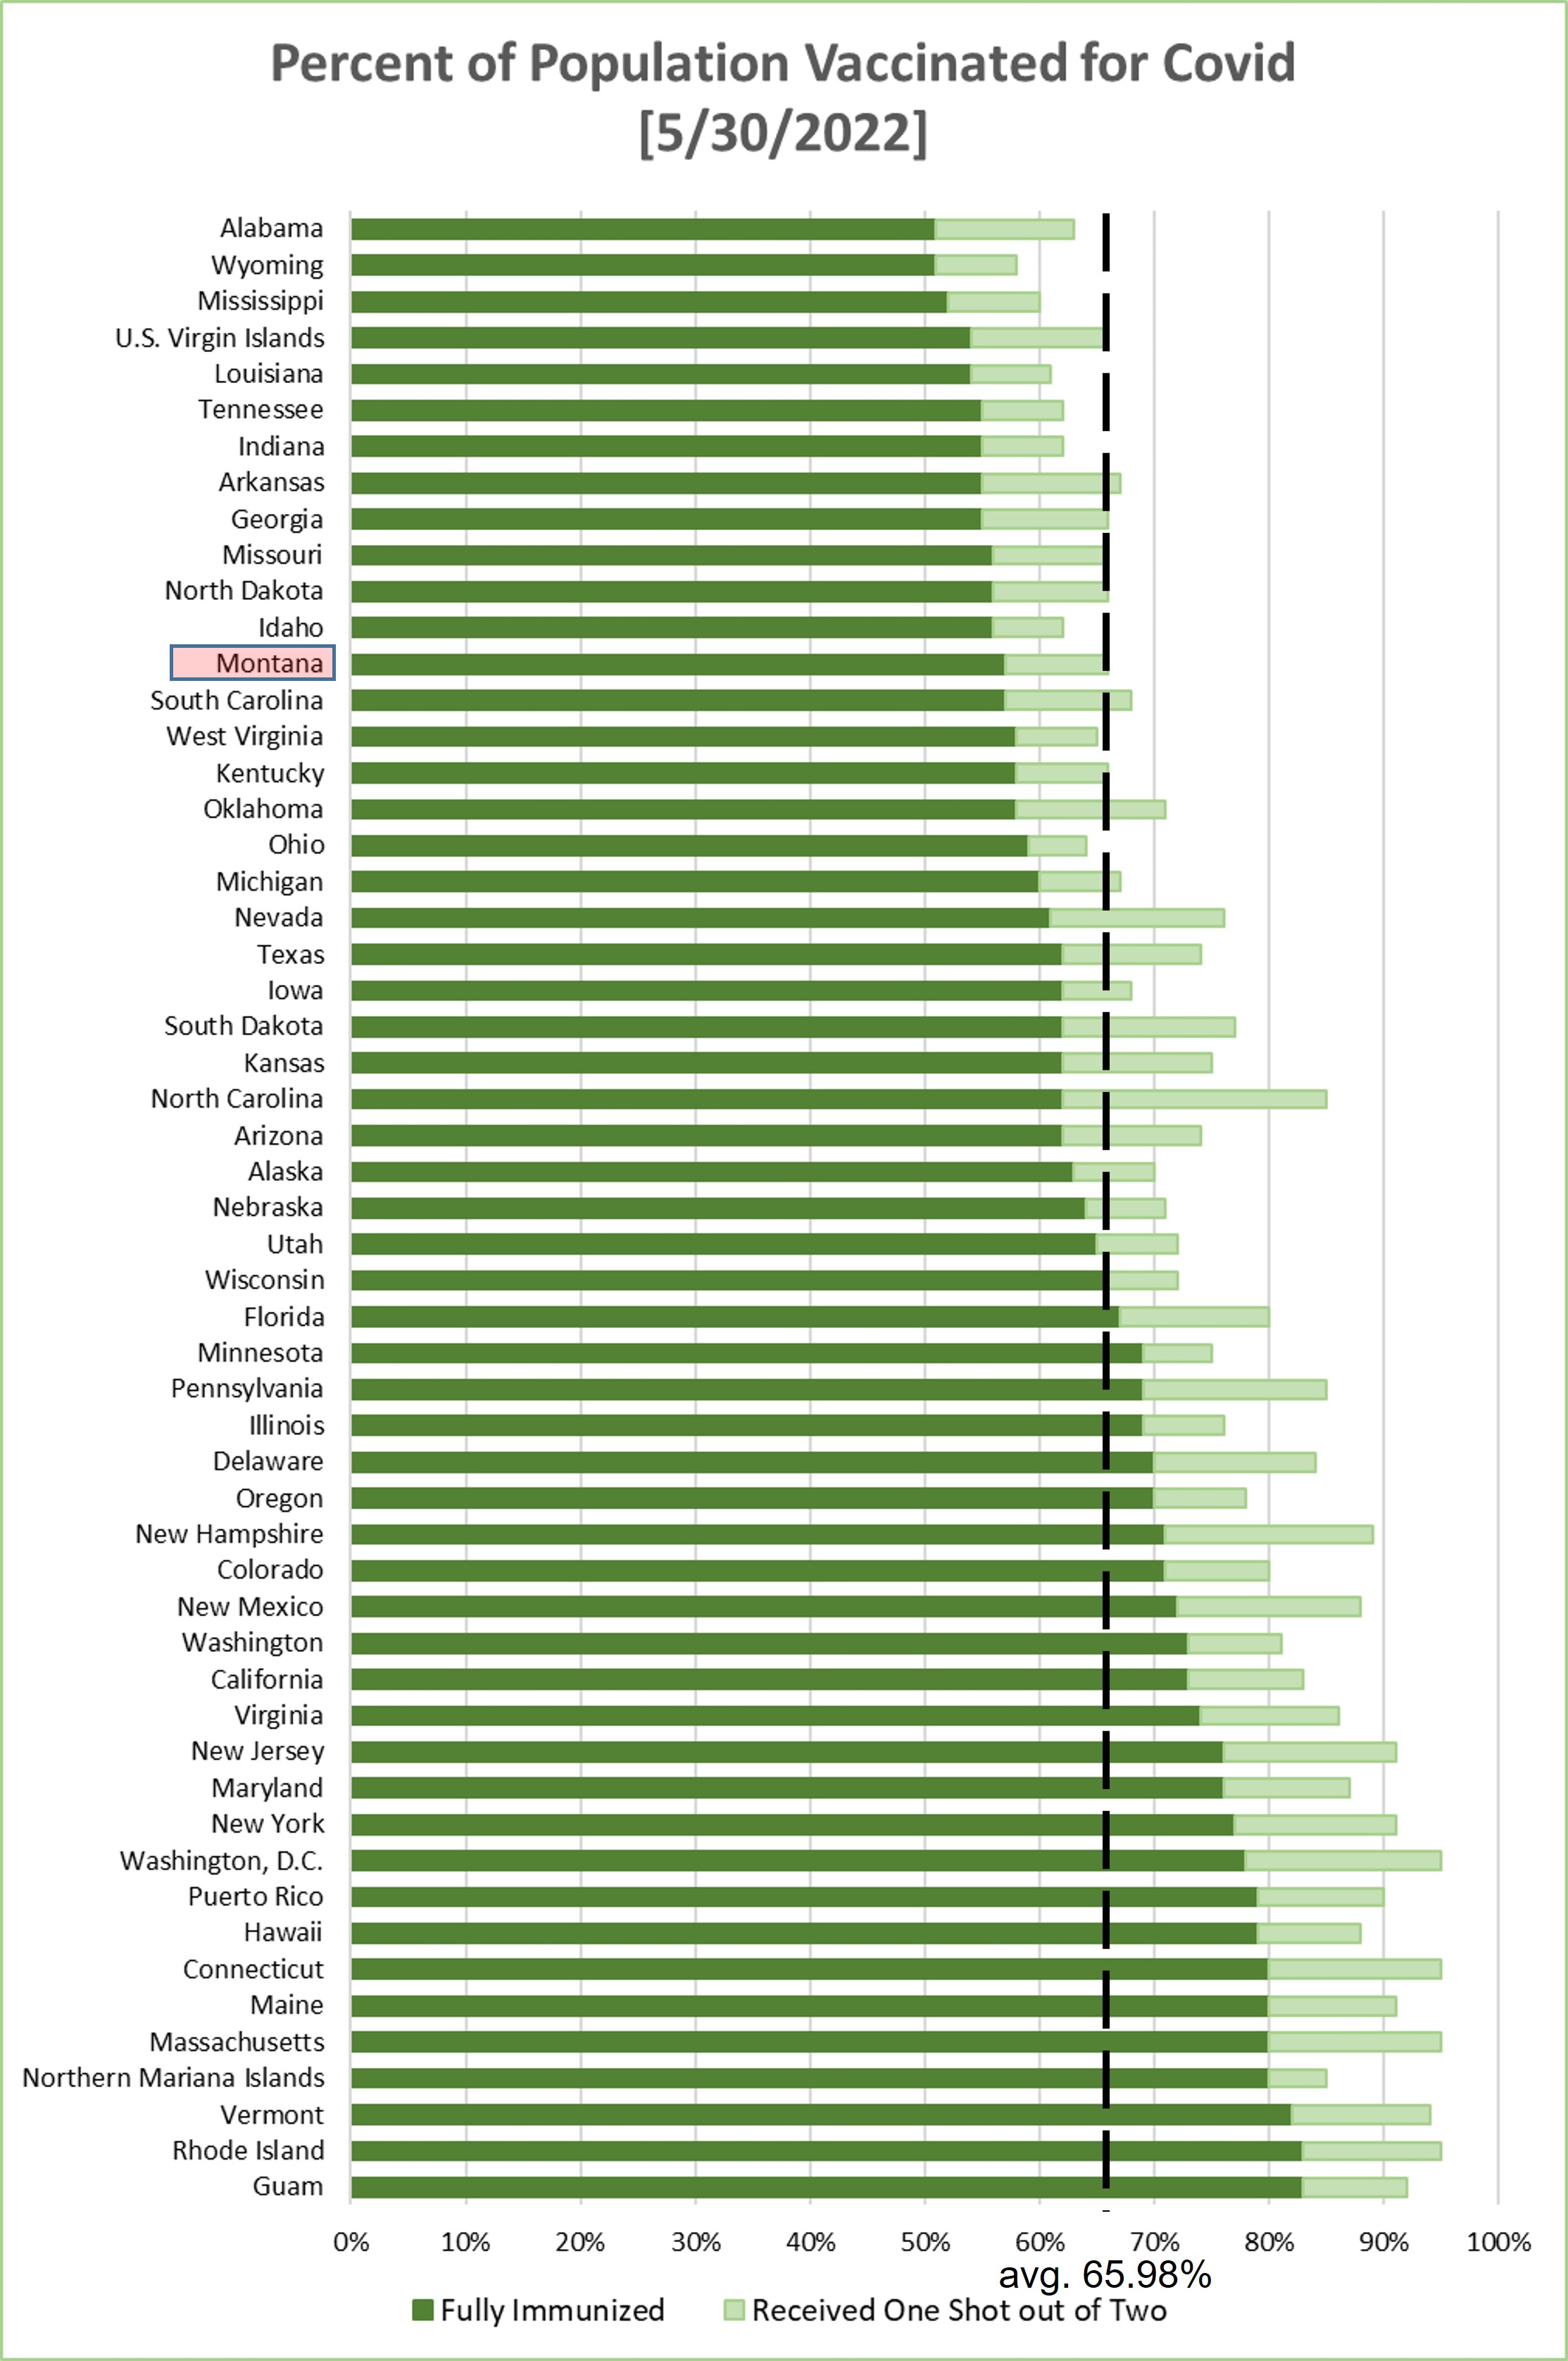
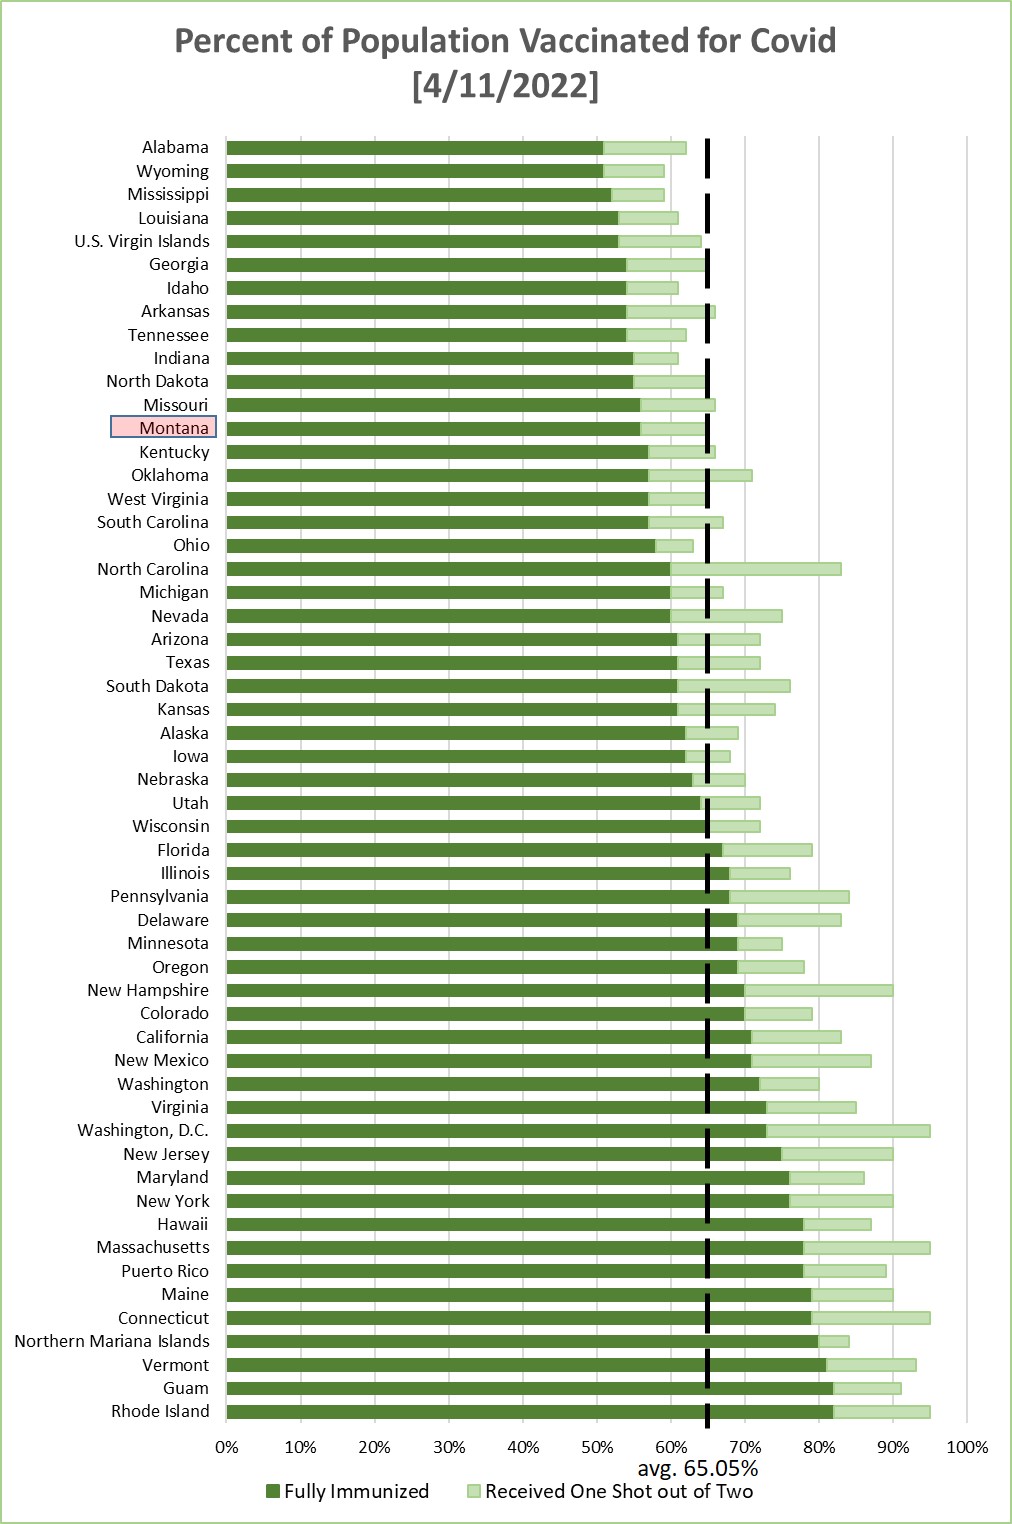
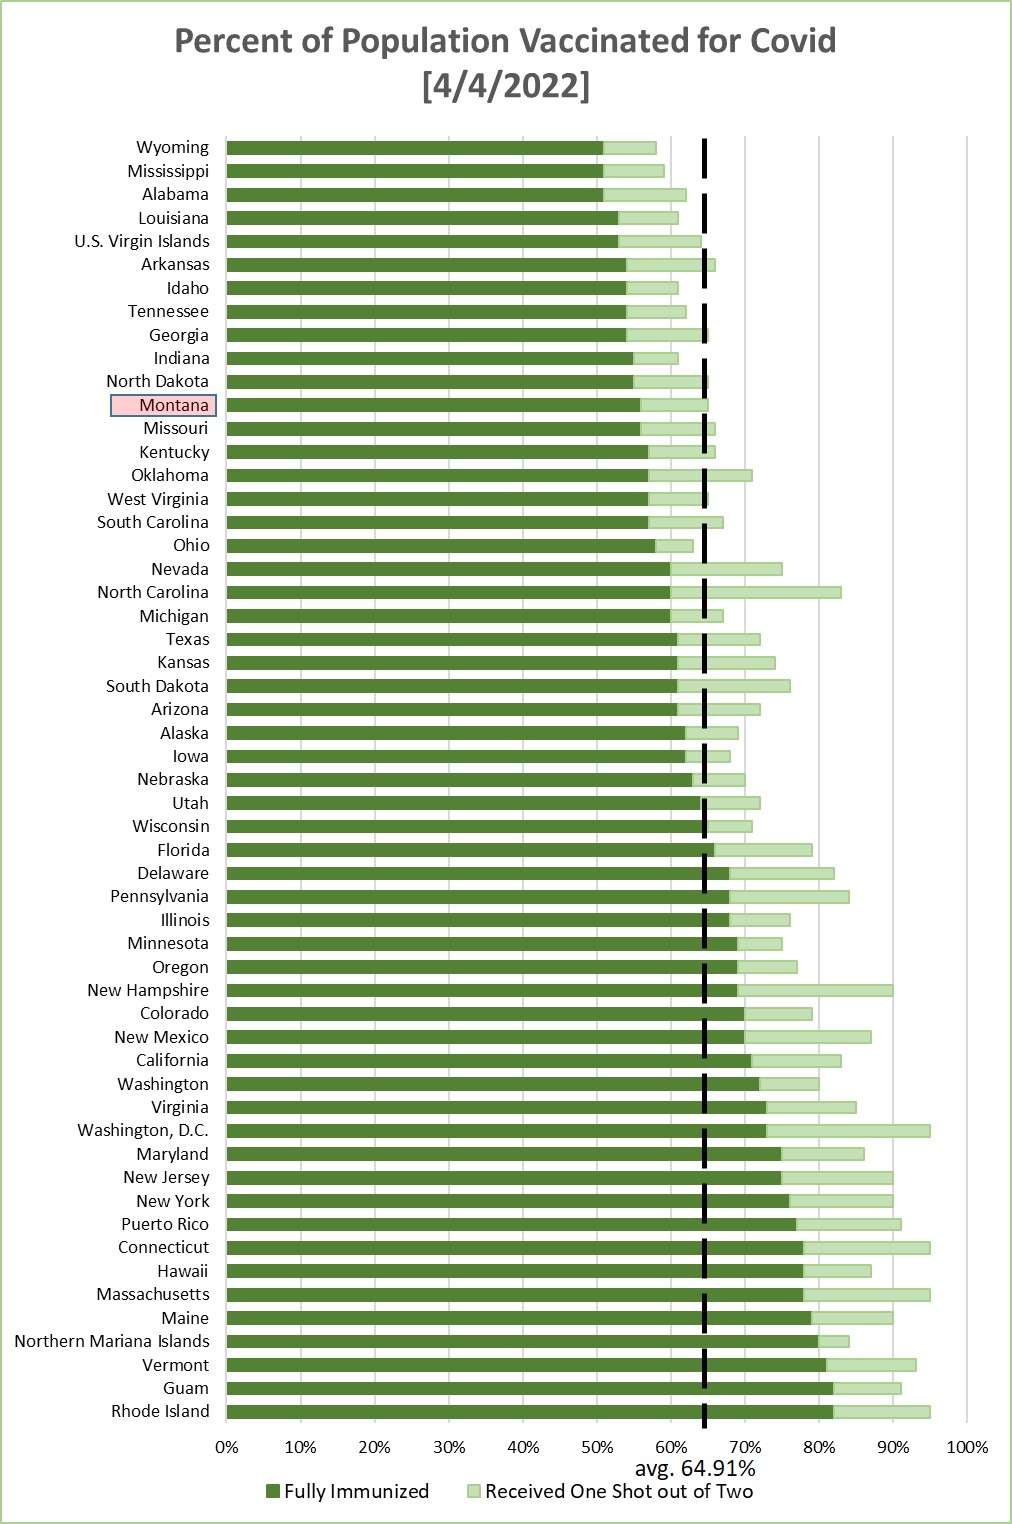
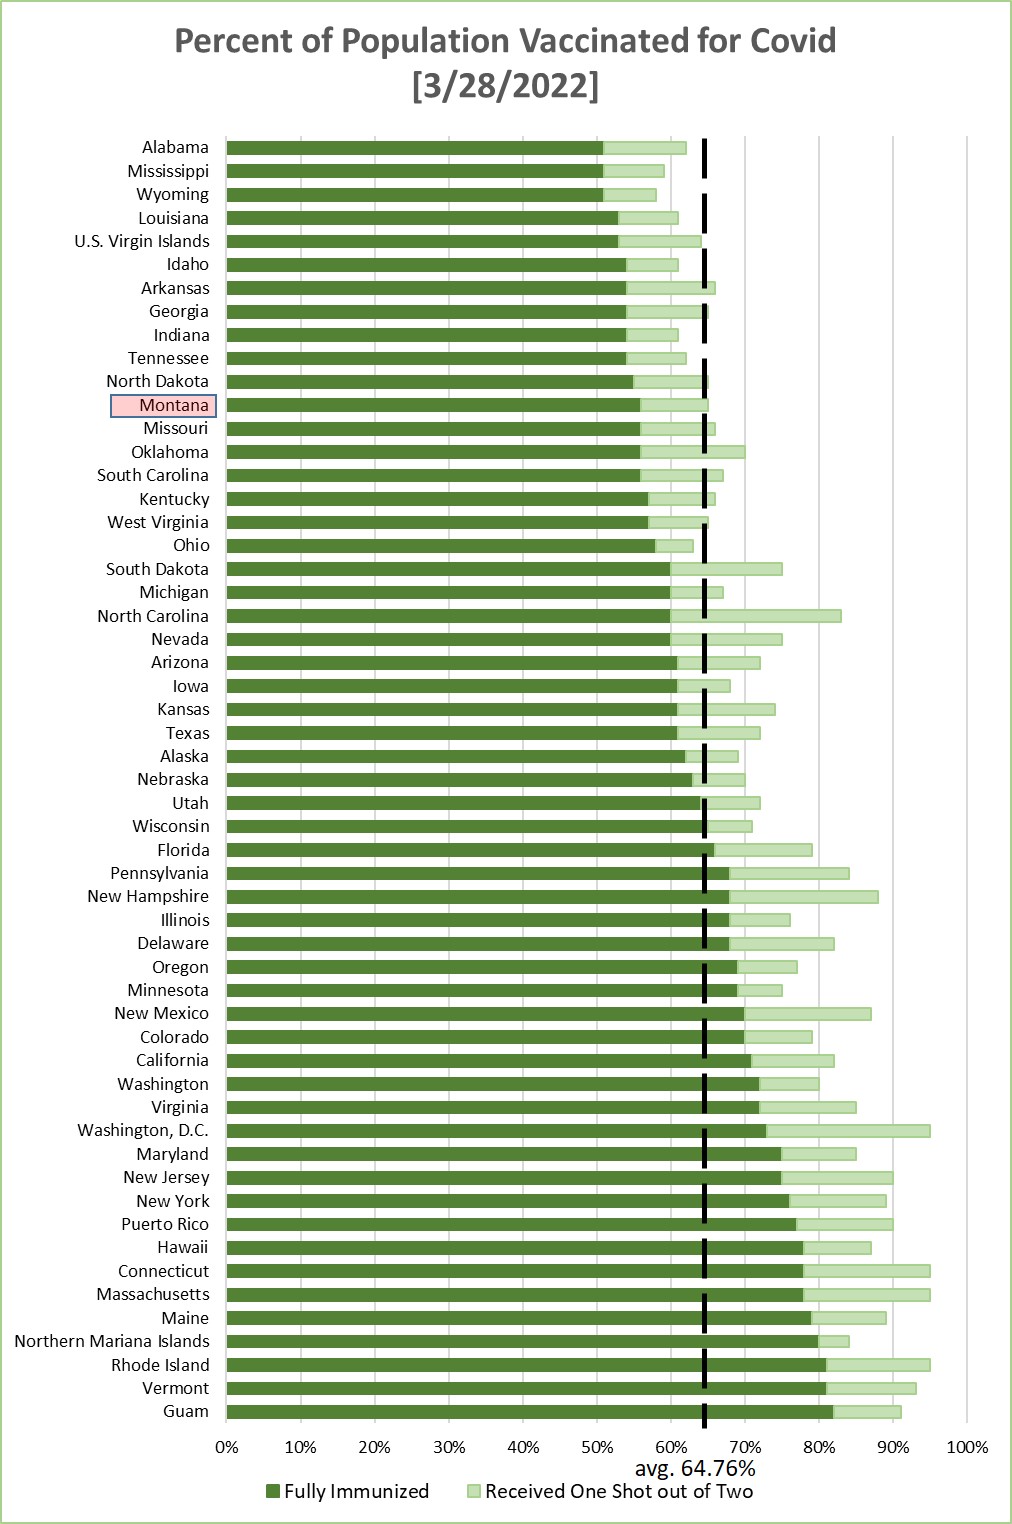
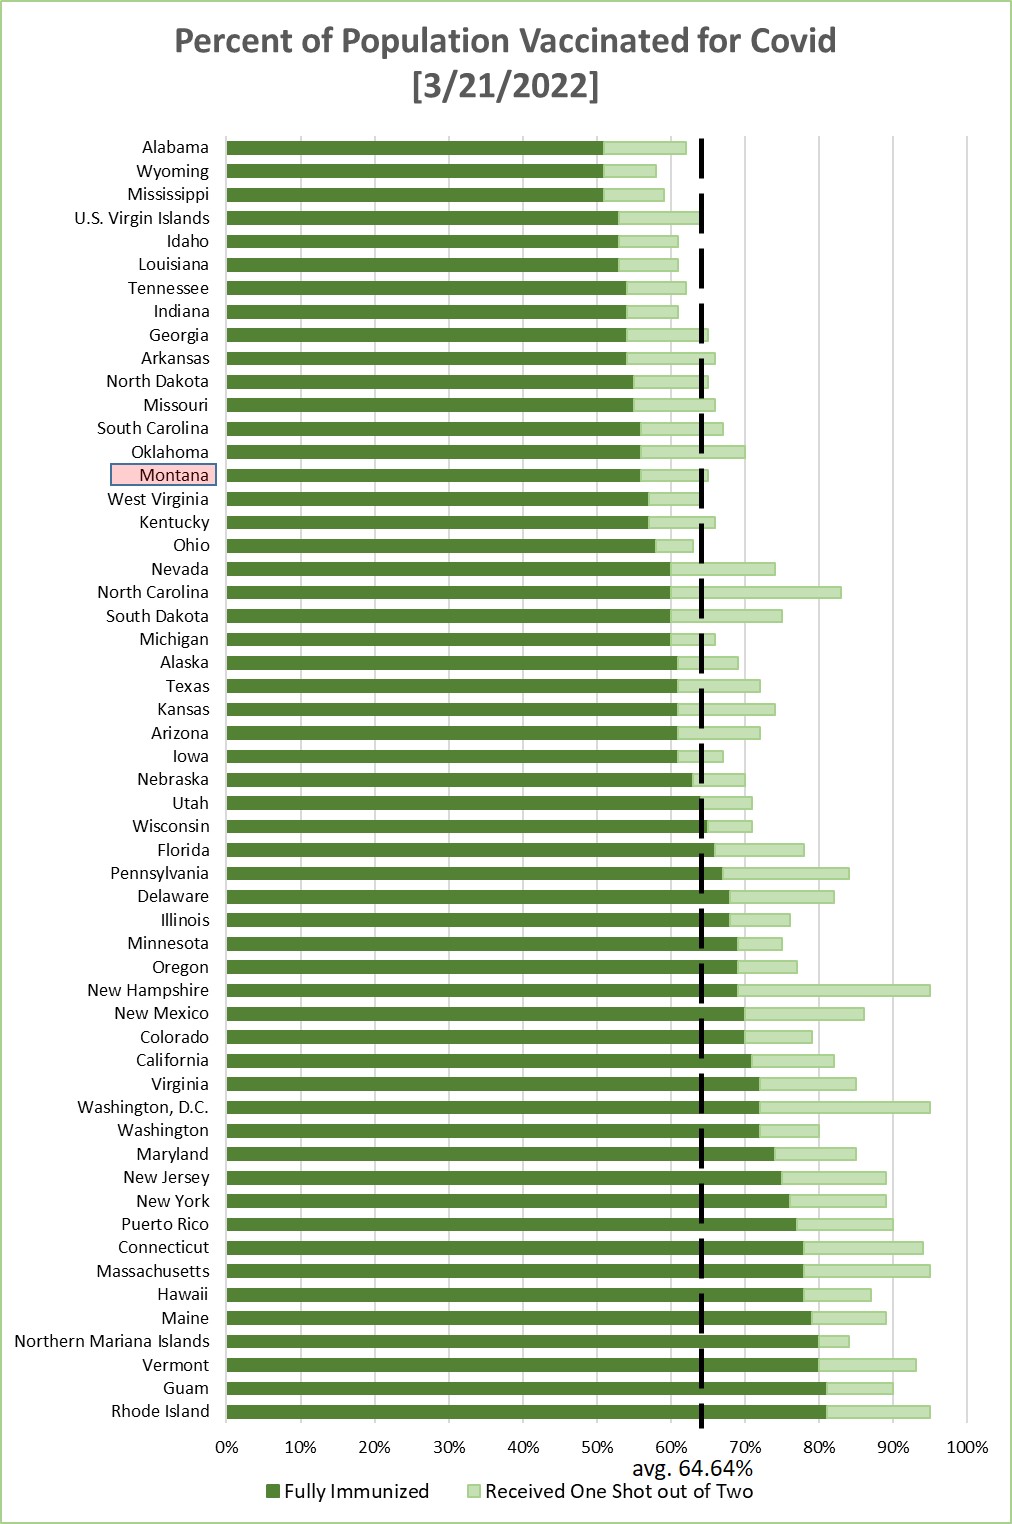
Chart 4 shows the percentage of the population in each jurisdiction having received
1 or 2 Covid-19 vaccination shots. This is sorted by the fraction that have received
2 shots--or one shot of the J&J vaccine. Average across the 55 jurisdictions is 63.33%
being fully immunized, for a weekly increase of about 0.33% (weekly increase the prior
week was 0.45%).

Monday, January 31, 2022
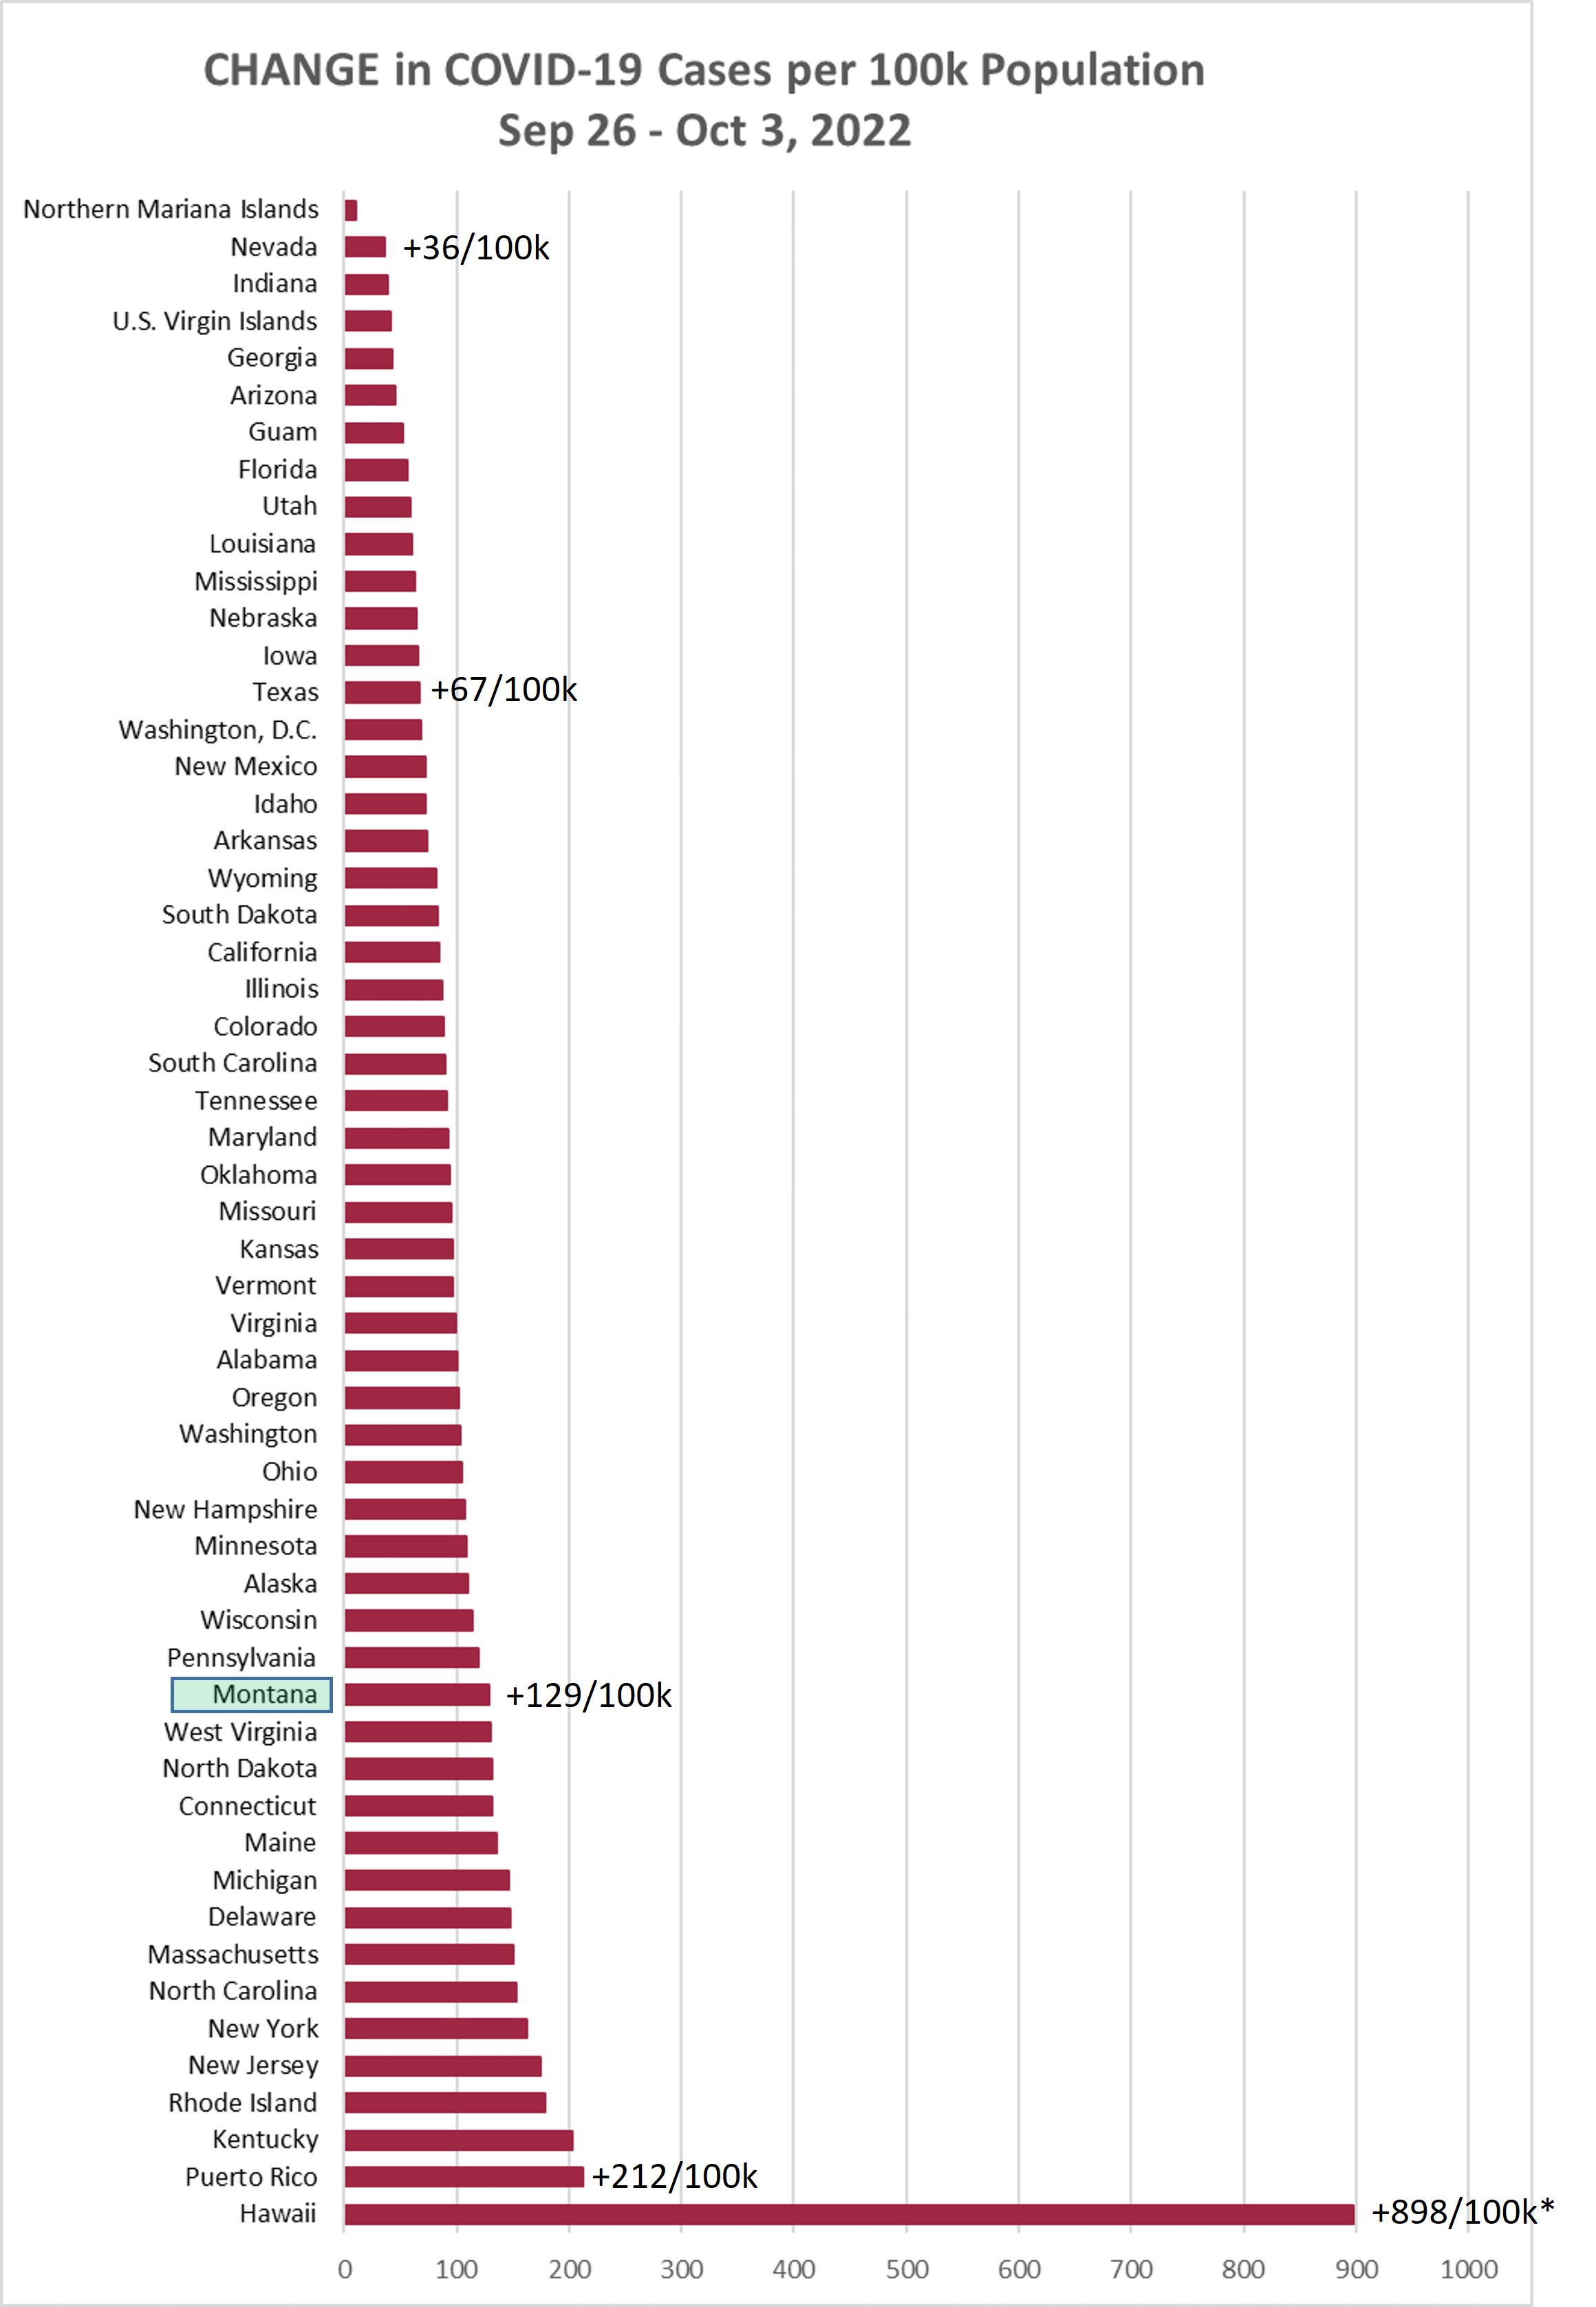
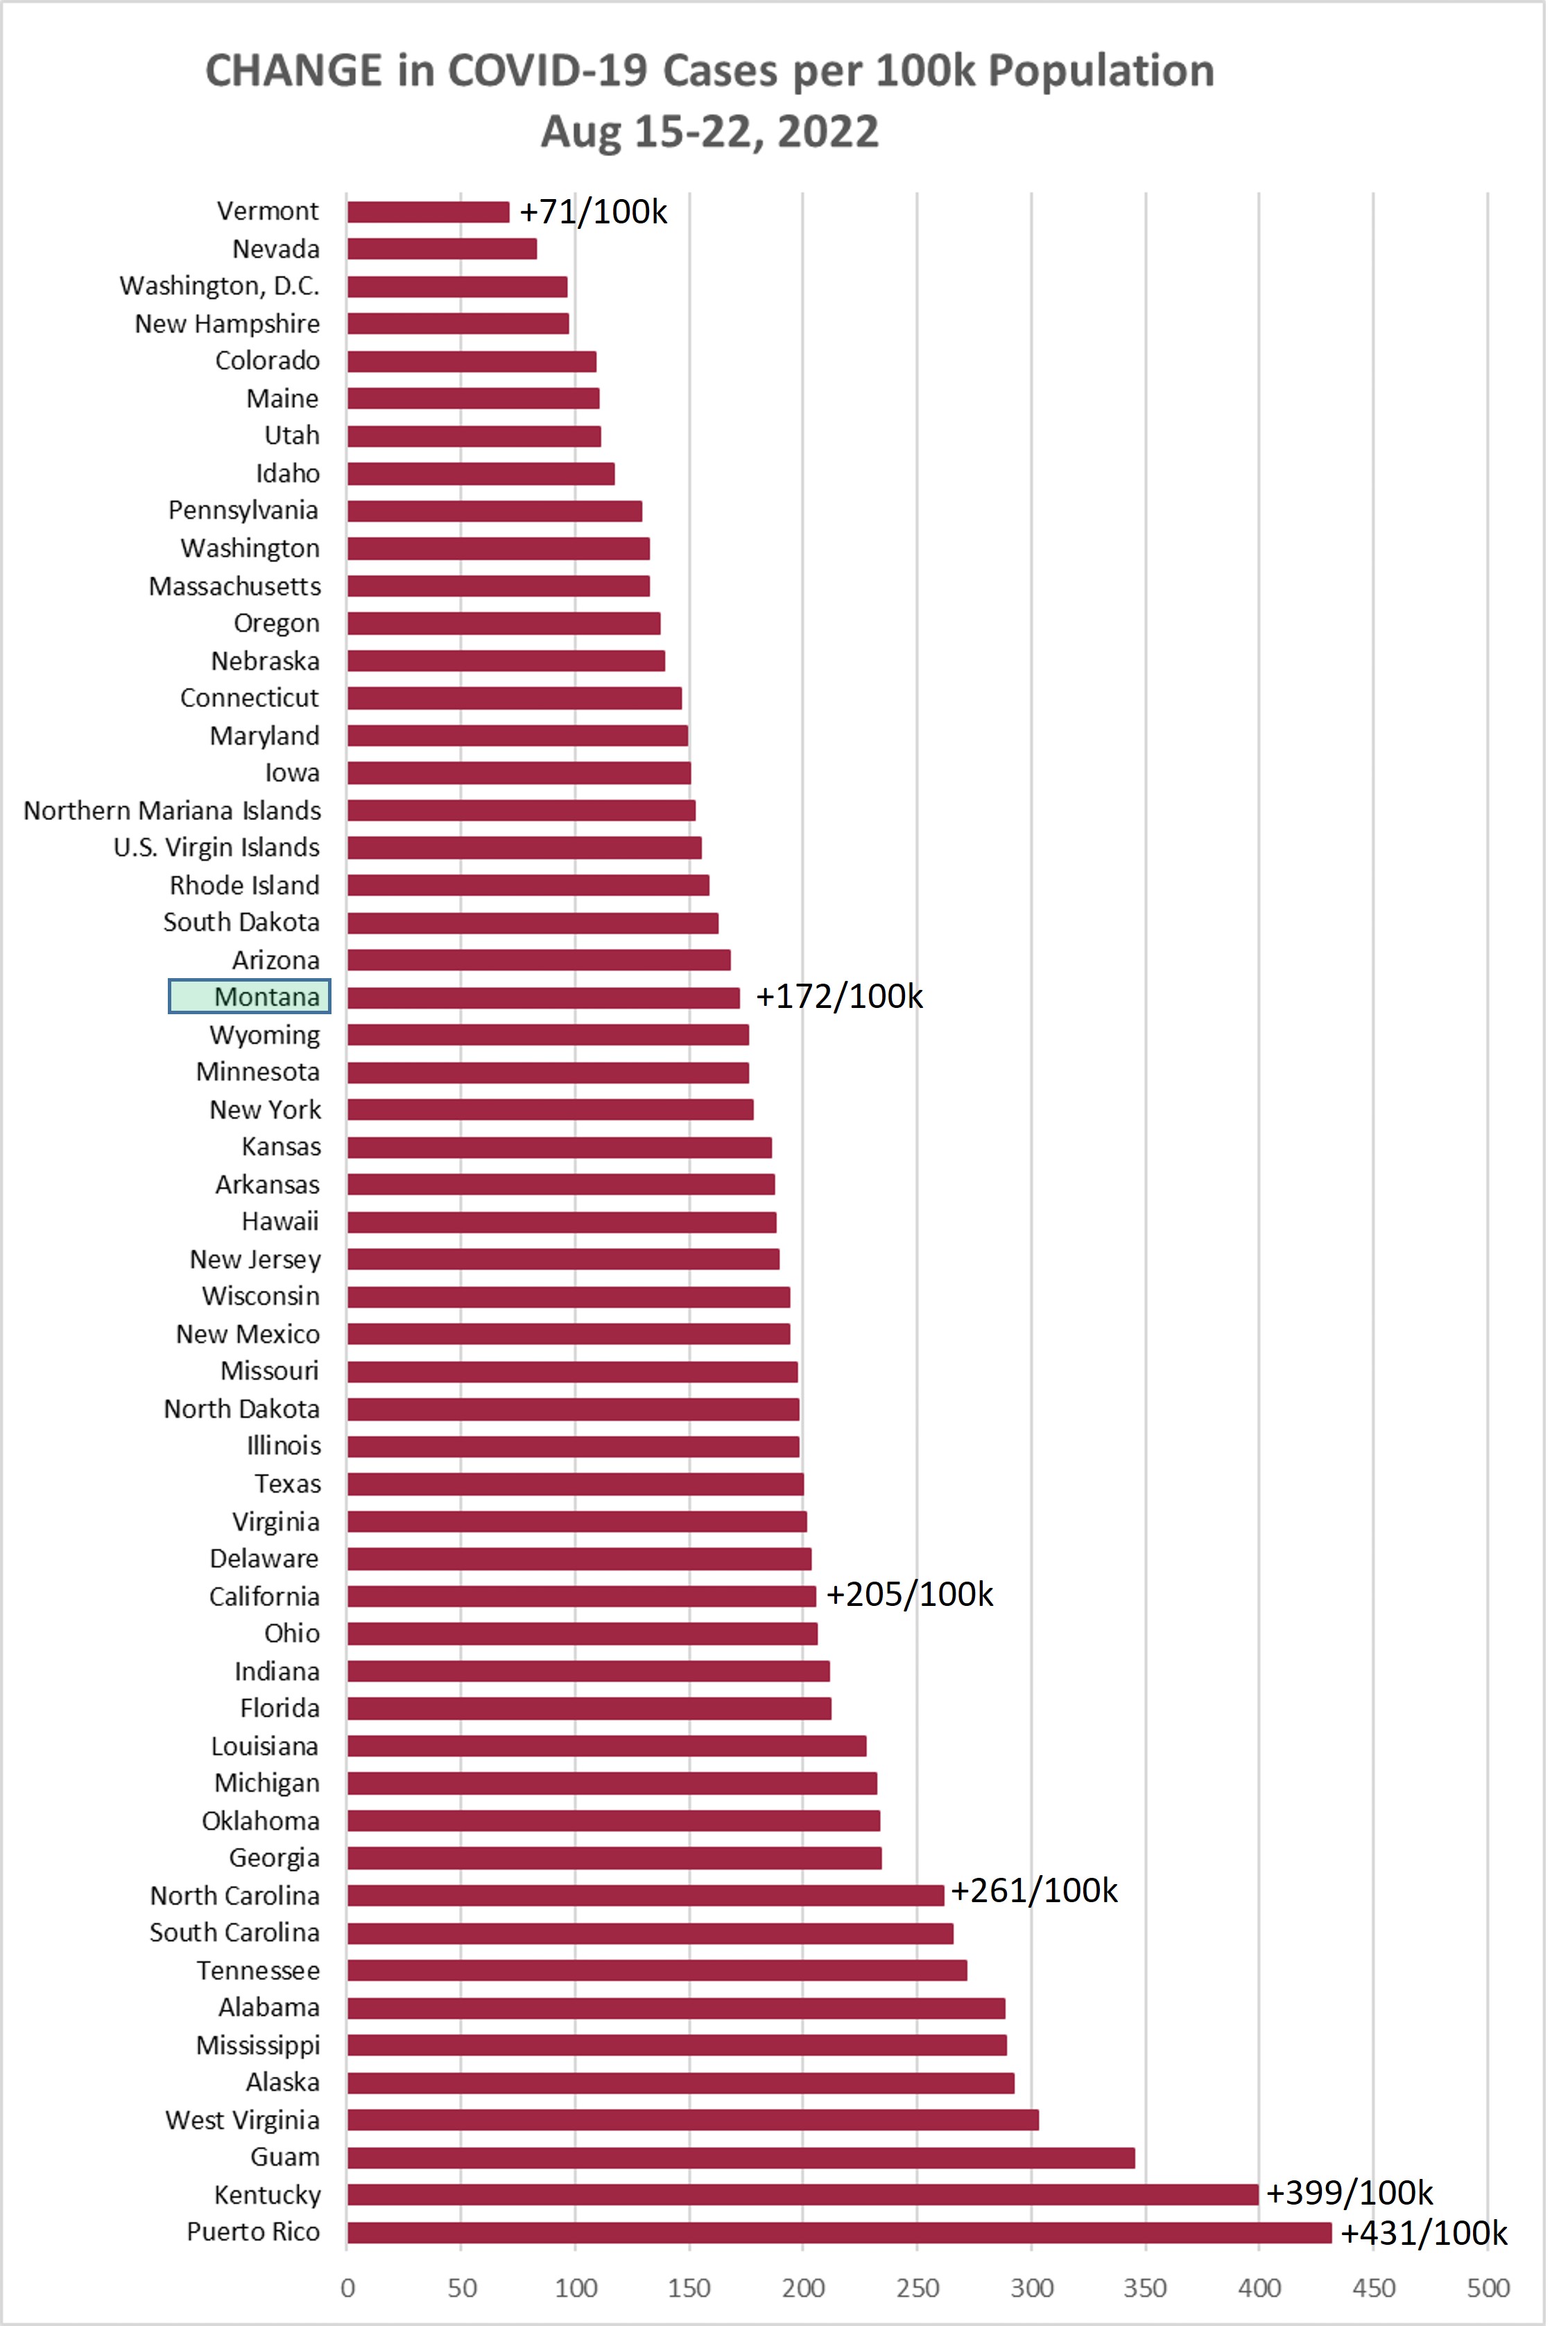
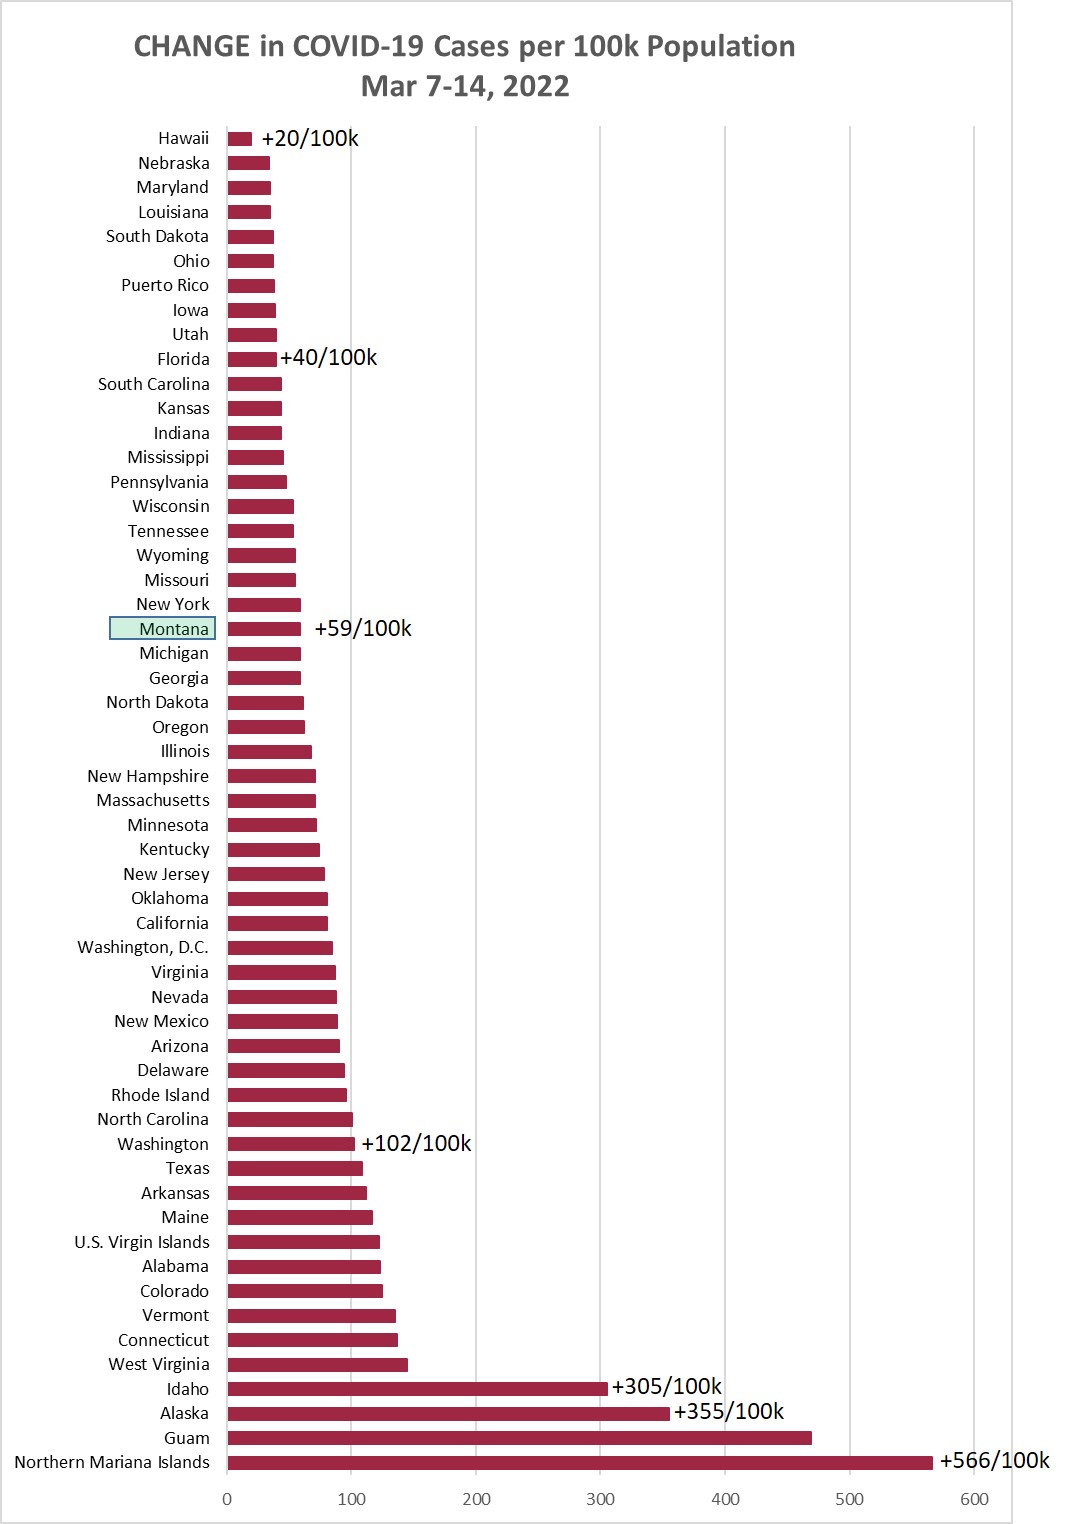
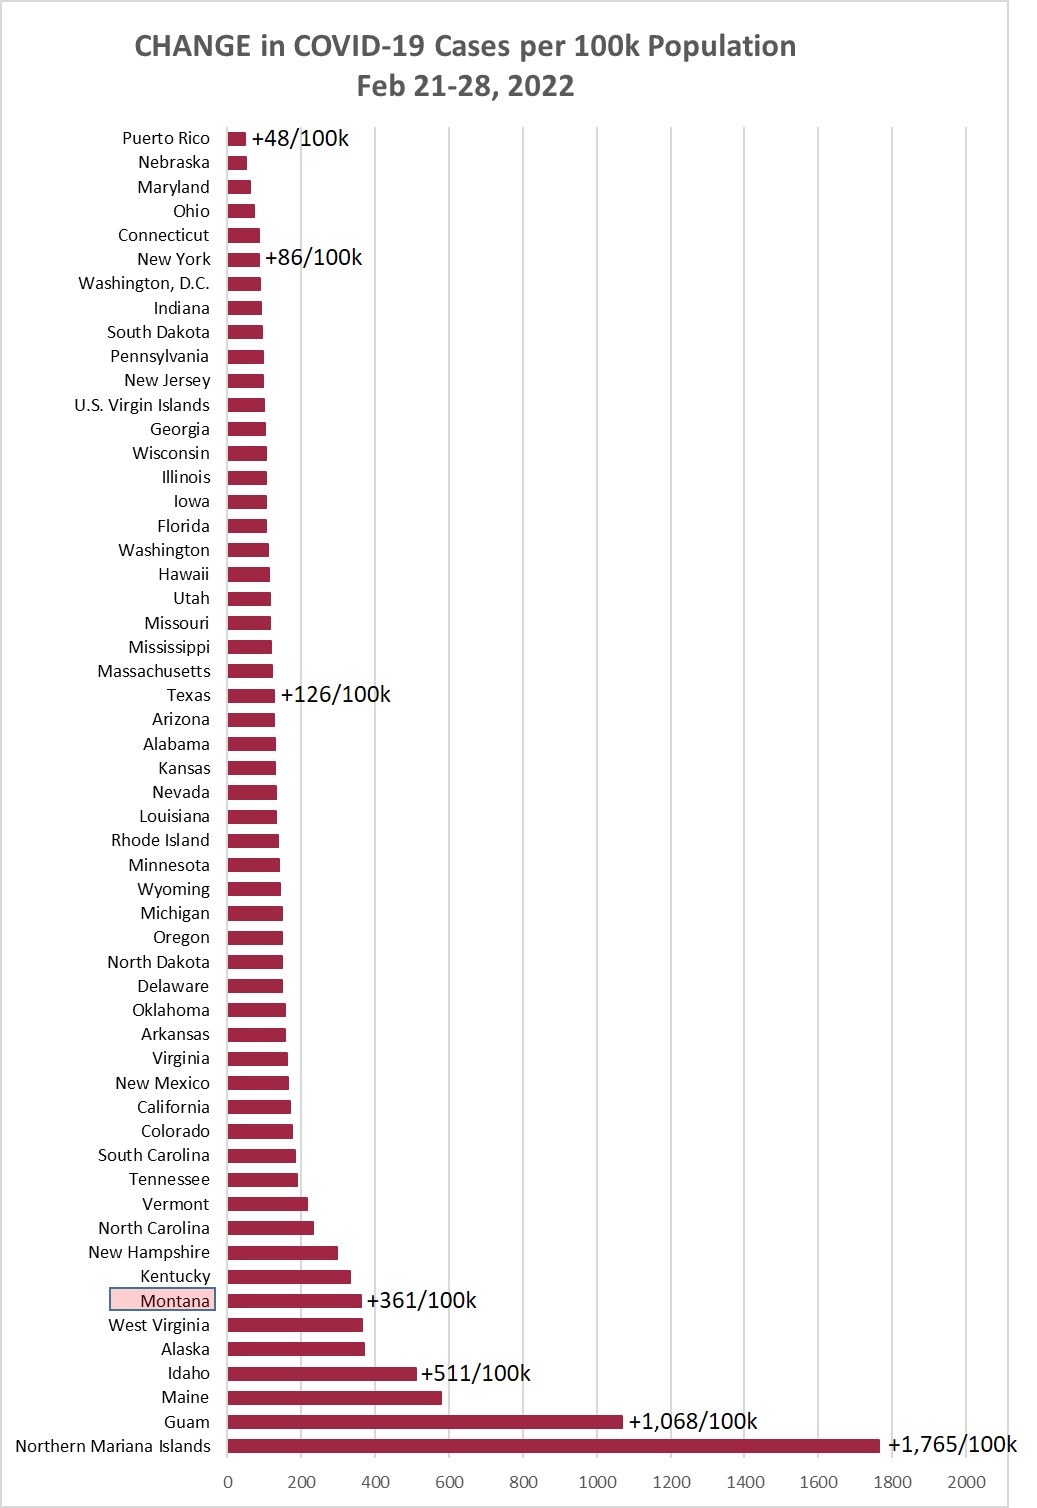
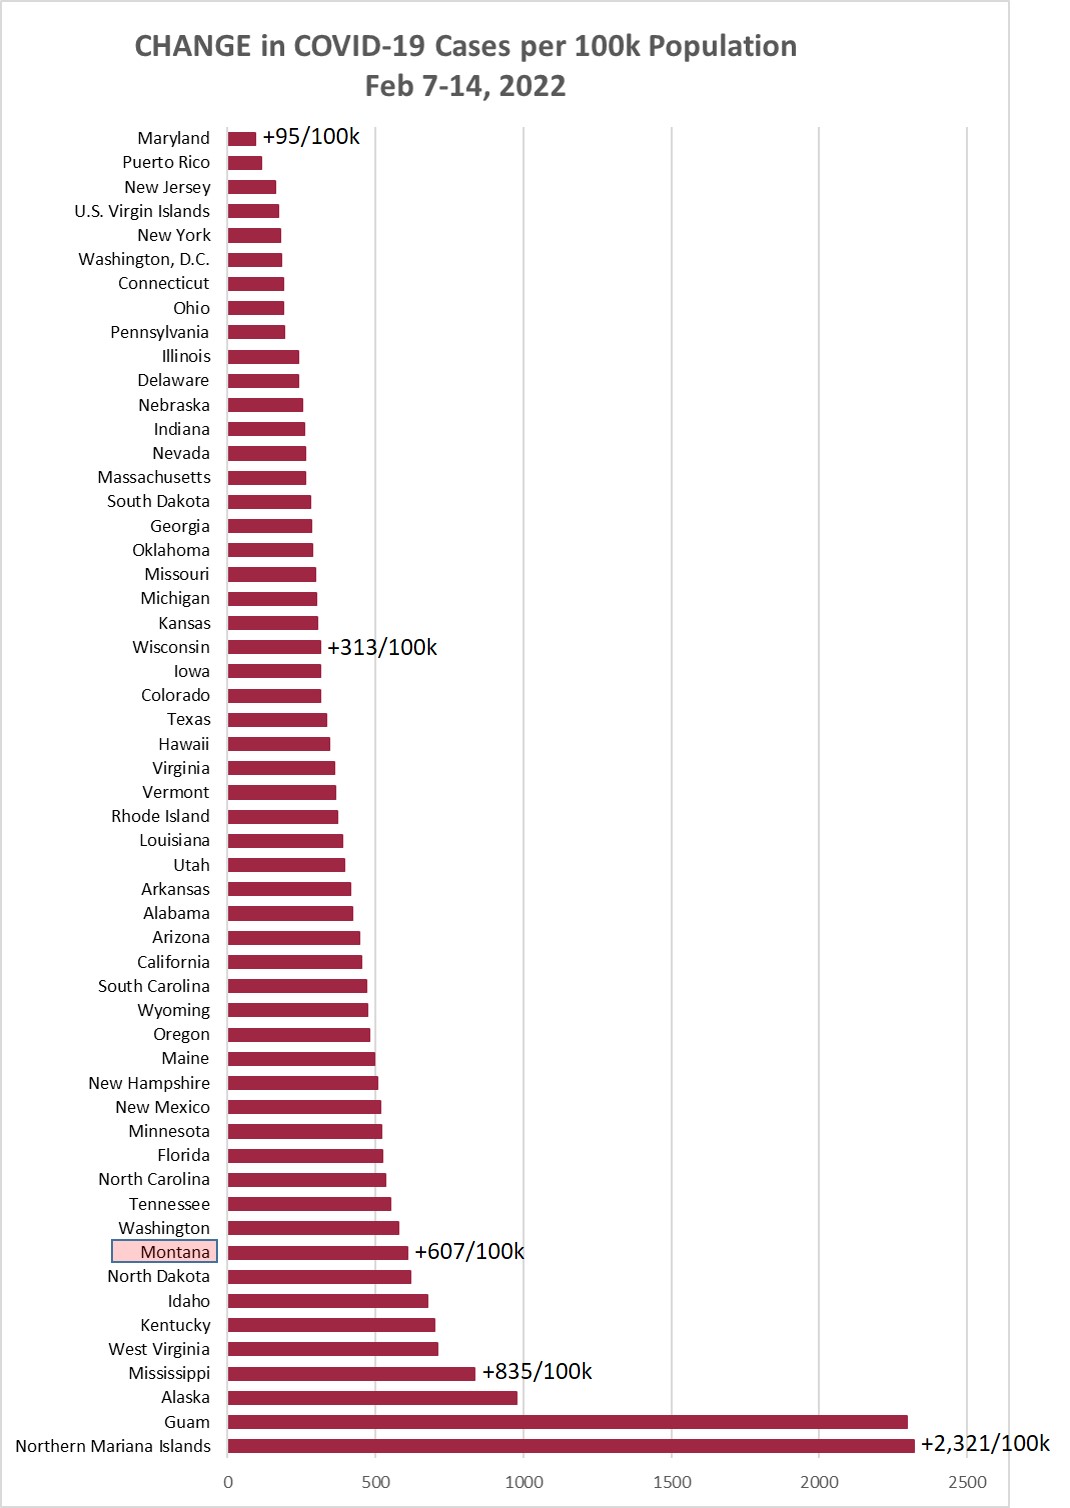
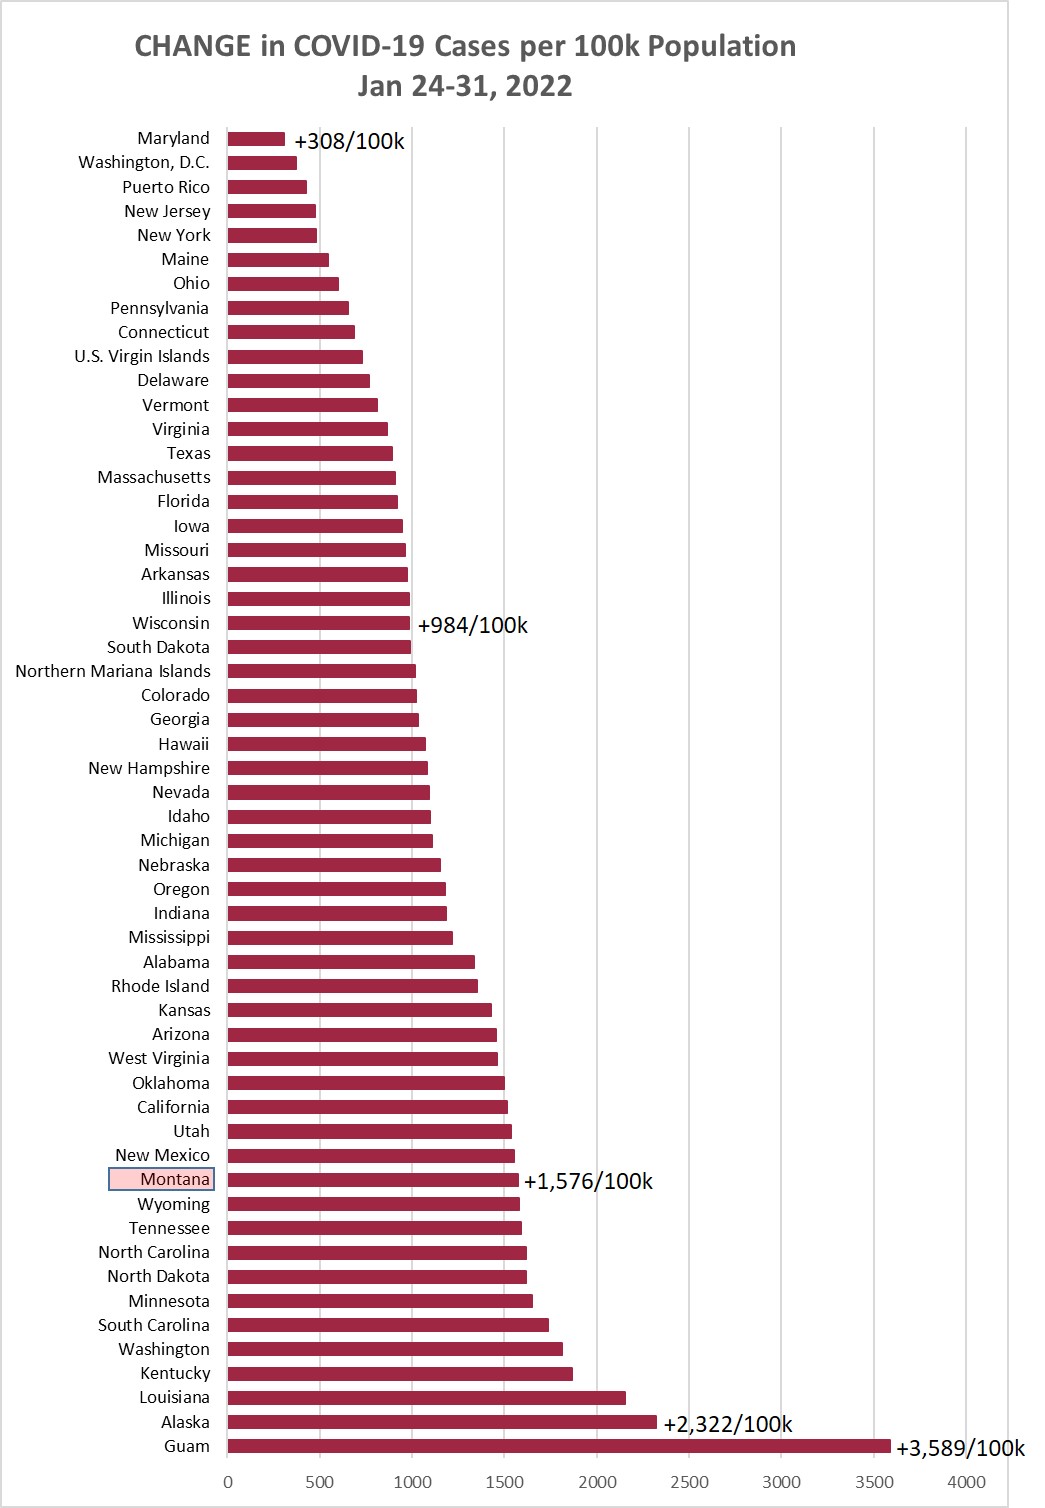
Chart 1 shows the change in cases per 100,000 population as of this morning (January
31, 2022) compared to the cases per 100,000 on January 24, 2022. Montana was up a
record +1,576/100k this week, compared to +947/100k the prior week, and +879/100k
the week before that.
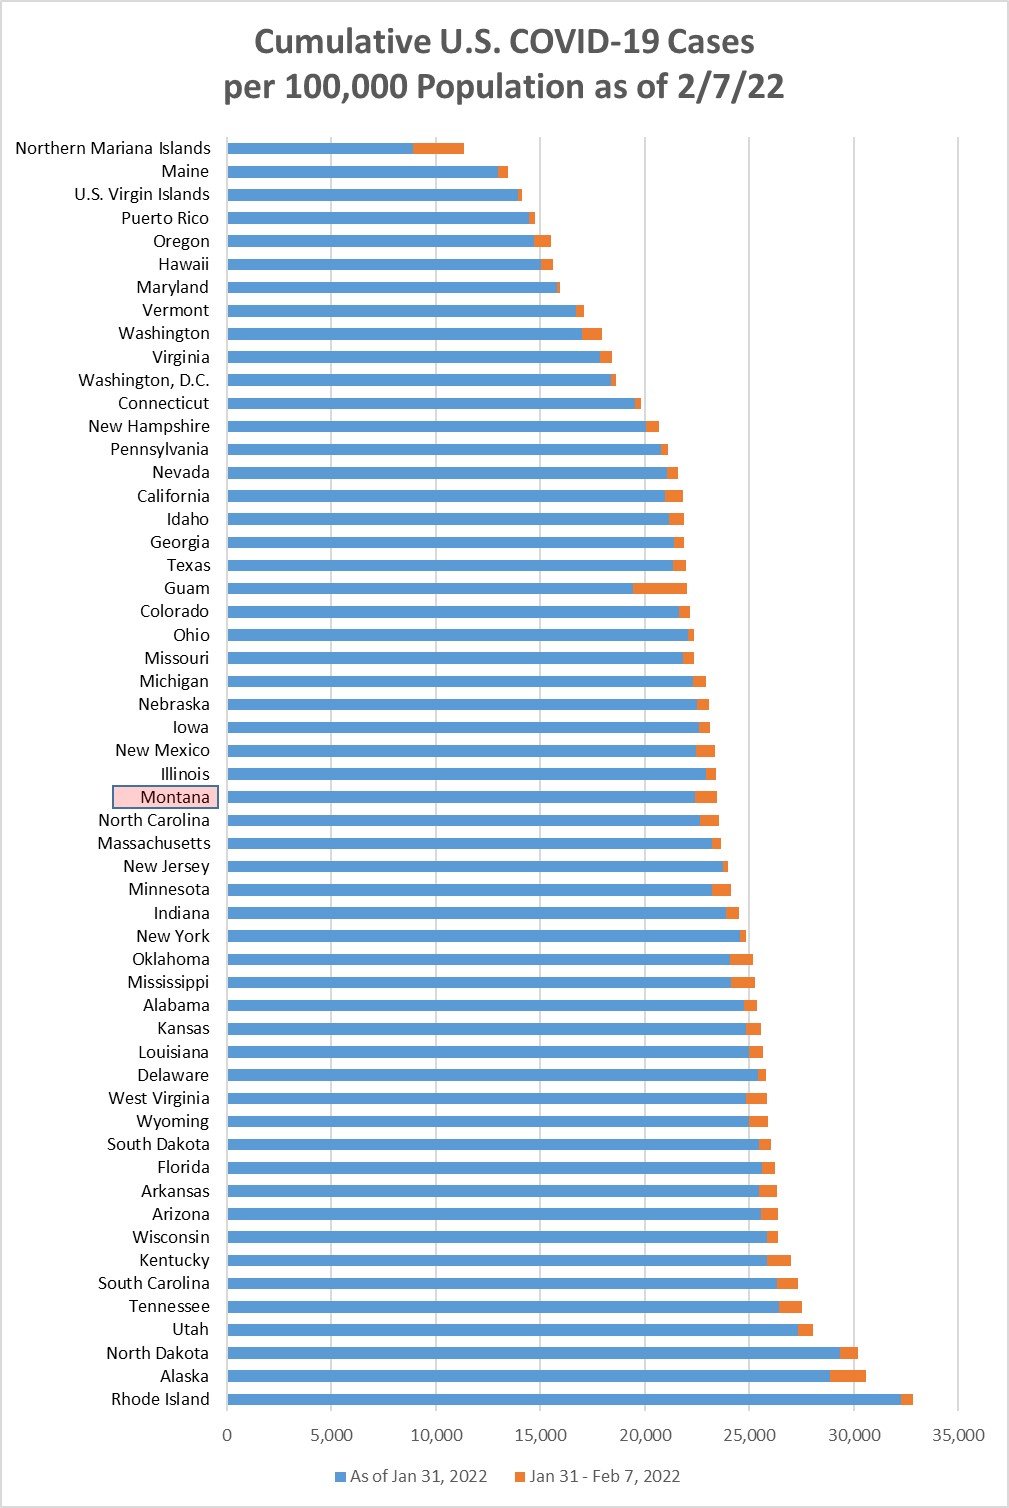
Chart 2 shows the same information as Chart 1, but with the overall cumulative cases
per 100k in each state to January 31. Montana moved up from position 34 to 31 this
week.
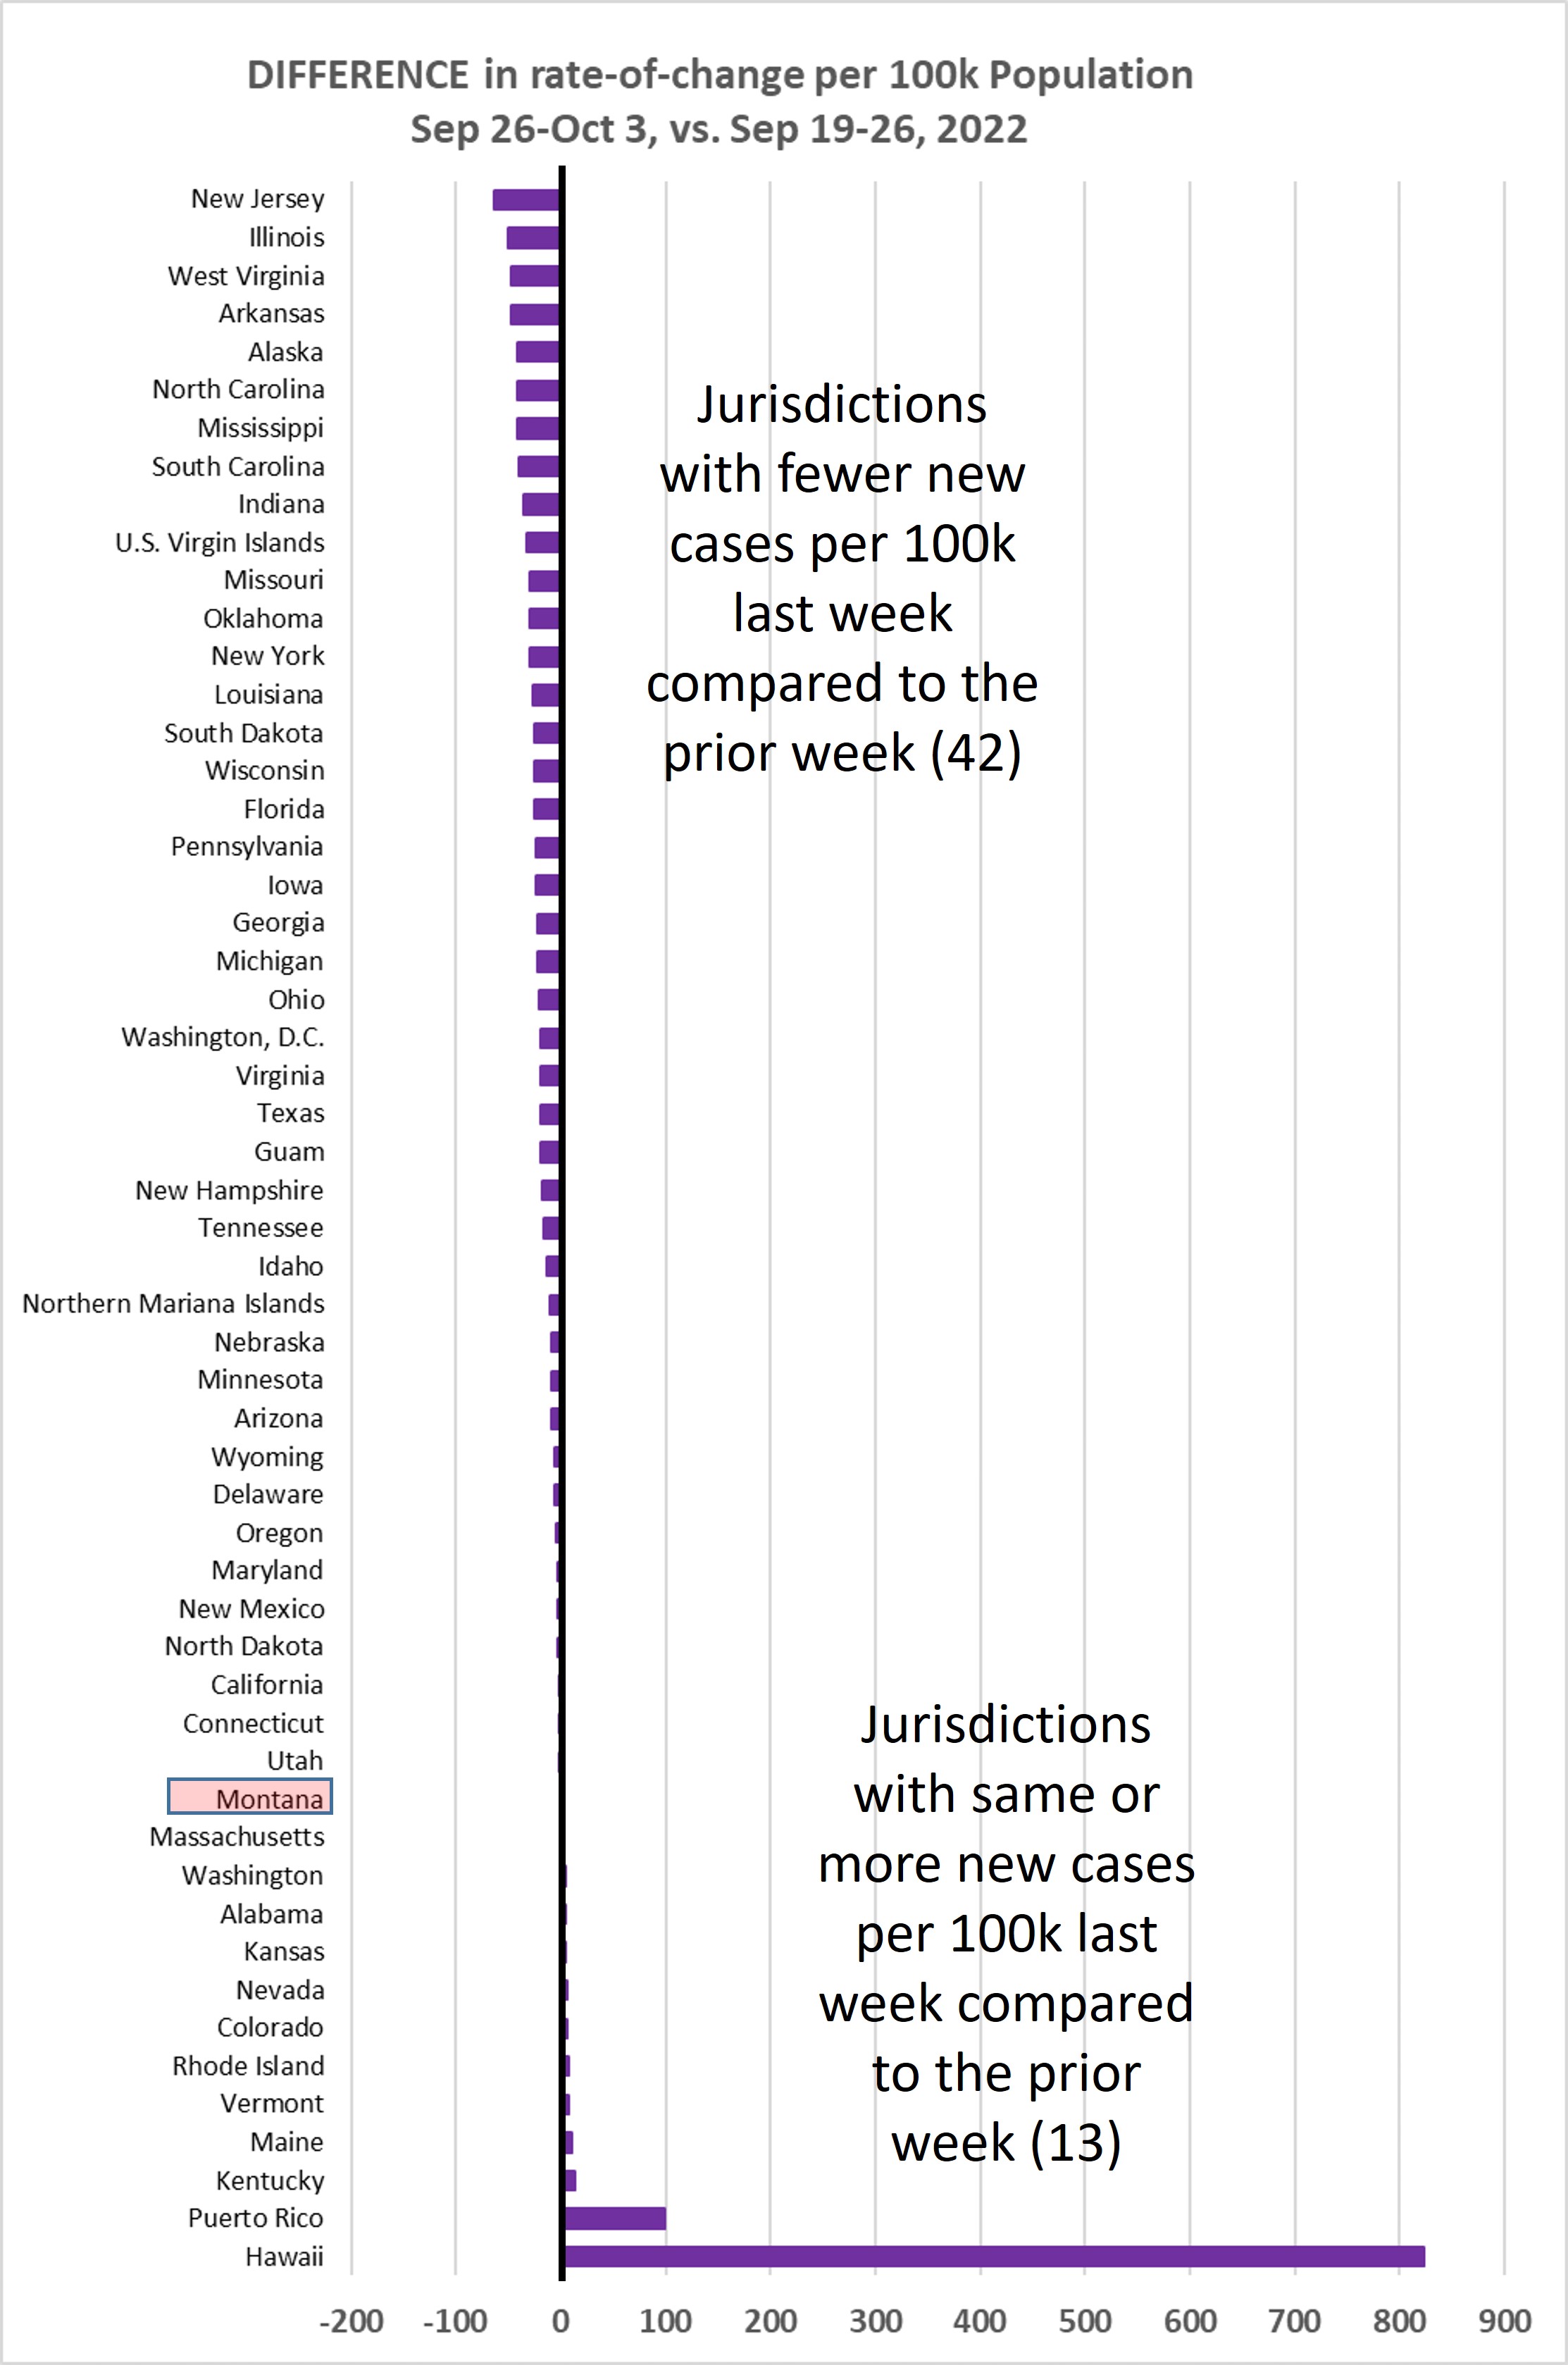
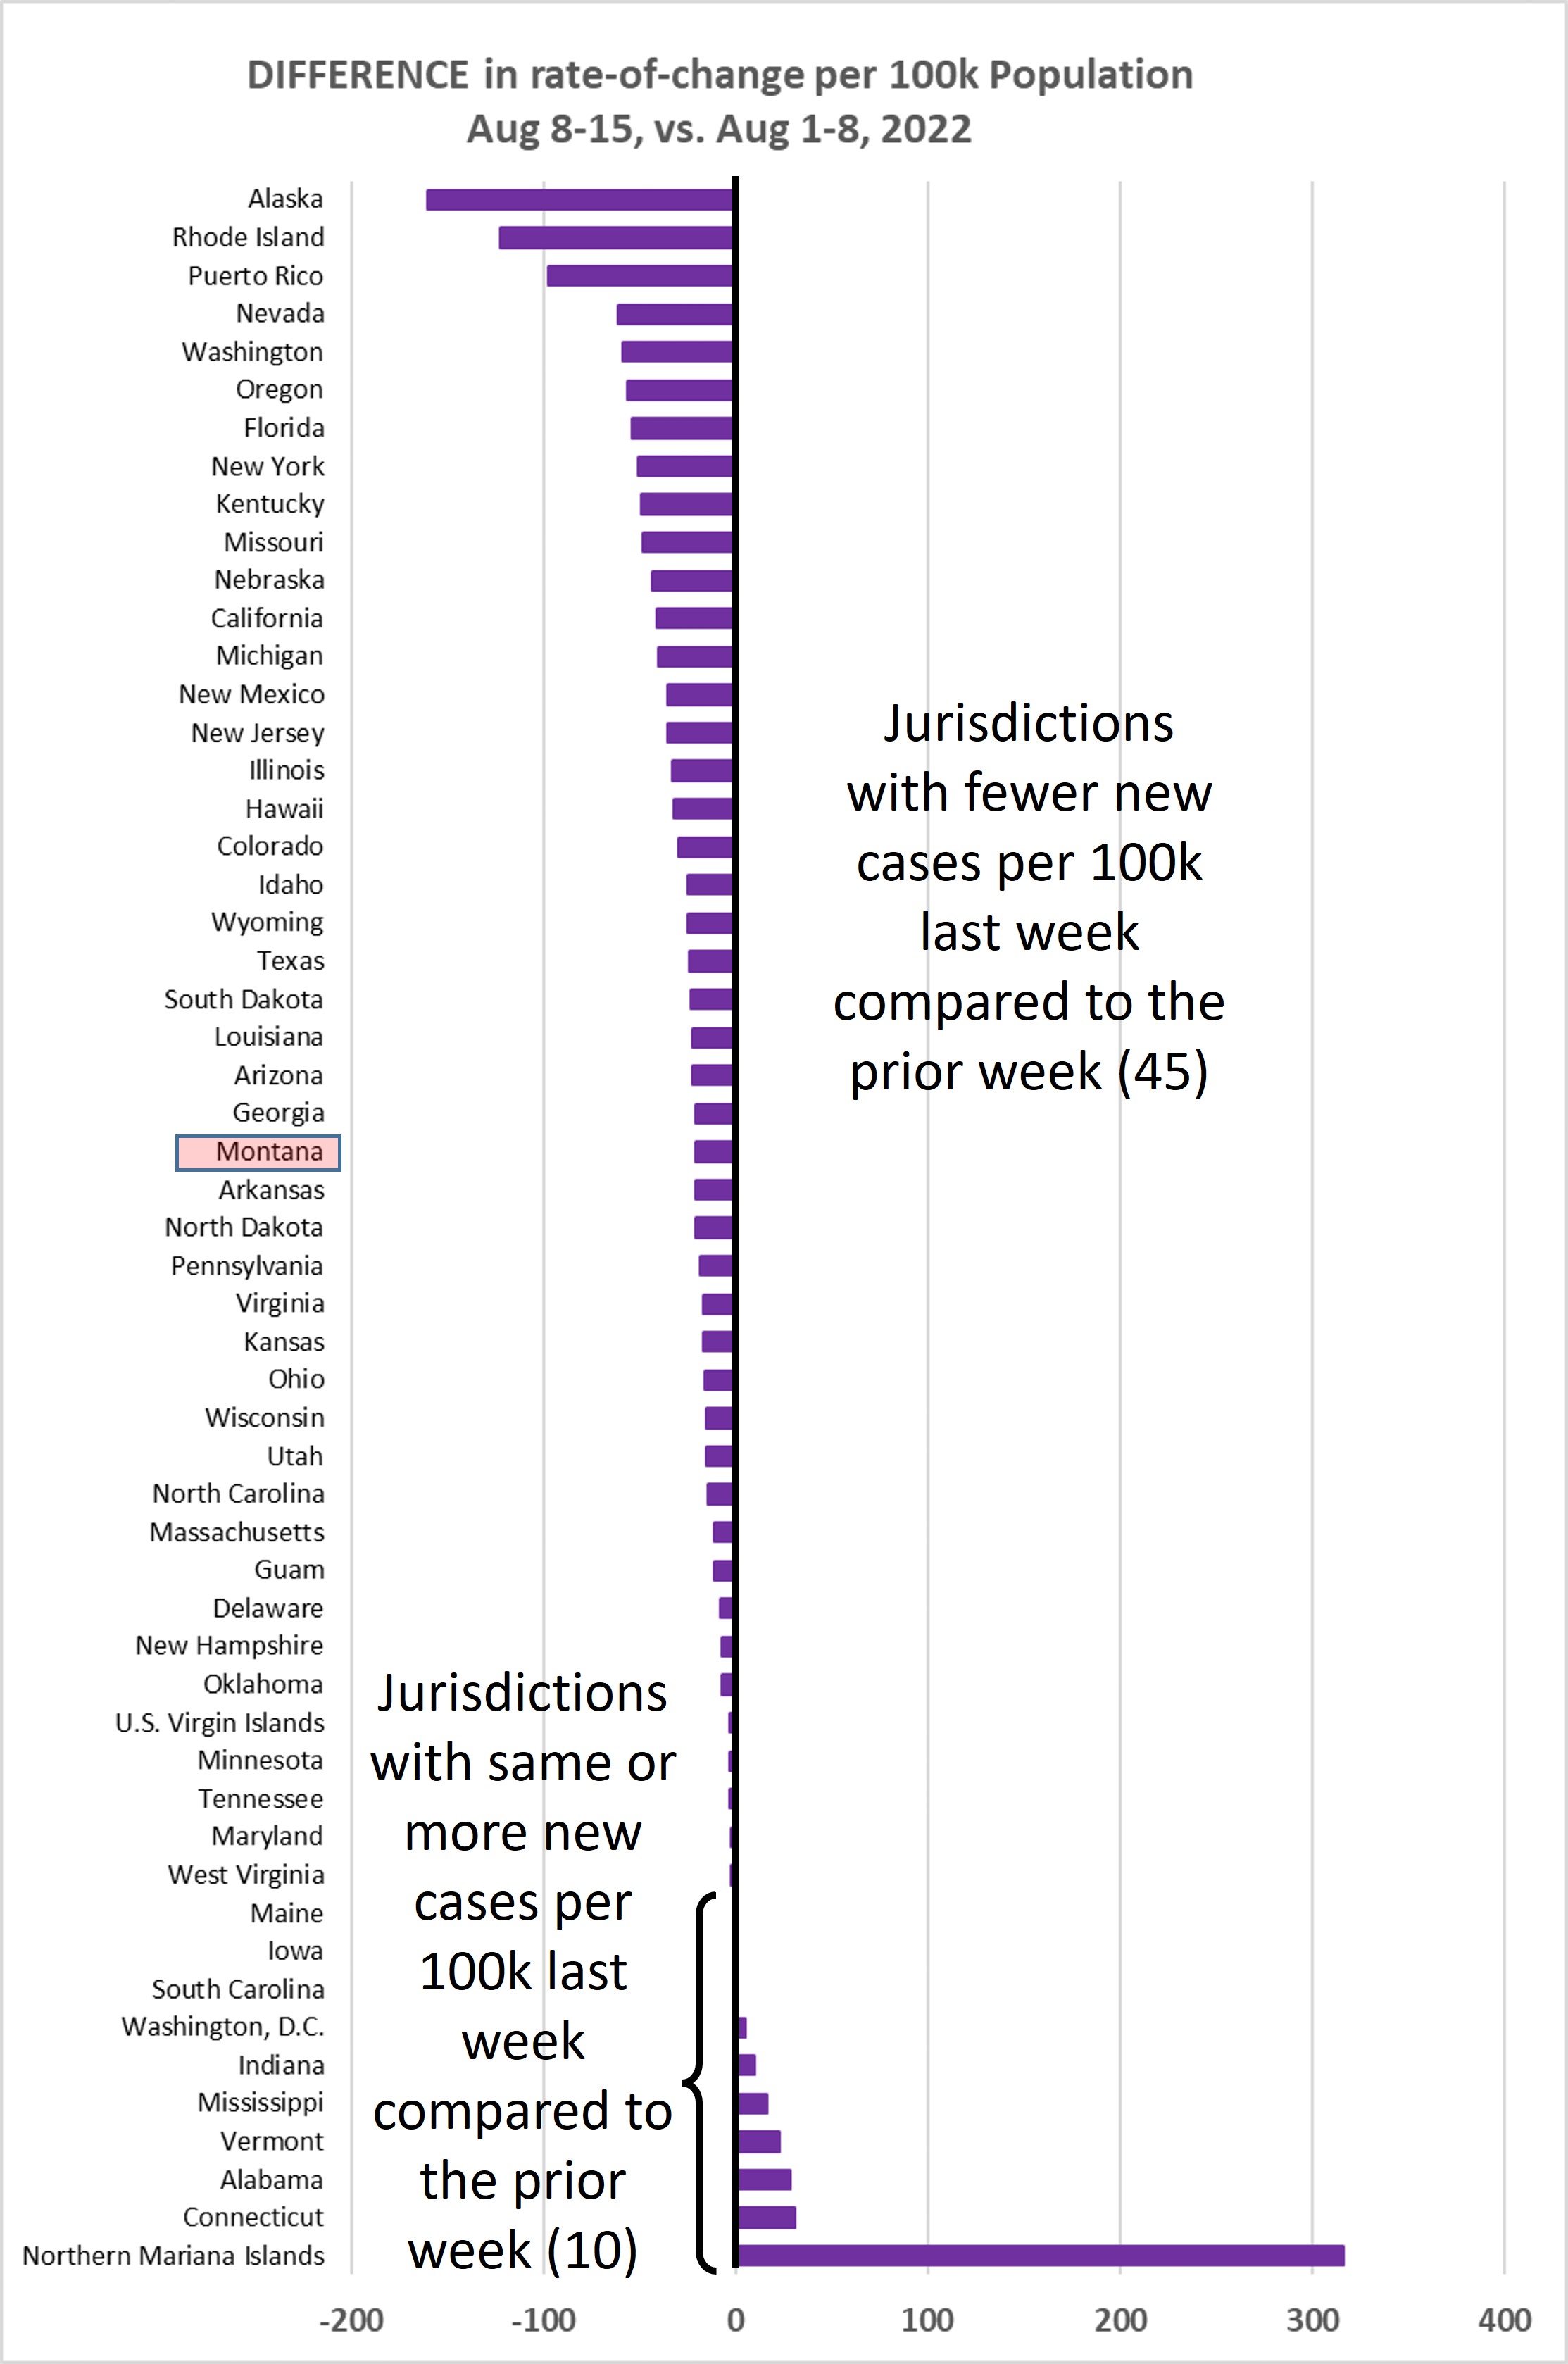
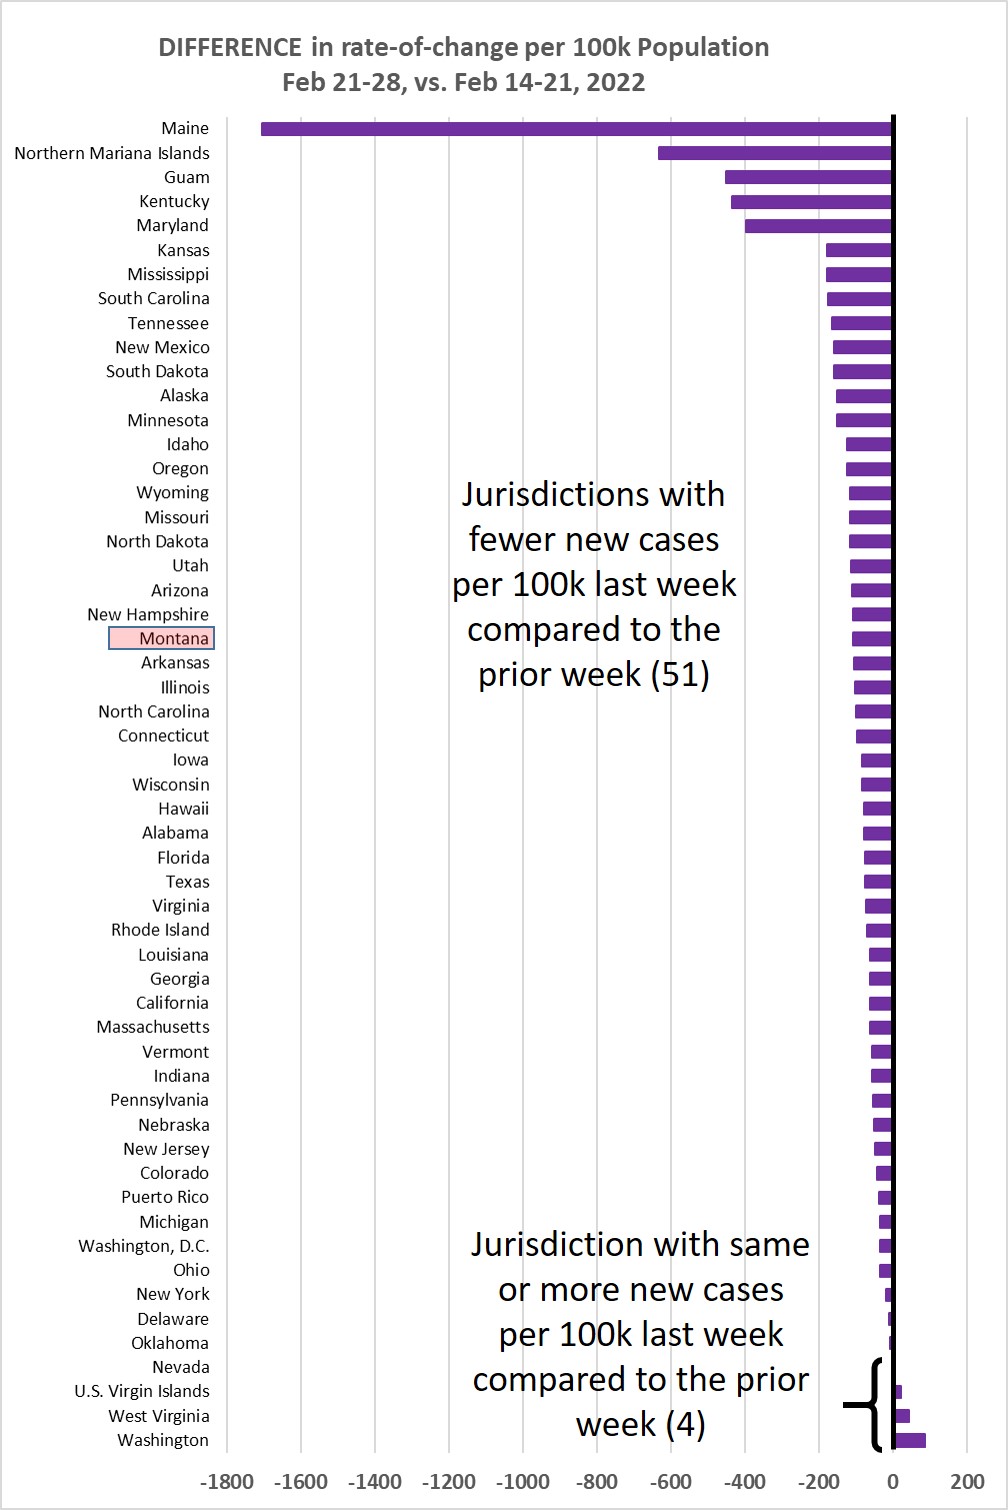
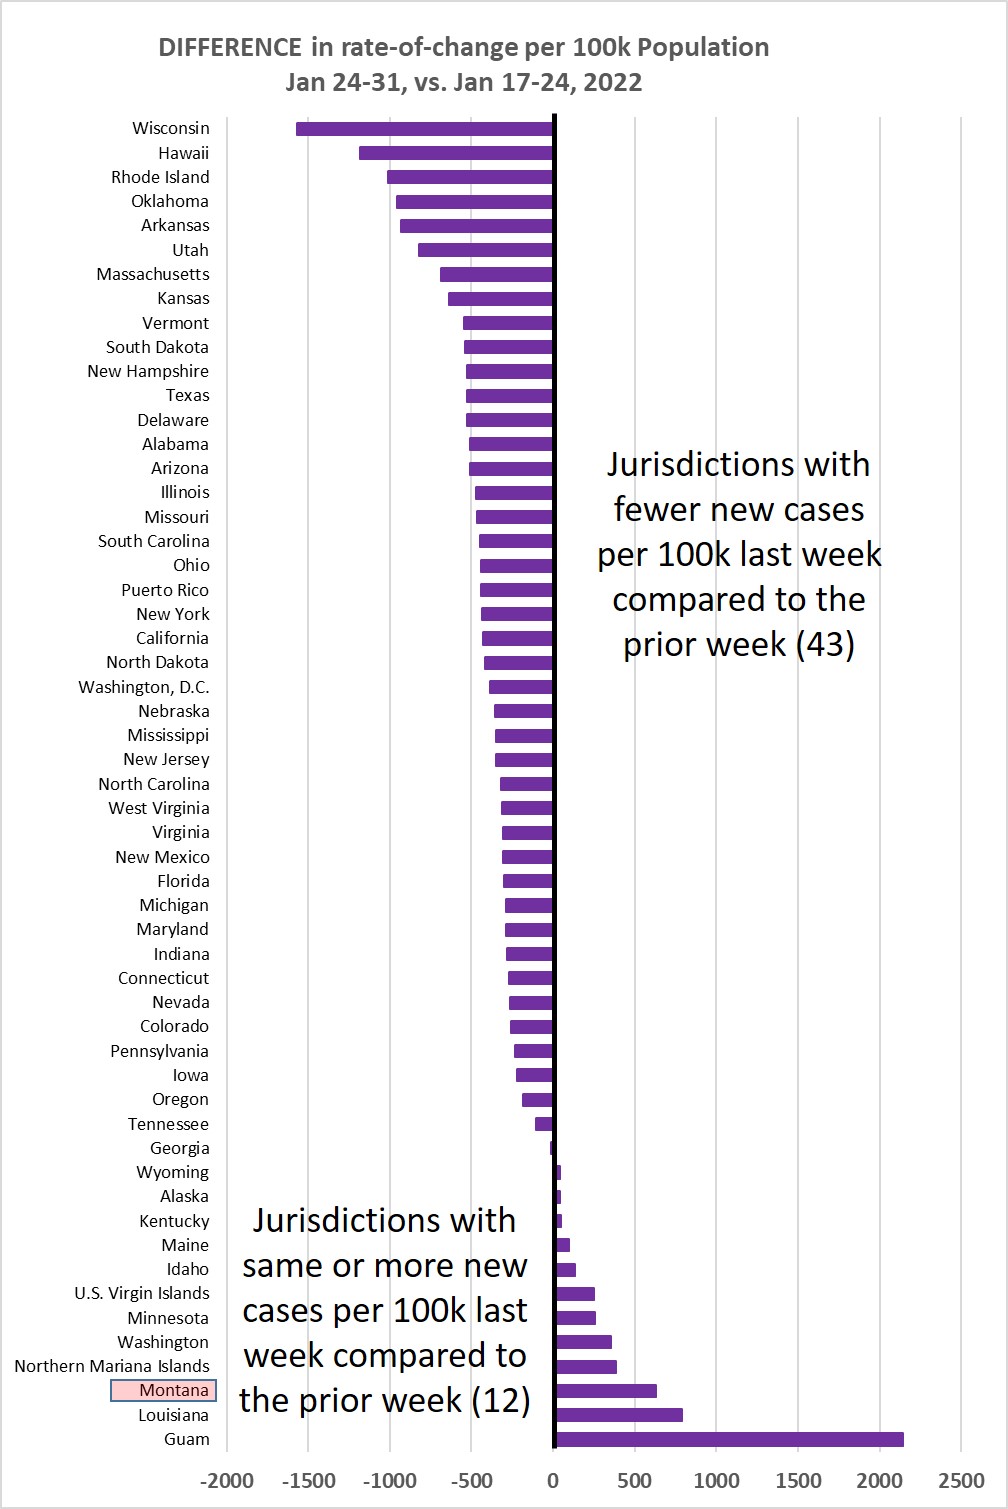
Chart 3 shows the difference in weekly new cases per 100k population for Jan 24-31,
vs. Jan 17-24, 2022. This past week 43/55 jurisdictions (78.2%) showed a lower rate
of new cases. Nationally, we contine to move beyond the Omicron peak.
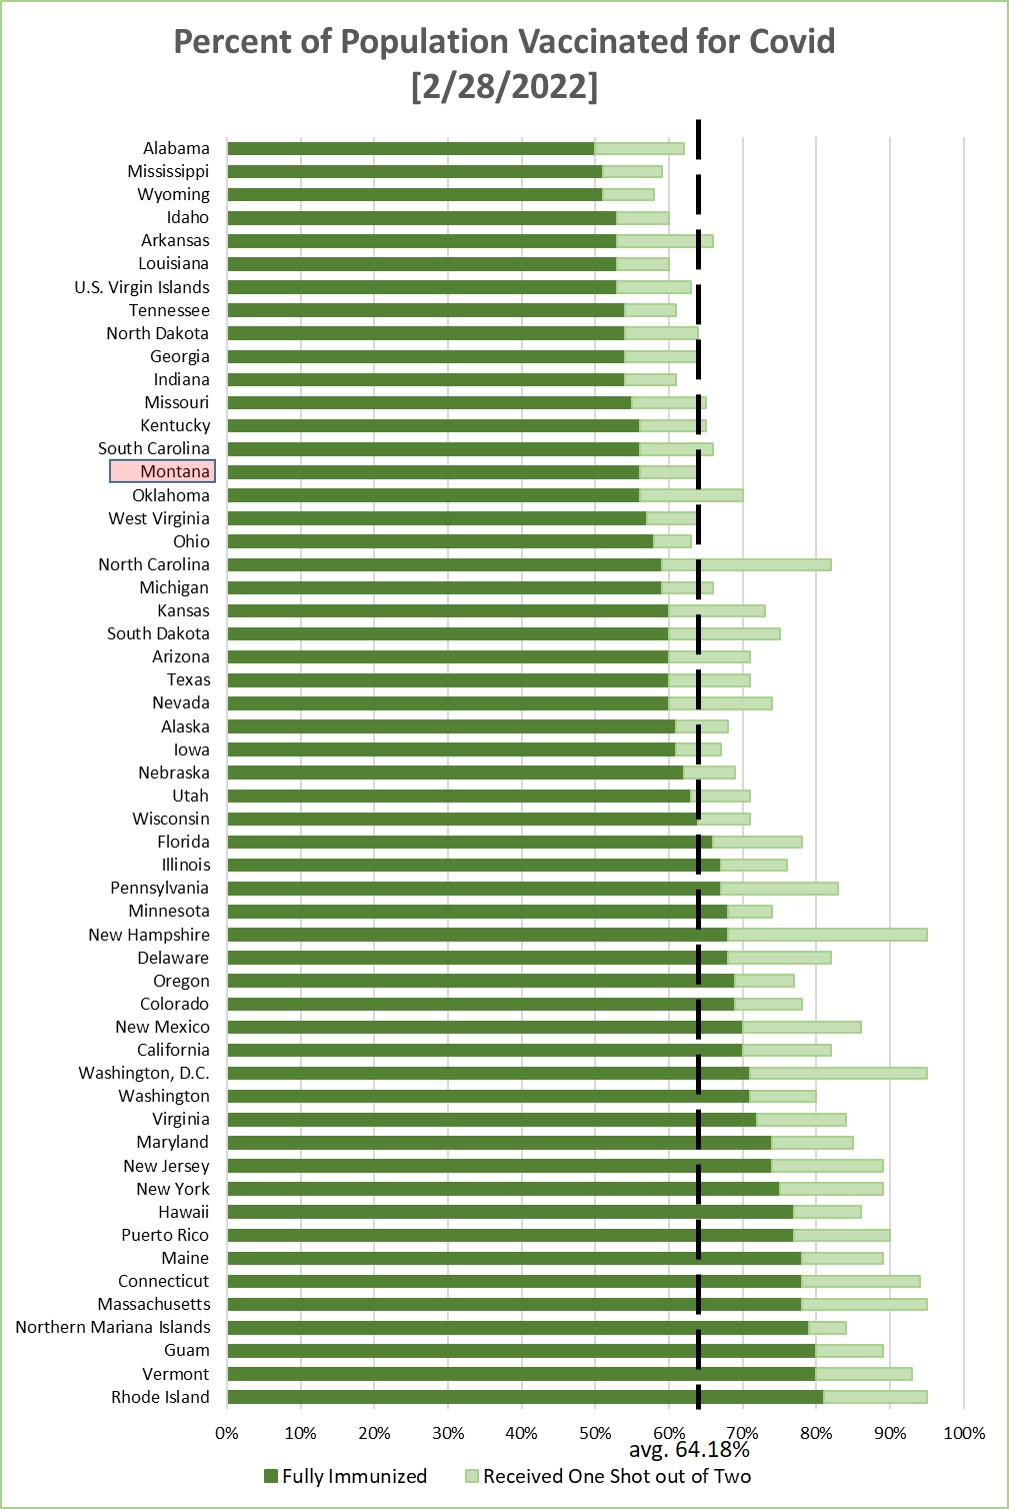
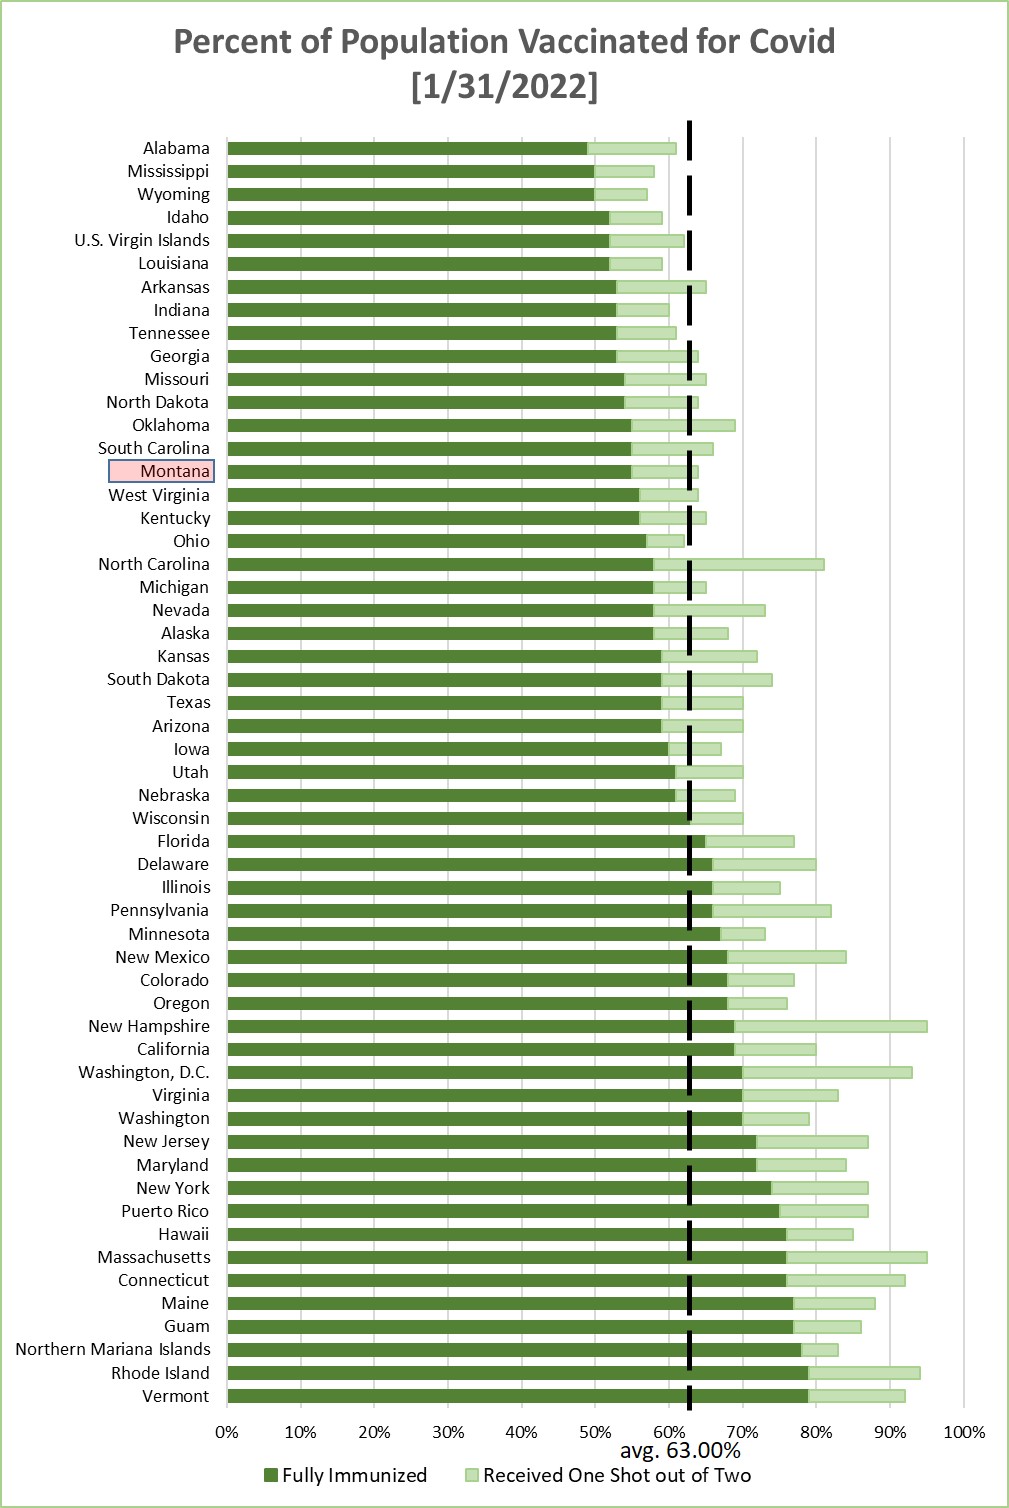
Chart 4 shows the percentage of the population in each jurisdiction having received
1 or 2 Covid-19 vaccination shots. This is sorted by the fraction that have received
2 shots--or one shot of the J&J vaccine. Average across the 55 jurisdictions is 63.00%
being fully immunized, for a weekly increase of about 0.45% (weekly increase the prior
week was 0.49%).

Monday, January 24, 2022
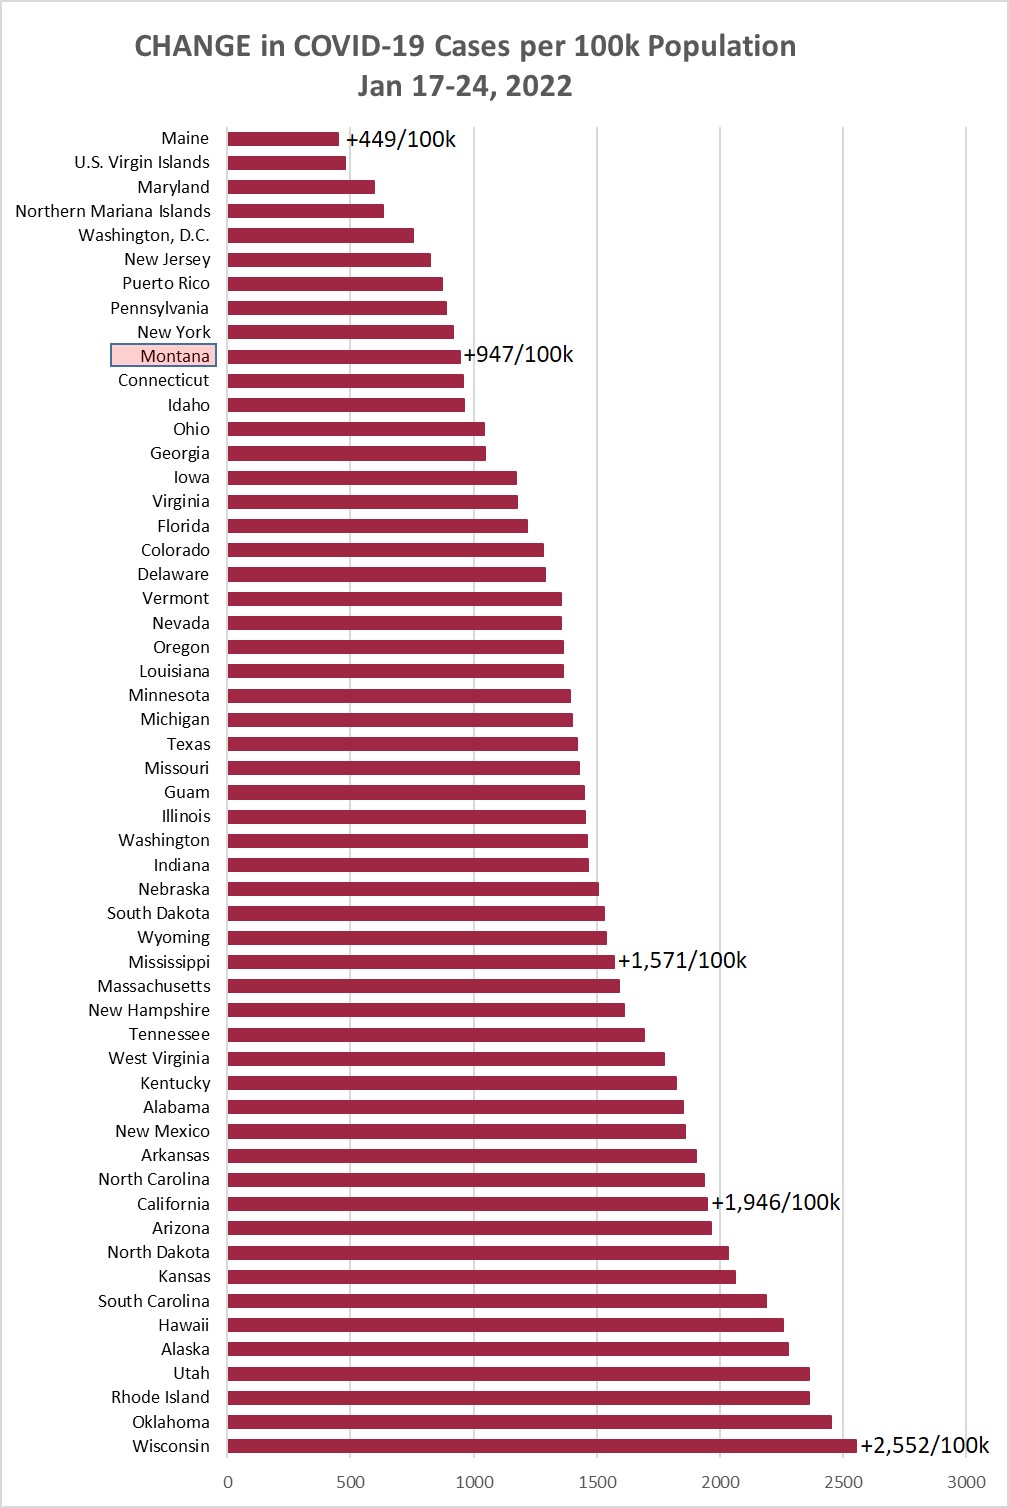
Chart 1 shows the change in cases per 100,000 population as of this morning (January
24, 2022) compared to the cases per 100,000 on January 17, 2022. Montana was up a
record +947/100k this week, compared to +879/100k the prior week, and +506/100k the
week before that.
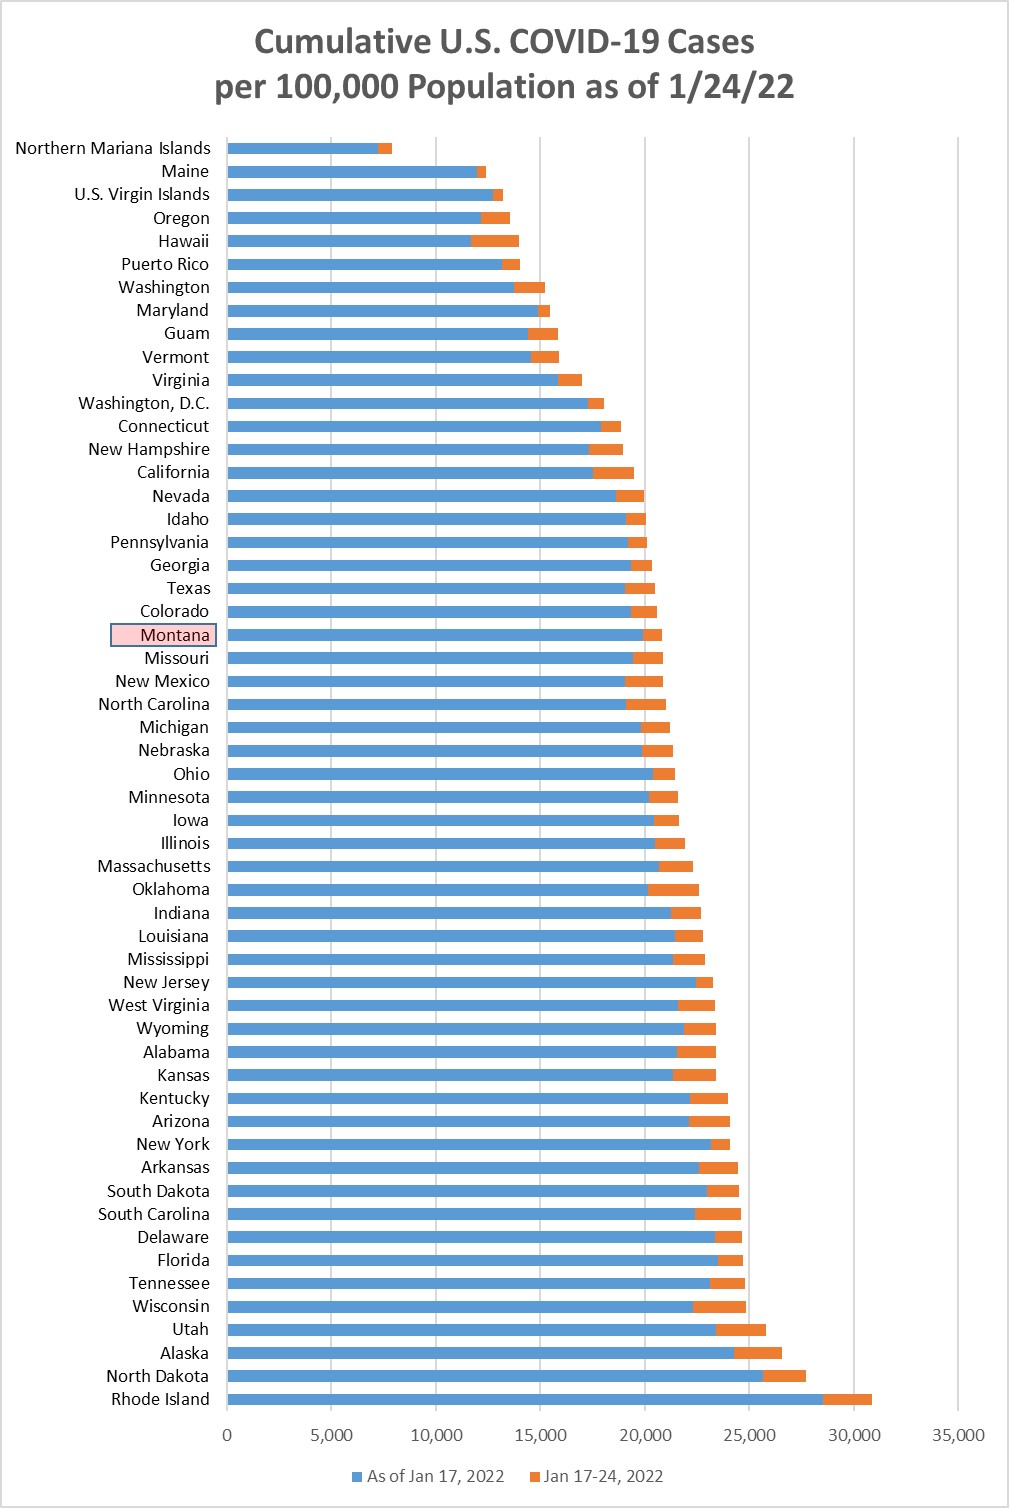
Chart 2 shows the same information as Chart 1, but with the overall cumulative cases
per 100k in each state to January 24. Montana moved down from position 29 to 34 this
week.
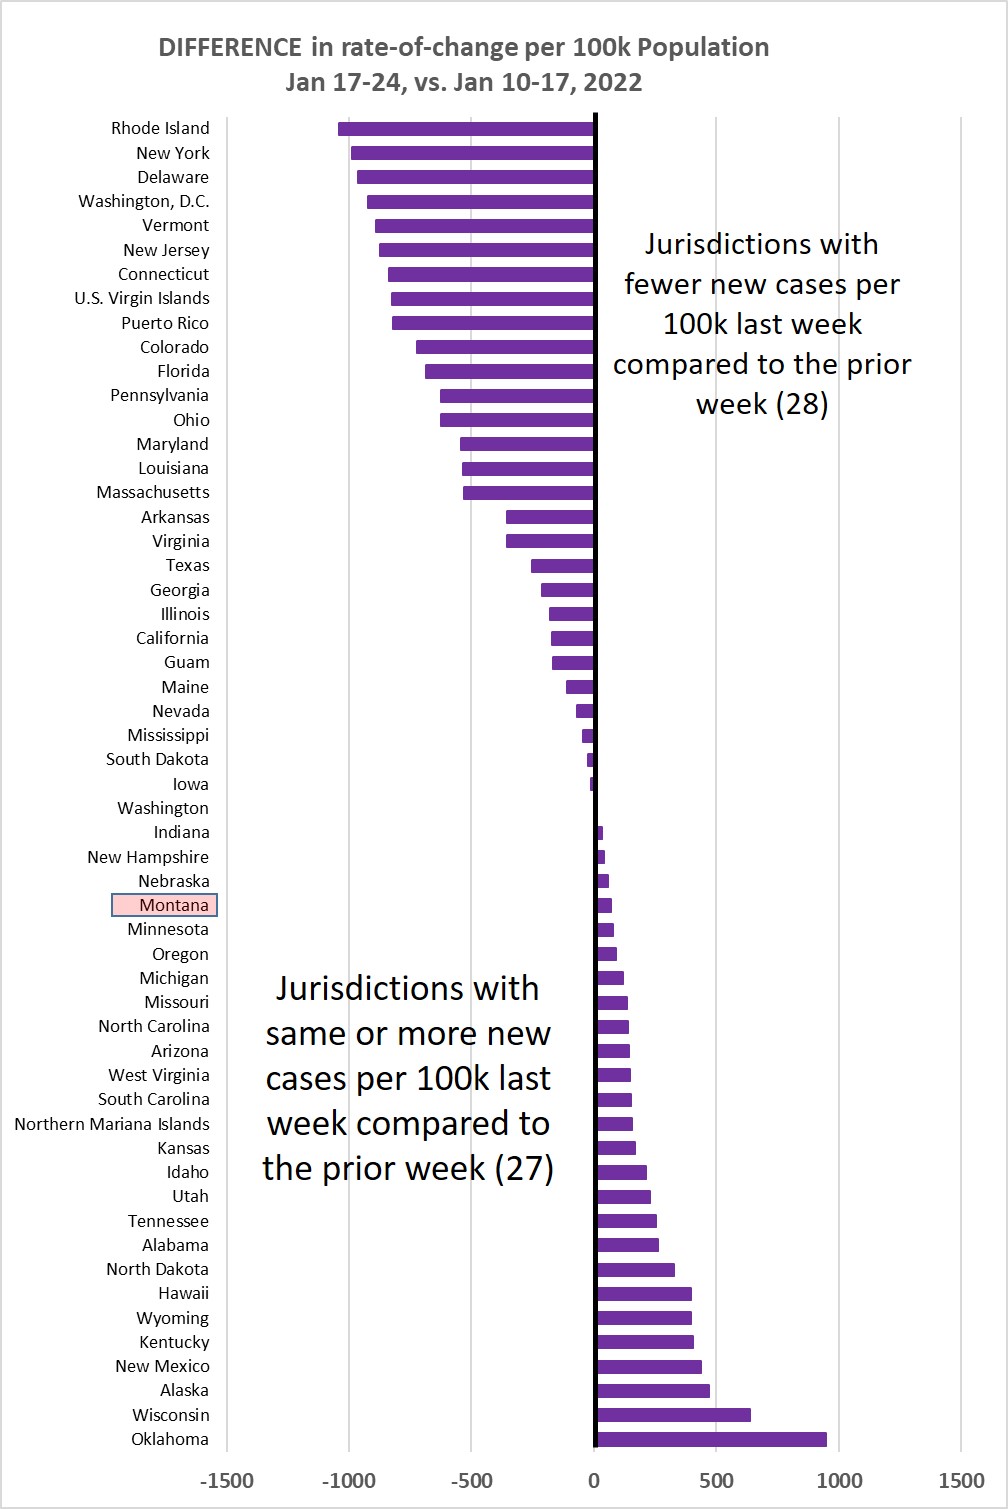
Chart 3 shows the difference in weekly new cases per 100k population for Jan 17-24,
vs. Jan 10-17, 2022. This past week 28/55 jurisdictions (50.9%) showed a lower rate
of new cases. I hope we are moving beyond the Omicron peak.
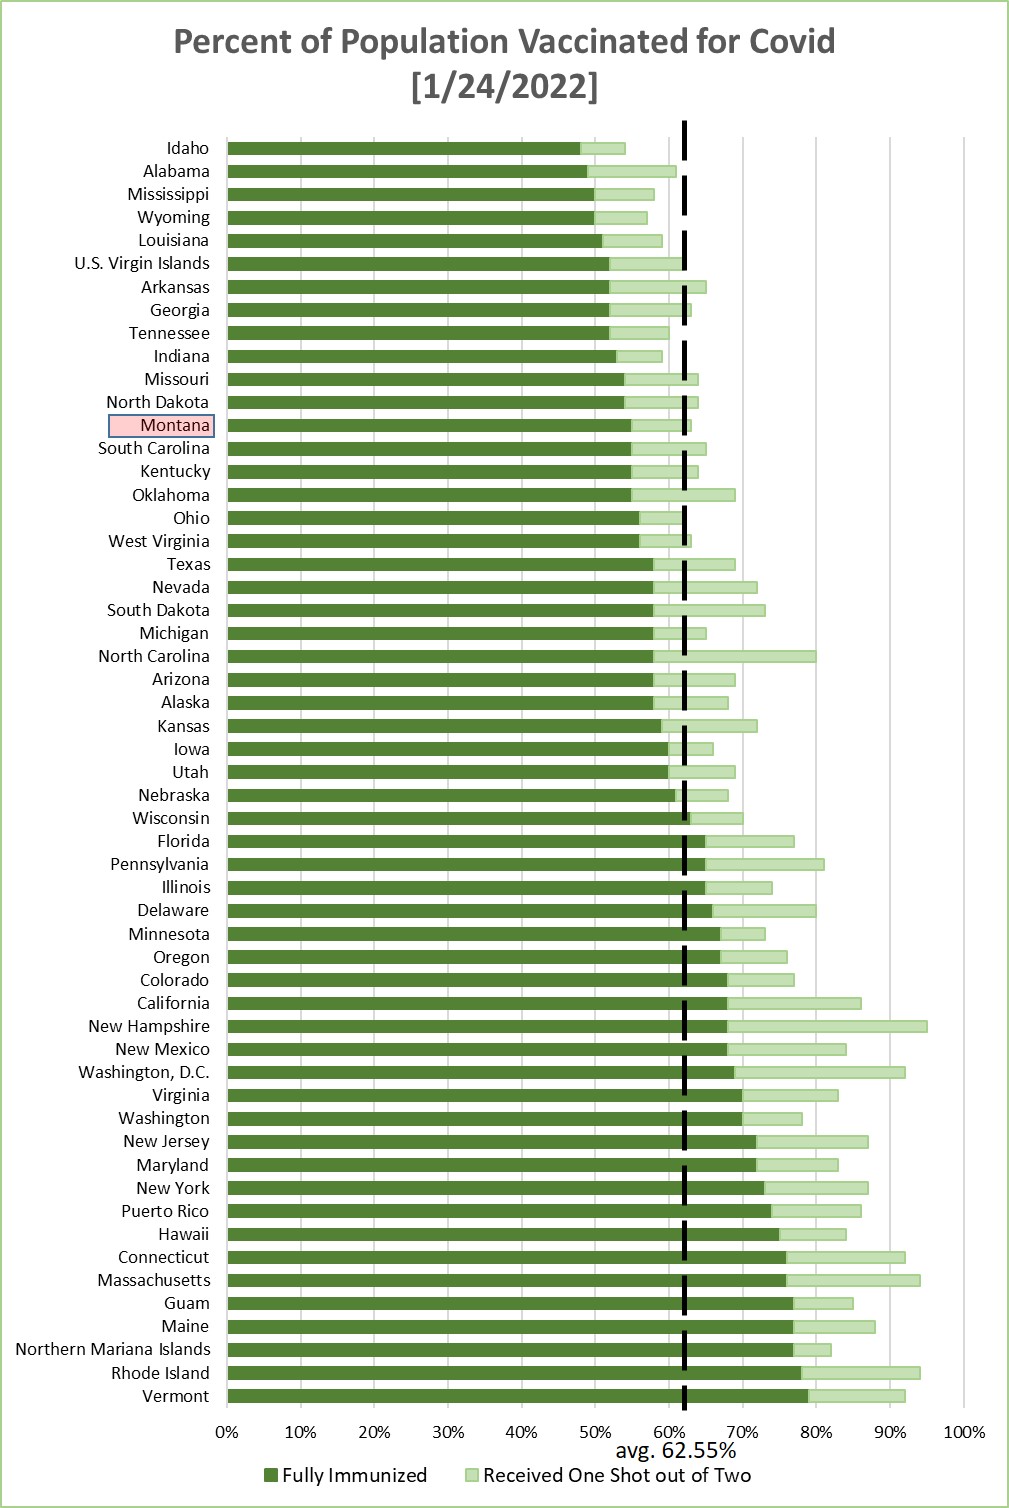
Chart 4 shows the percentage of the population in each jurisdiction having received
1 or 2 Covid-19 vaccination shots. This is sorted by the fraction that have received
2 shots--or one shot of the J&J vaccine. Average across the 55 jurisdictions is 62.55%
being fully immunized, for a weekly increase of about 0.49% (weekly increase the prior
week was 0.65%).
Monday, January 17, 2022
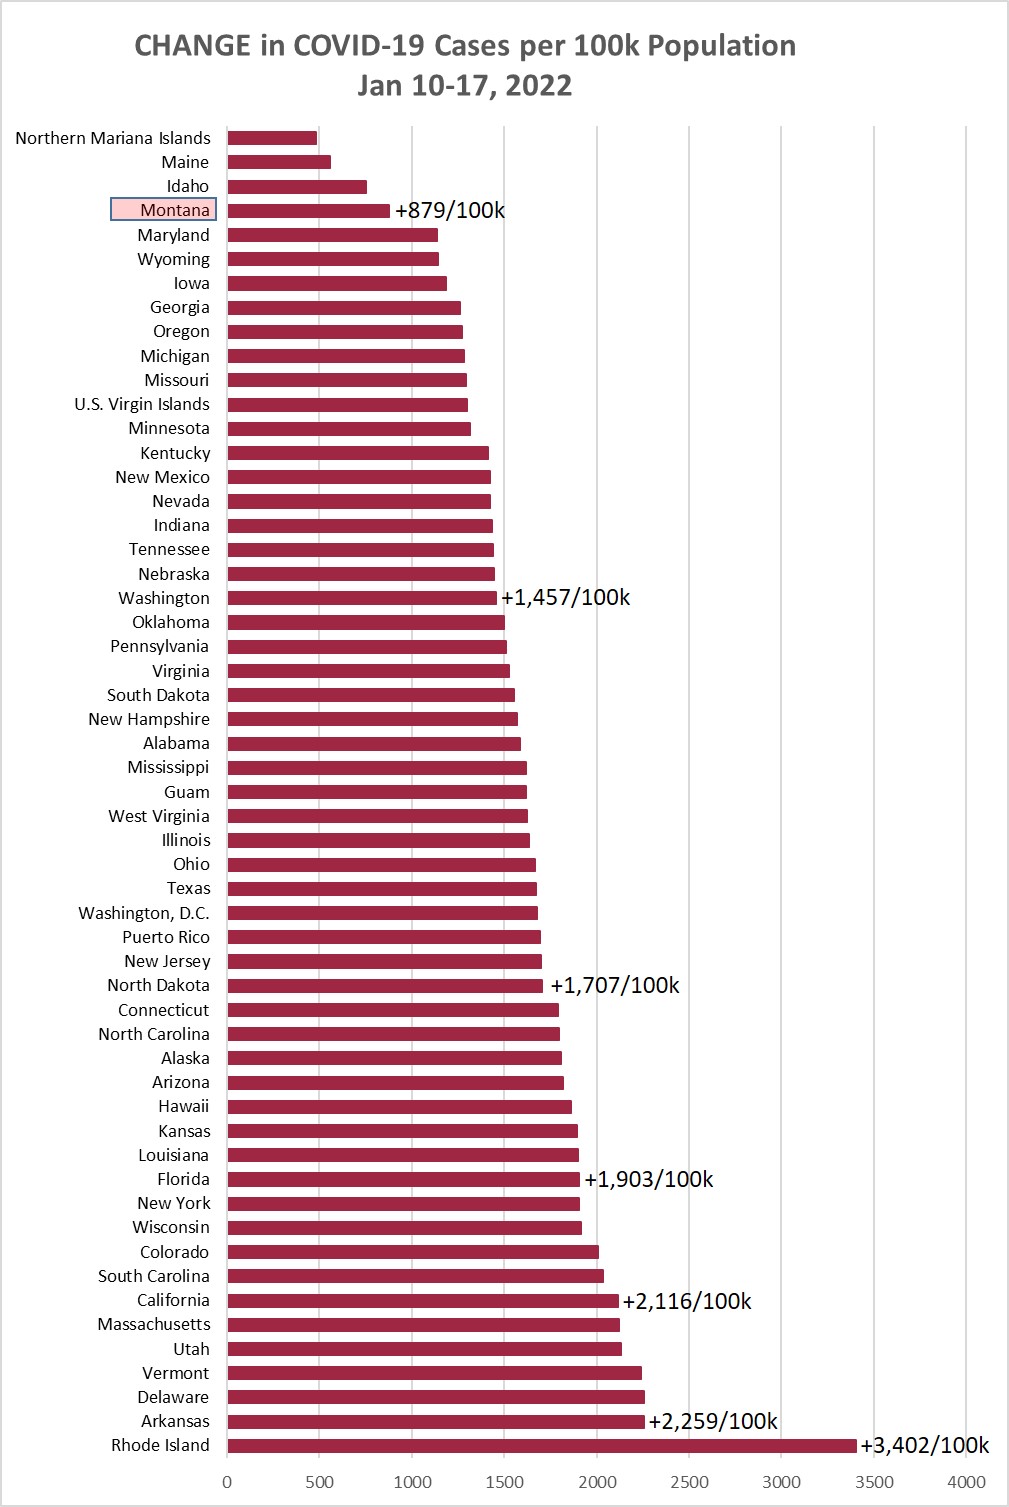
Chart 1 shows the change in cases per 100,000 population as of this morning (January
17, 2022) compared to the cases per 100,000 on January 10, 2022. Montana was up +879/100k
this week, compared to +506/100k the prior week, and +178/100k the week before that.
The weekly increase is the pandemic record, exceeding the previous all-time weekly
peak of 798/100k back on 11/28/2020.
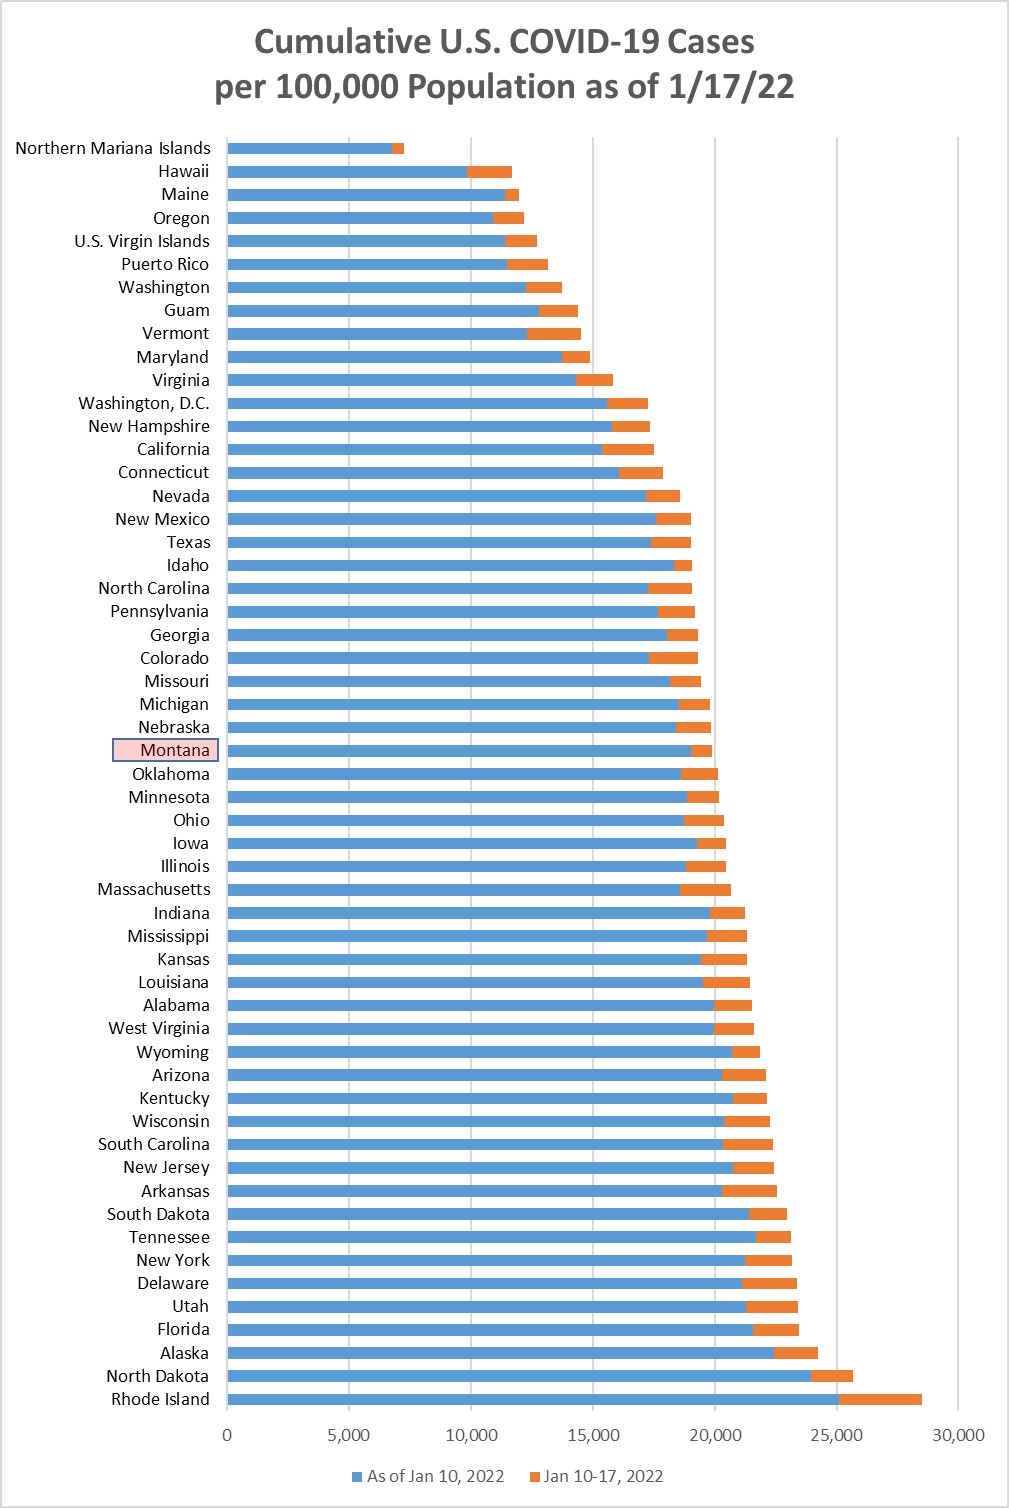
Chart 2 shows the same information as Chart 1, but with the overall cumulative cases
per 100k in each state to January 17. Montana moved down from position 24 to 29 this
week.
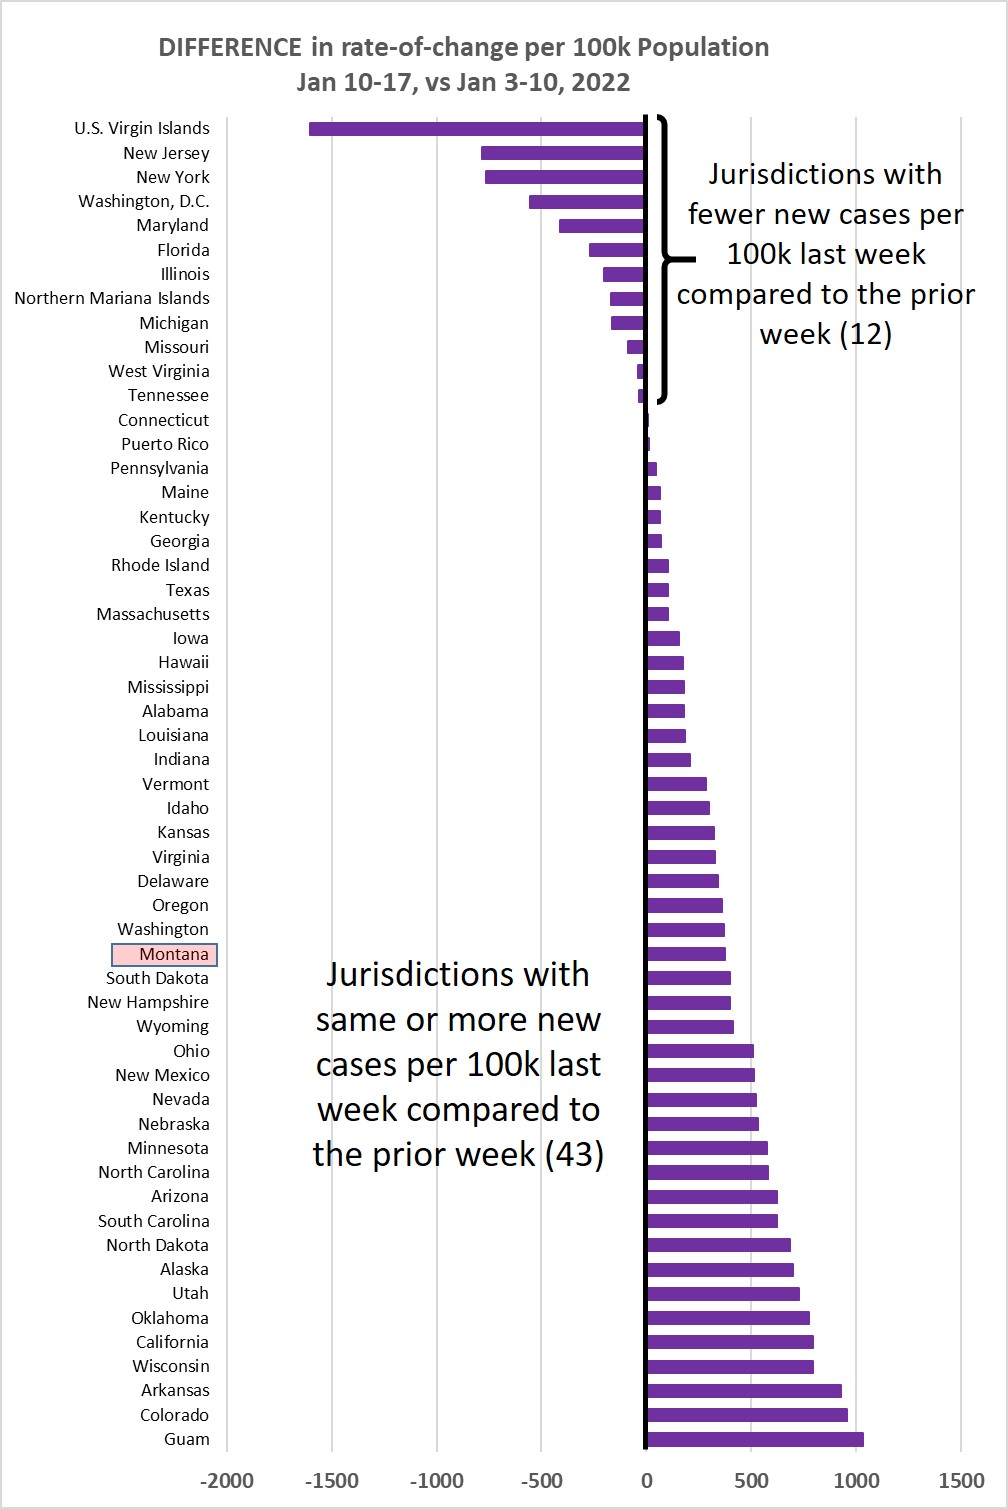
Chart 3 shows the difference in weekly new cases per 100k population for Jan 10-17,
vs. Jan 3-10, 2022. This past week 43/55 jurisdictions (78%) showed a higher rate
of new cases.
Chart 4 shows the percentage of the population in each jurisdiction having received
1 or 2 Covid-19 vaccination shots. This is sorted by the fraction that have received
2 shots--or one shot of the J&J vaccine. Average across the 55 jurisdictions is 62.05%
being fully immunized, for a weekly increase of about 0.65% (weekly increase the prior
week was 0.45%).

Monday, January 10, 2022
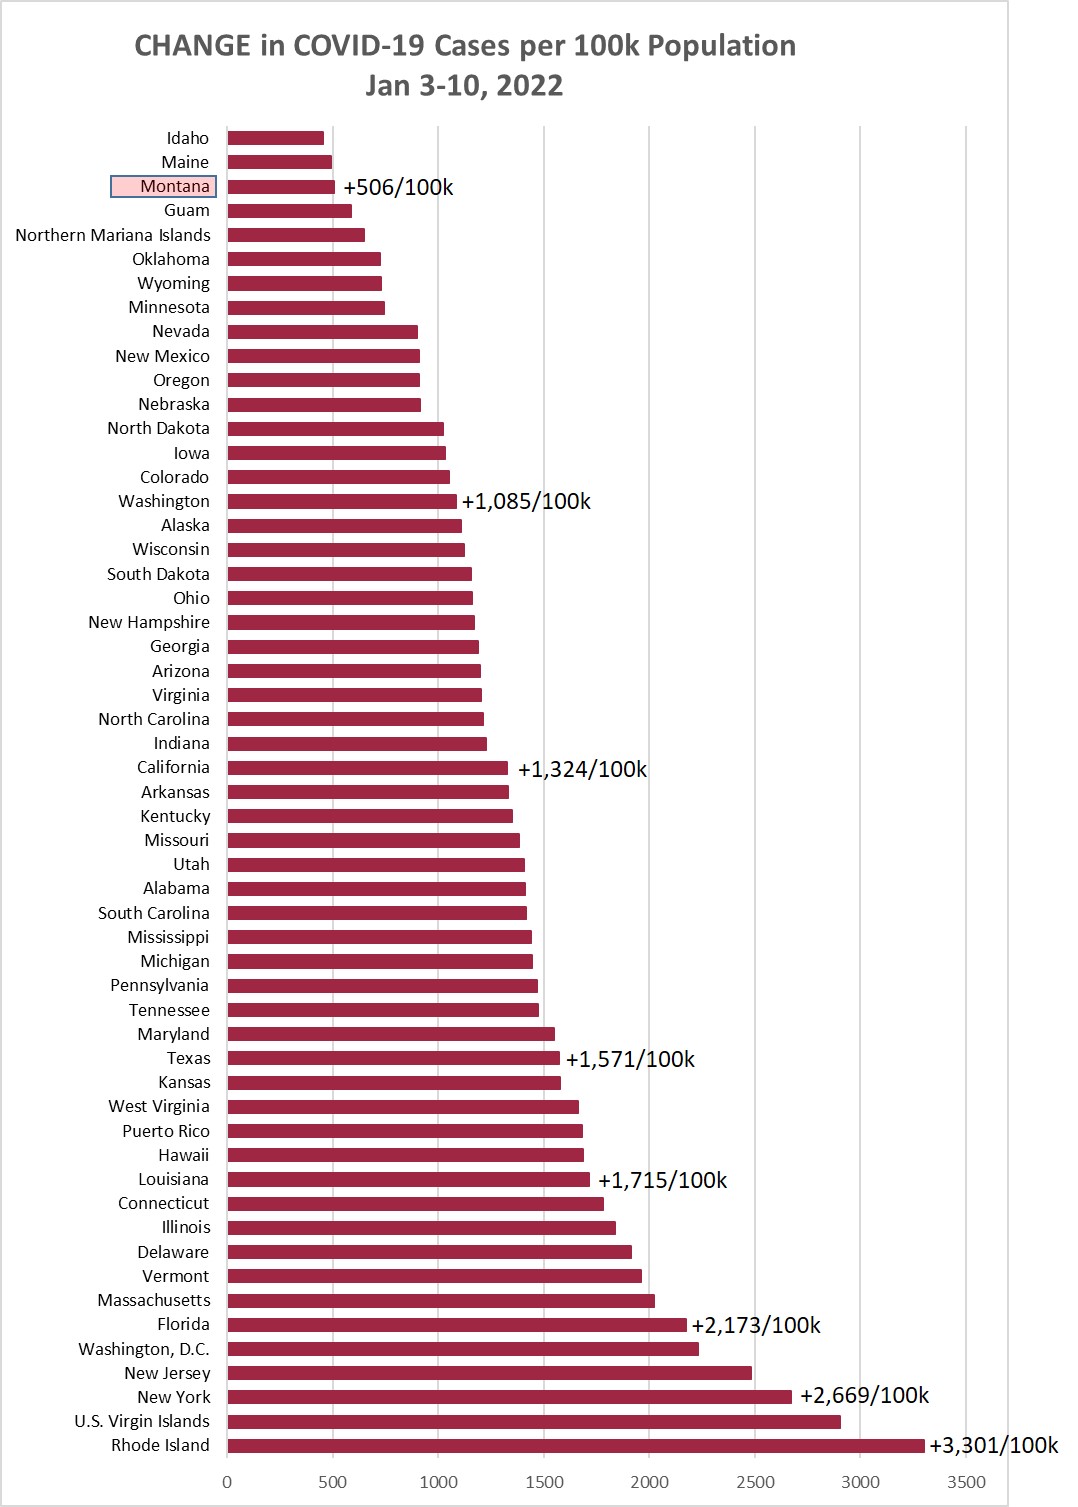
Chart 1 shows the change in cases per 100,000 population as of this morning (January
10, 2022) compared to the cases per 100,000 on January 3, 2022. Montana was up +506/100k
this week, compared to +178/100k the prior week, and +86/100k the week before that.
The increase is still below last fall's peak (626 10/11/21) and the all-time peak
(798 11/28/20).
Chart 2 shows the same information as Chart 1, but with the overall cumulative cases
per 100k in each state to January 10. Montana moved down from position 18 to 24 this
week. Rhode Island (25.1%) moved ahead of North Dakota (24%) in all-time cases.
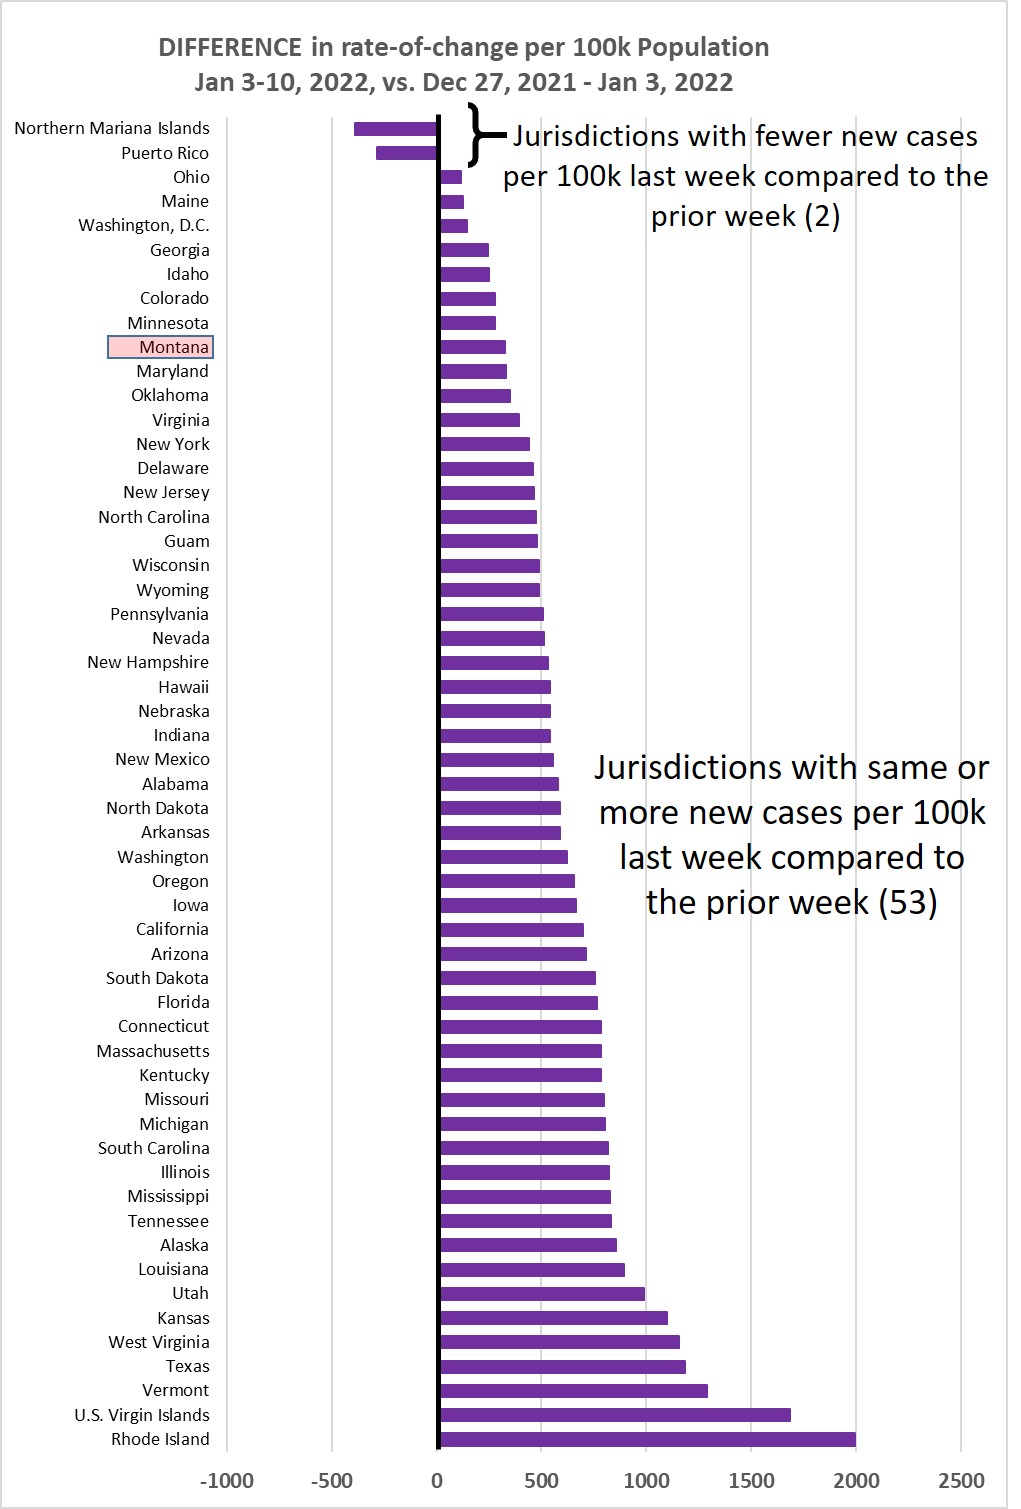
Chart 3 shows the difference in weekly new cases per 100k population for Jan 3-10,
2022, vs. Dec 27-Jan 3. This past week 53/55 jurisdictions (96%) showed a higher rate
of new cases.
Chart 4 shows the percentage of the population in each jurisdiction having received
1 or 2 Covid-19 vaccination shots. This is sorted by the fraction that have received
2 shots--or one shot of the J&J vaccine. Average across the 55 jurisdictions is 61.4%
being fully immunized, for a weekly increase of about 0.45% (weekly increase the prior
week was 0.27%).


Monday, January 3, 2022
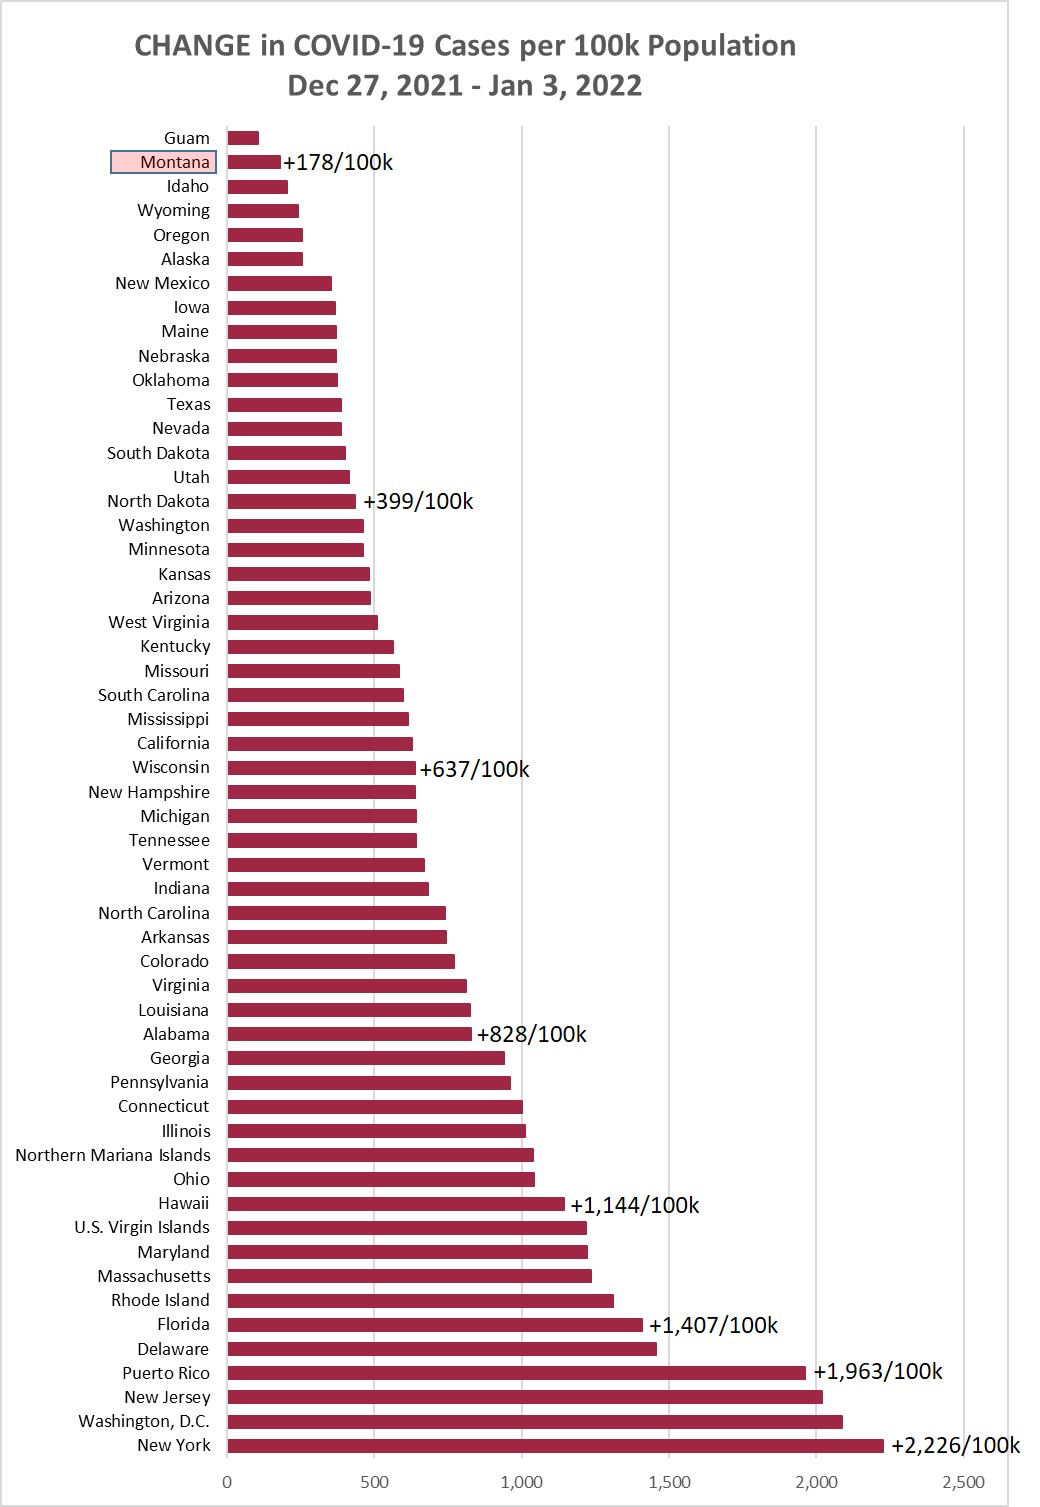
Chart 1 shows the change in cases per 100,000 population as of this morning (January
3, 2022) compared to the cases per 100,000 on December 27, 2021. Montana was up +178/100k
this week, compared to +86/100k the prior week, and +97/100k the week before that.
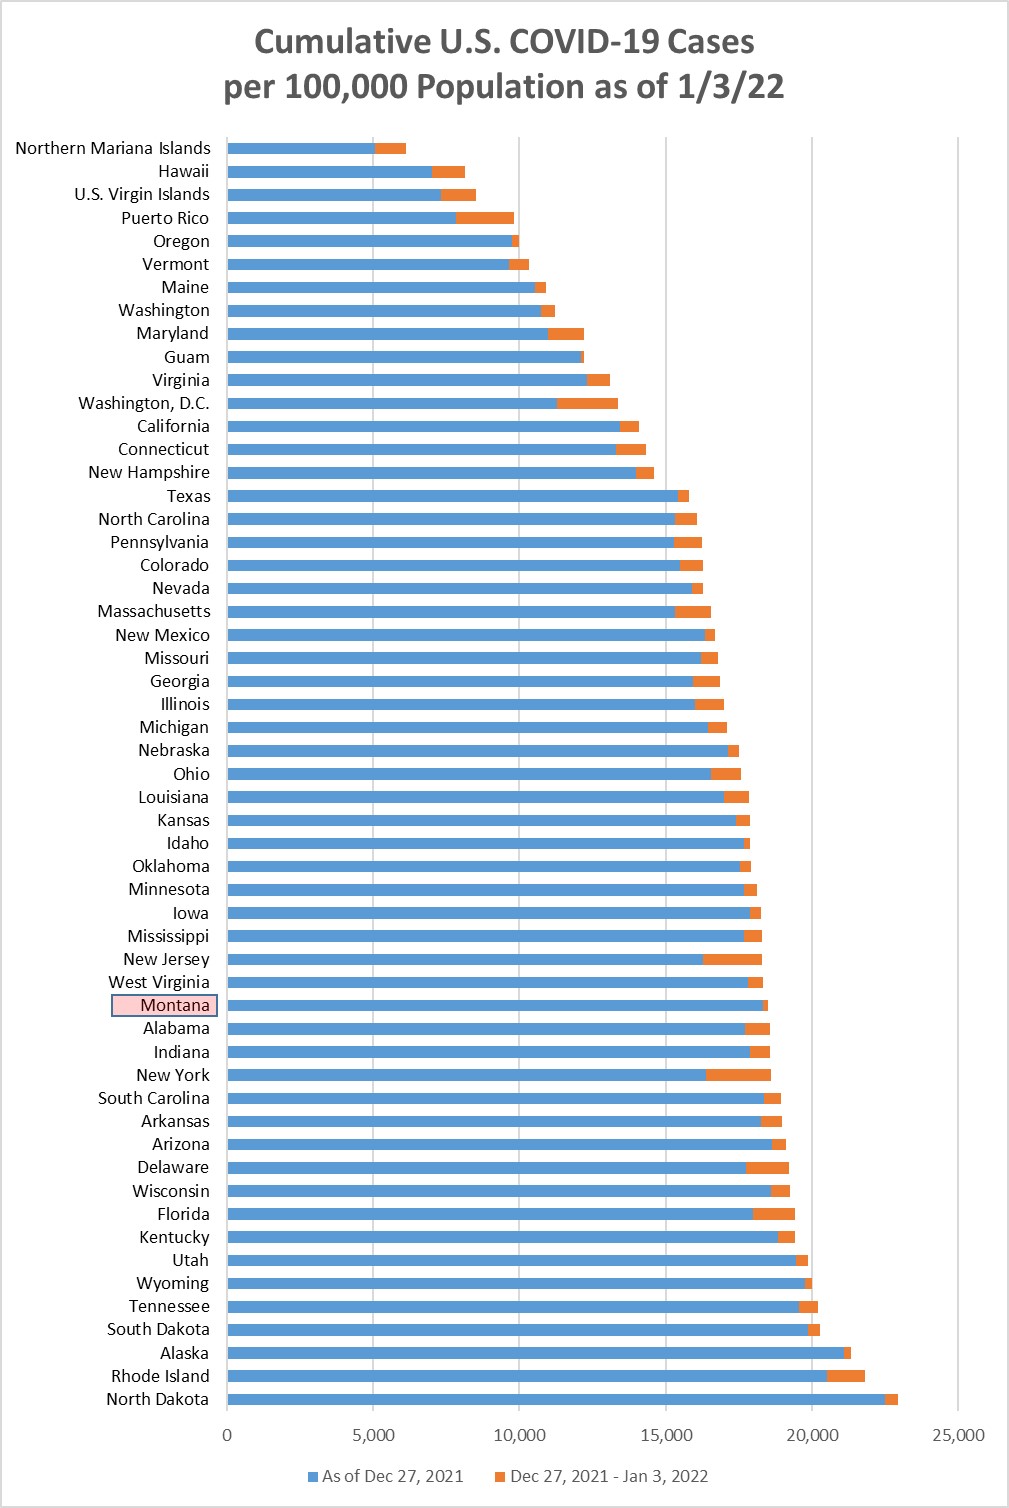
Chart 2 shows the same information as Chart 1, but with the overall cumulative cases
per 100k in each state to January 3. Montana moved down to position 18 this week,
being passed by New York, Indiana, etc.
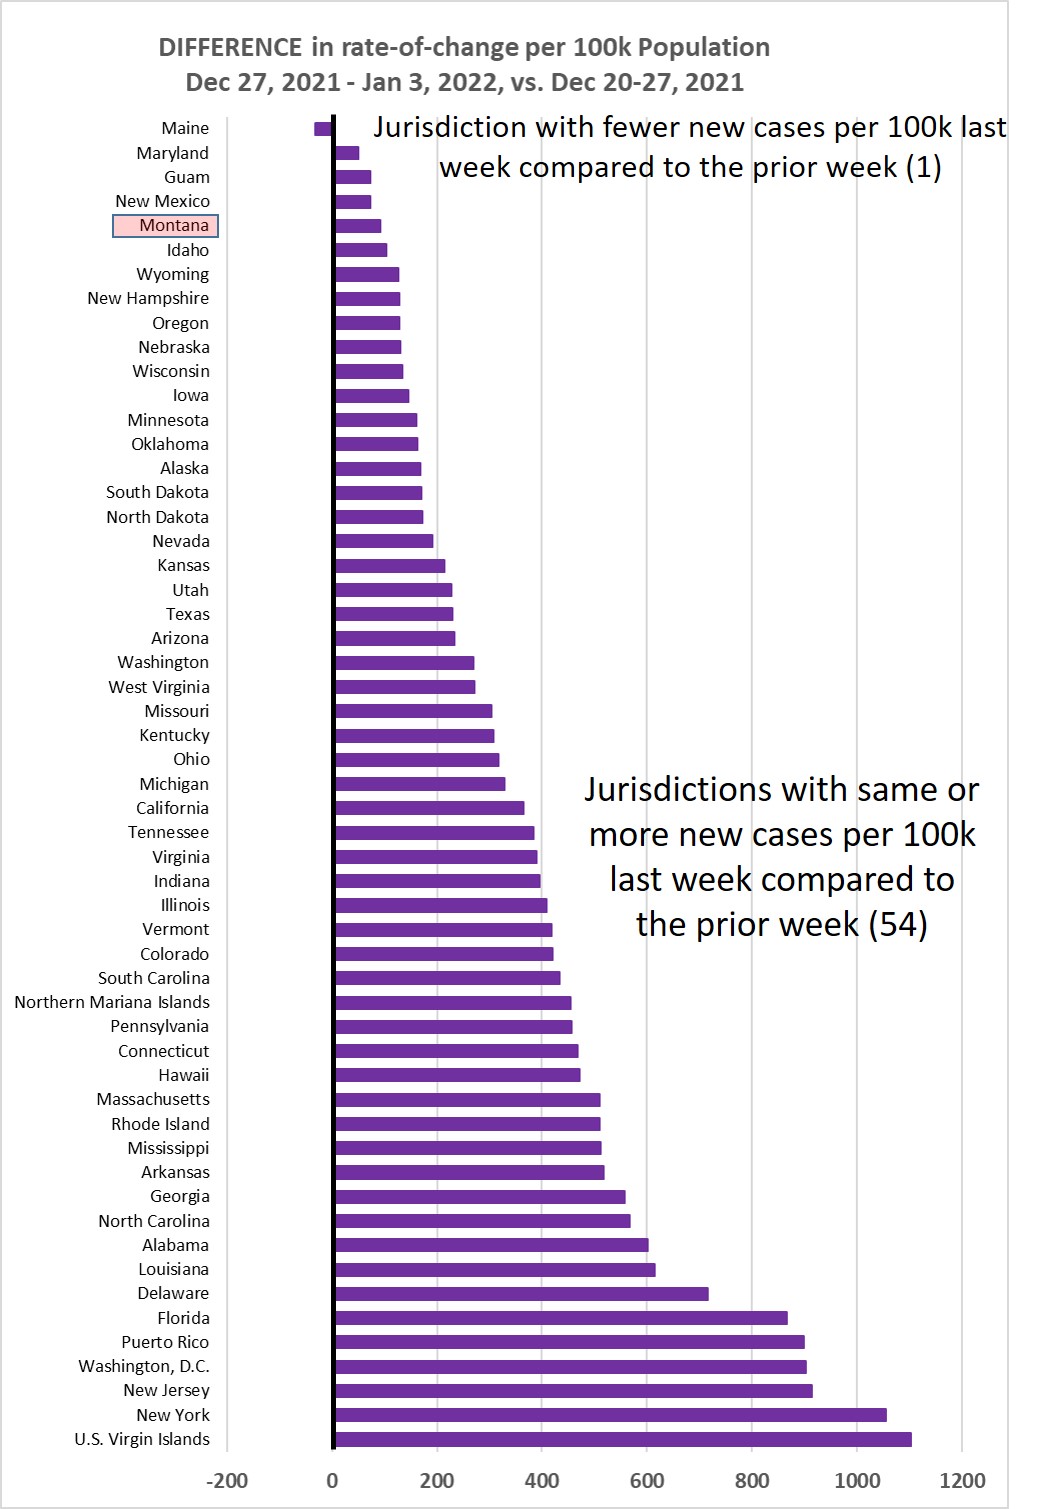
Chart 3 shows the difference in weekly new cases per 100k population for Dec 27-Jan
3, vs. Dec 20-27, 2021. This past week 54/55 jurisdictions (98%) showed a higher rate
of new cases.
Chart 4 shows the percentage of the population in each jurisdiction having received
1 or 2 Covid-19 vaccination shots. This is sorted by the fraction that have received
2 shots--or one shot of the J&J vaccine. Average across the 55 jurisdictions is 60.95%
being fully immunized, for a weekly increase of about 0.27% (weekly increase the prior
week was 0.11%).

Monday, December 27, 2021
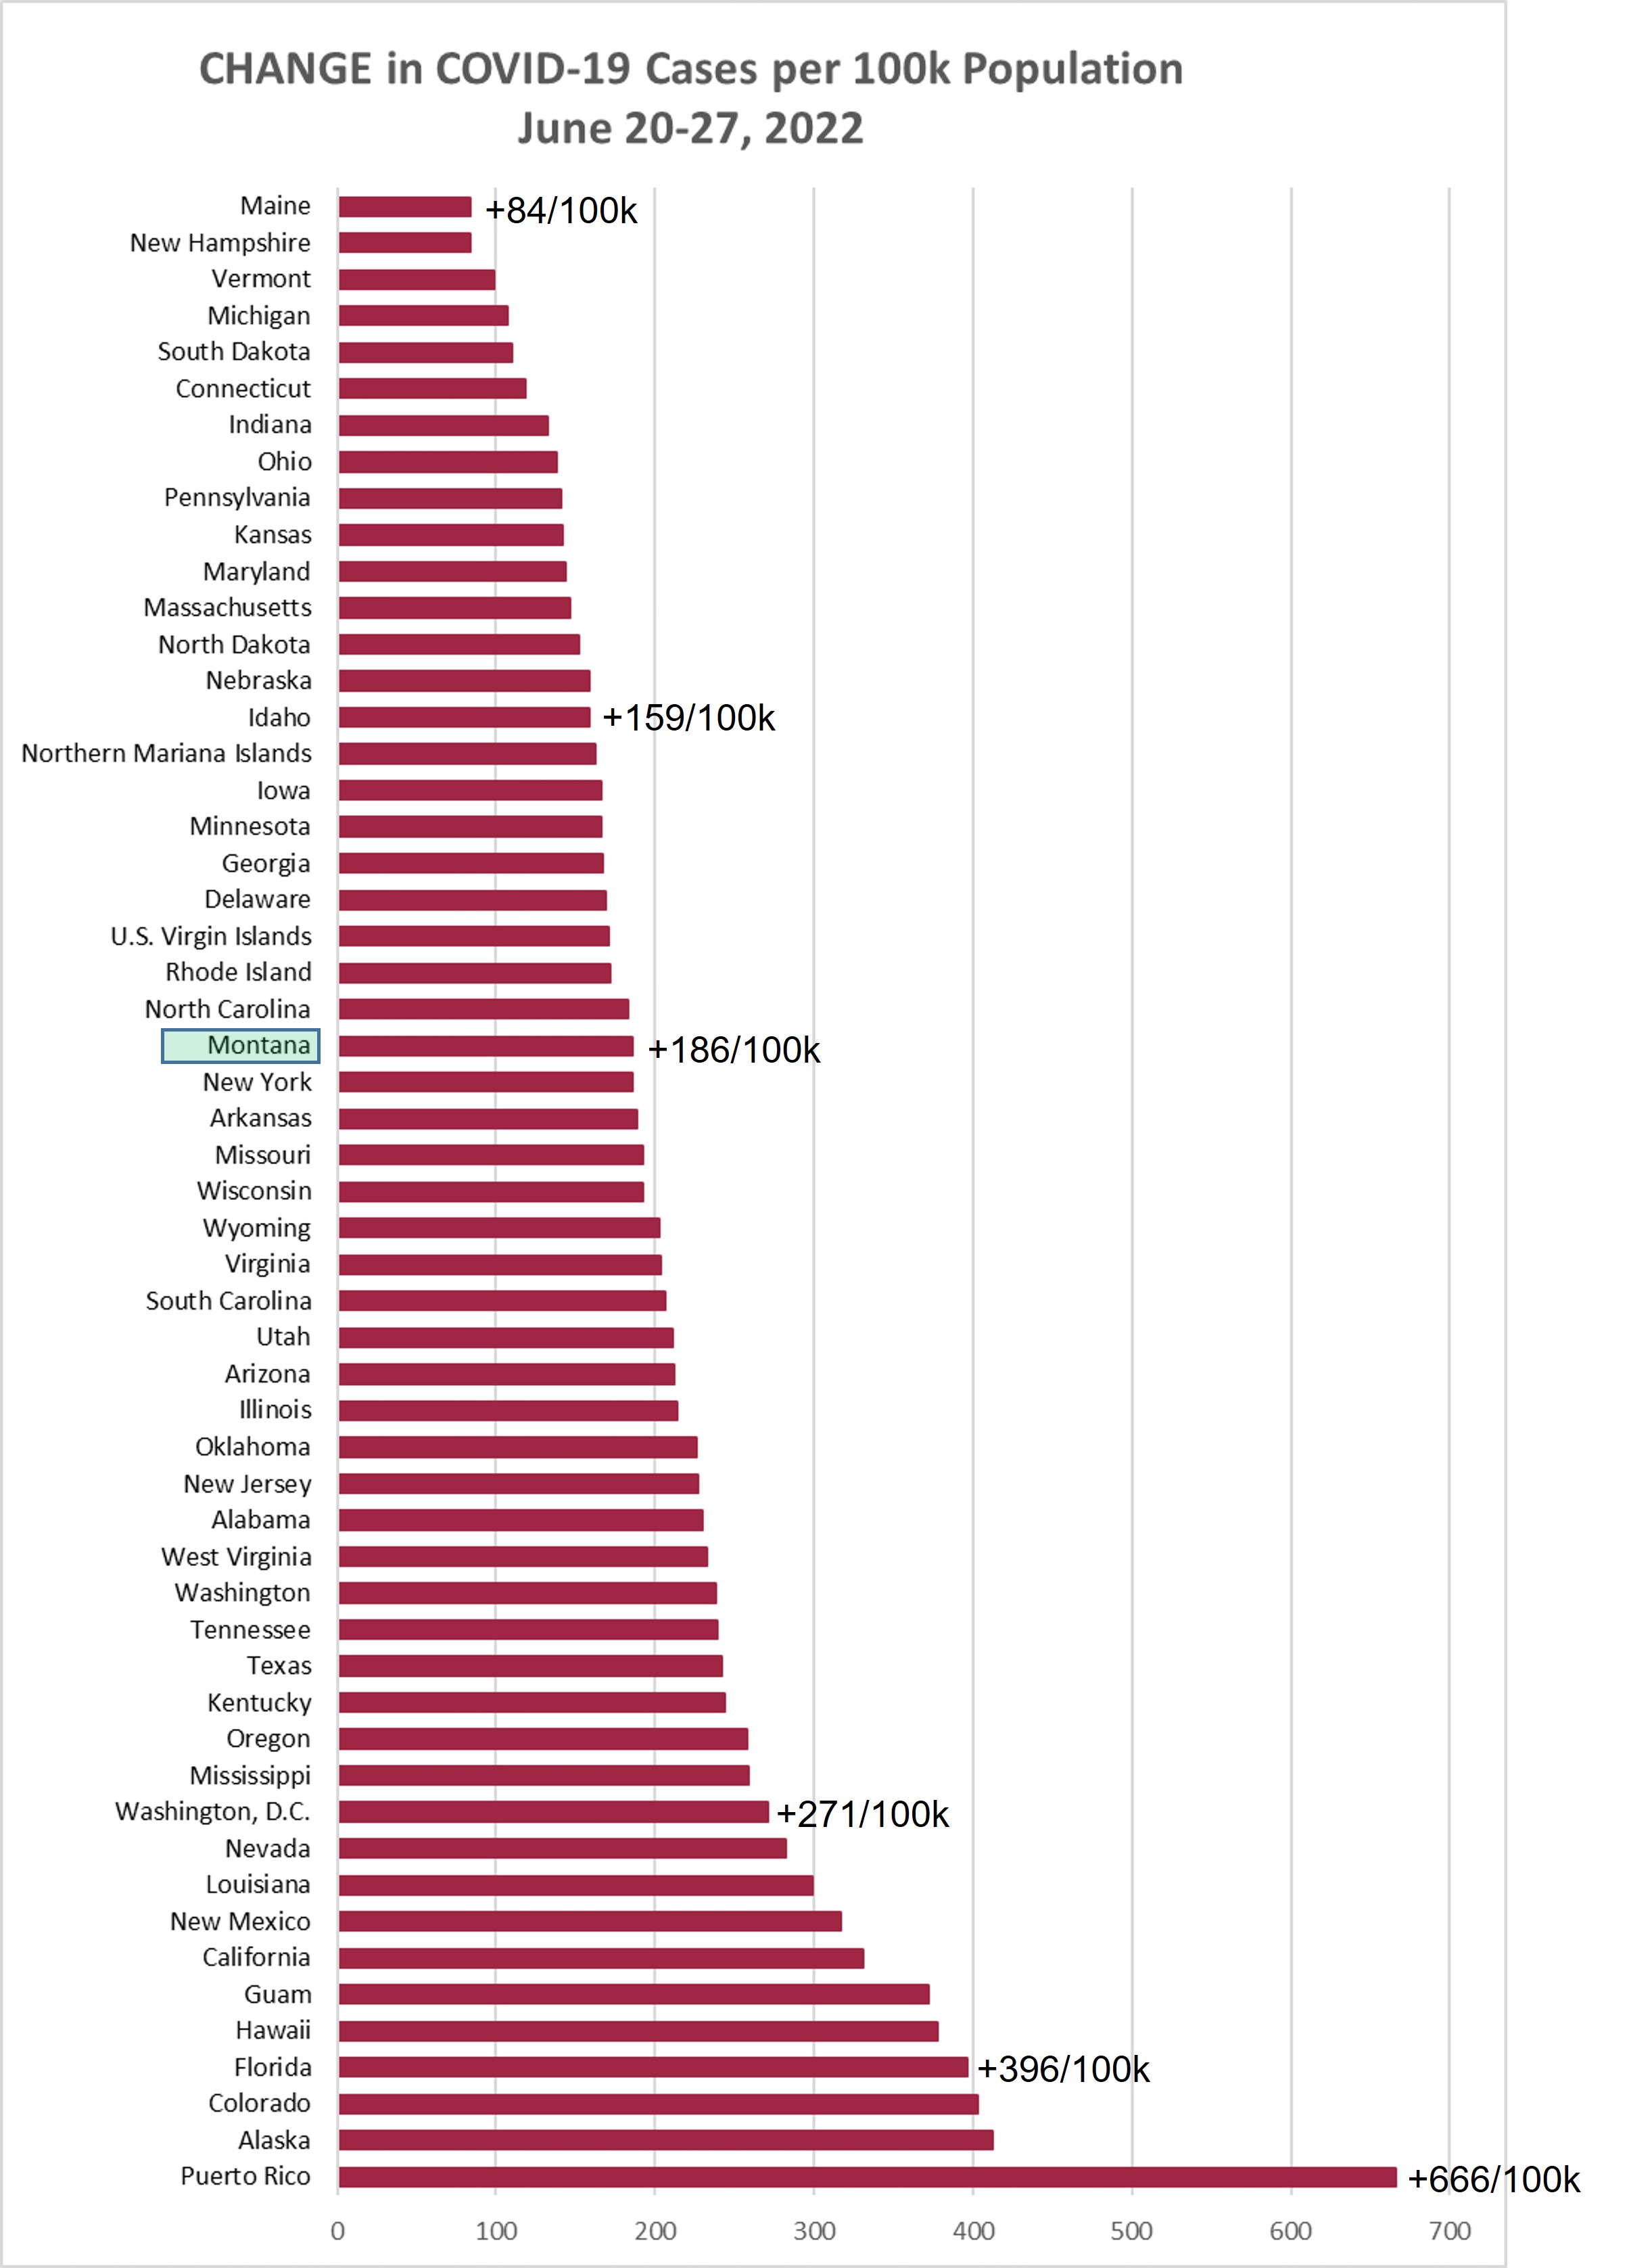
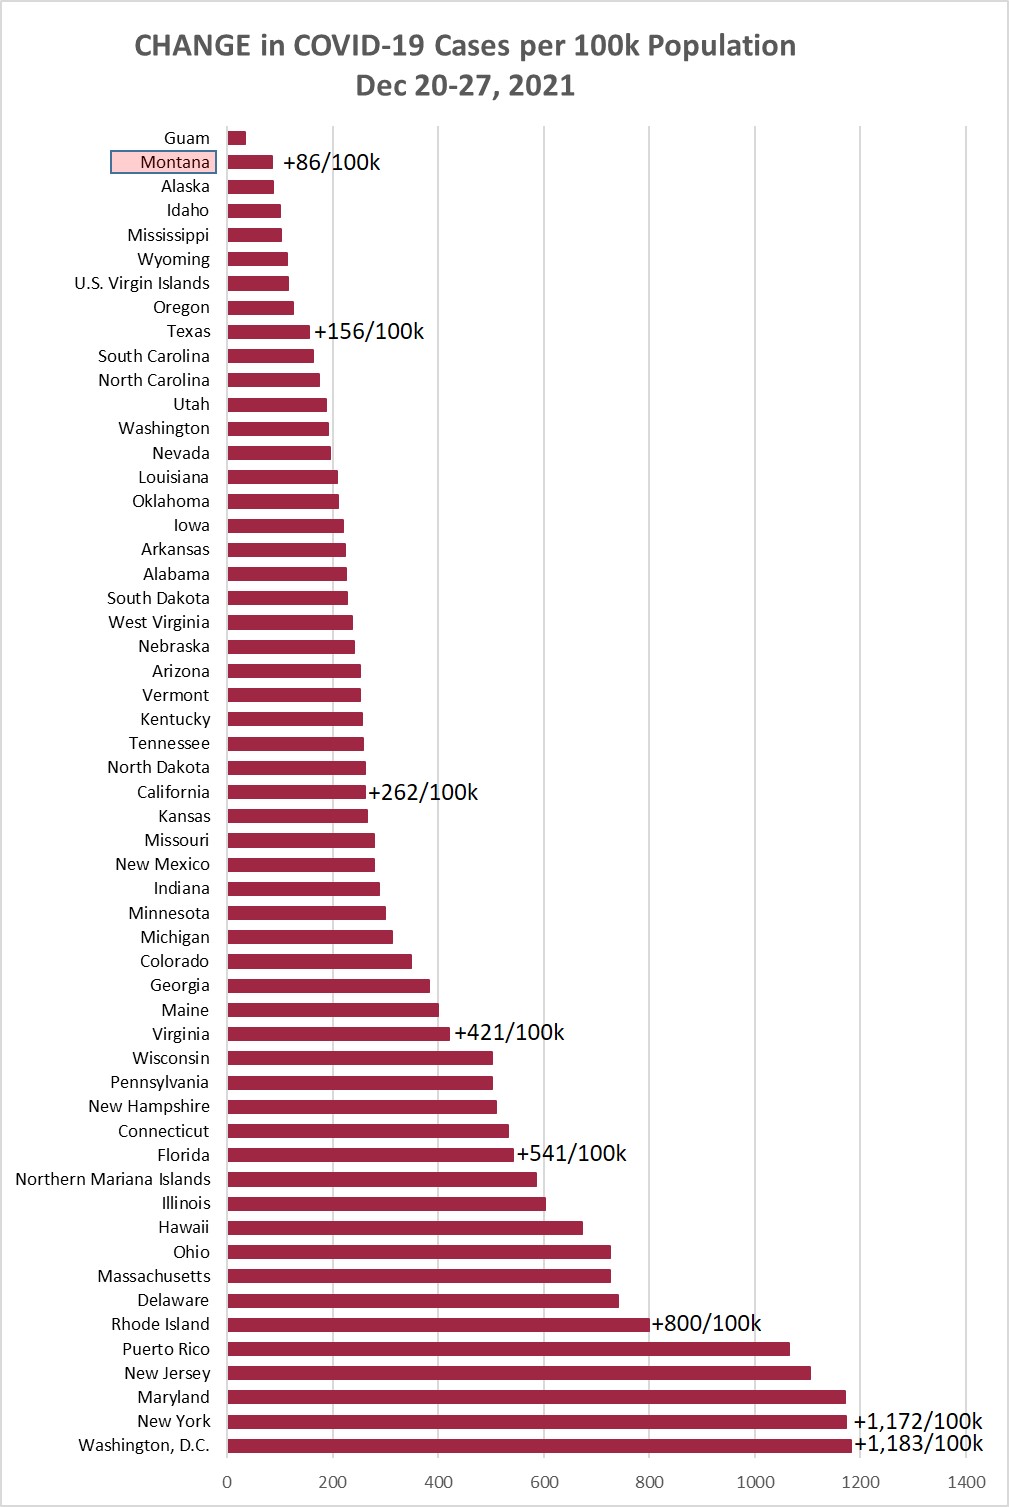
Chart 1 shows the change in cases per 100,000 population as of this morning (December
27, 2021) compared to the cases per 100,000 on December 20, 2021. Montana was up +86/100k
this week, compared to +97/100k the prior week, and +139/100k the week before that.
Two weeks in a row below 100 newly reported cases per 100k.
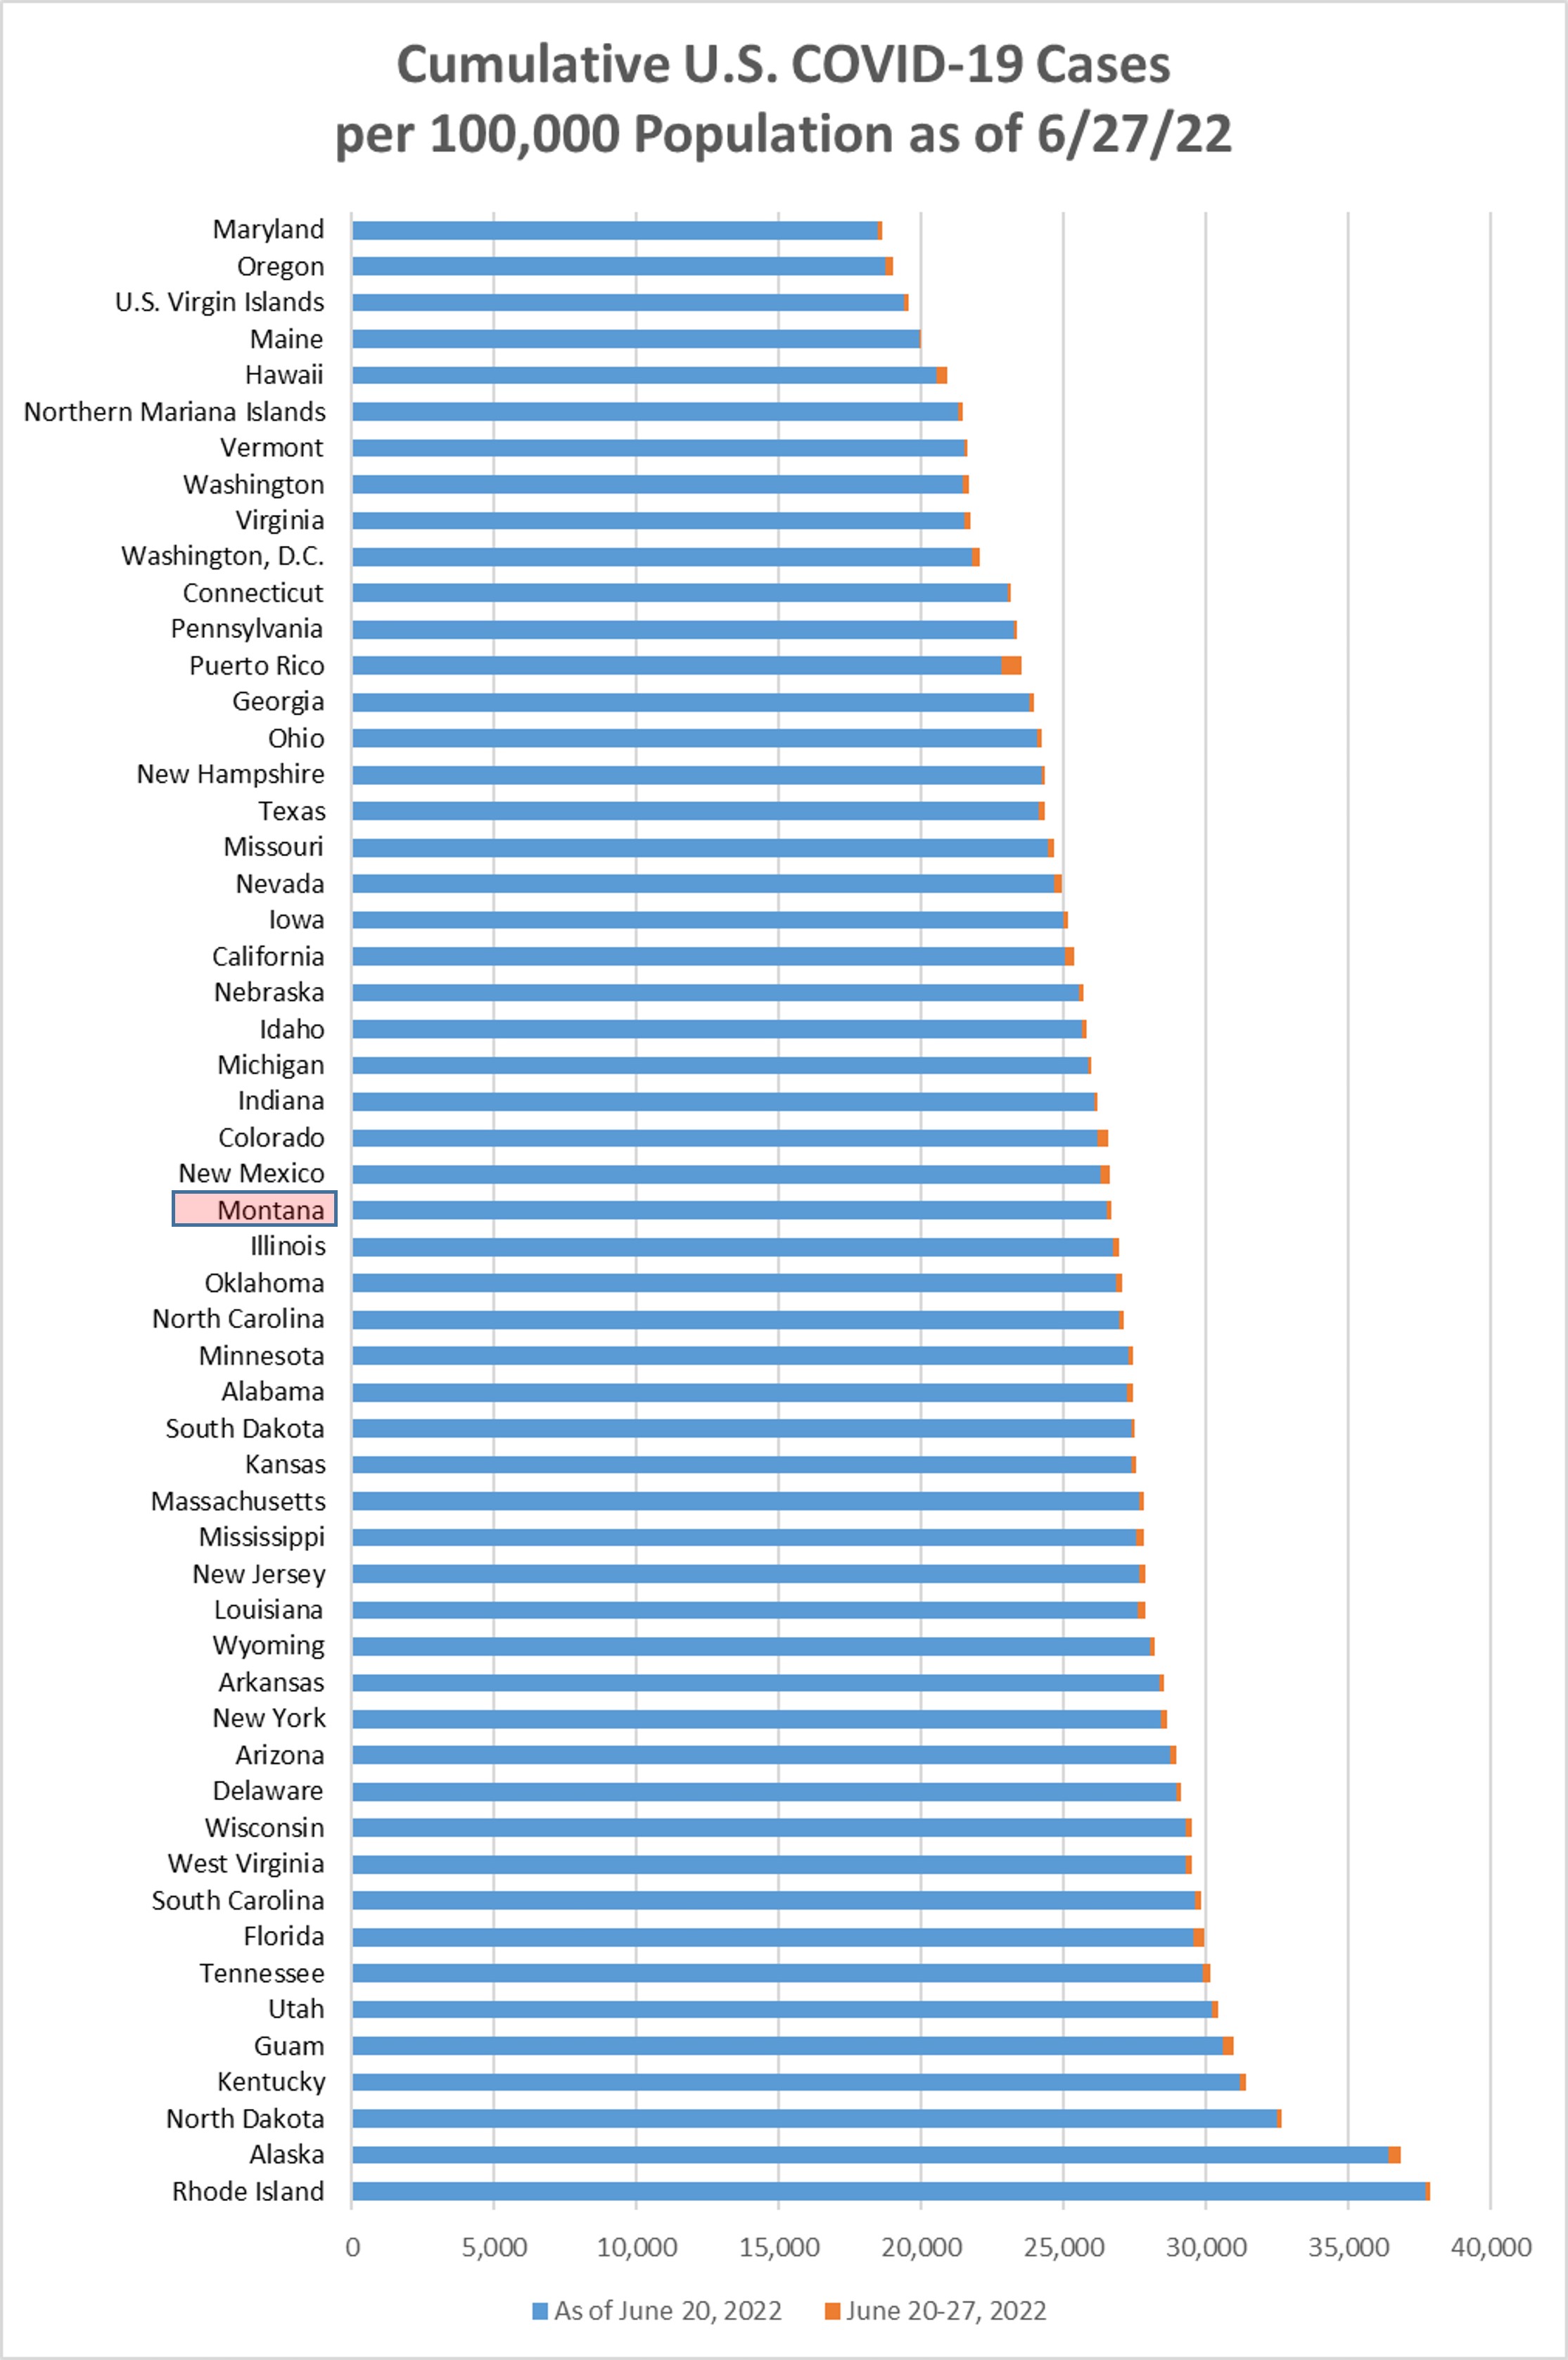
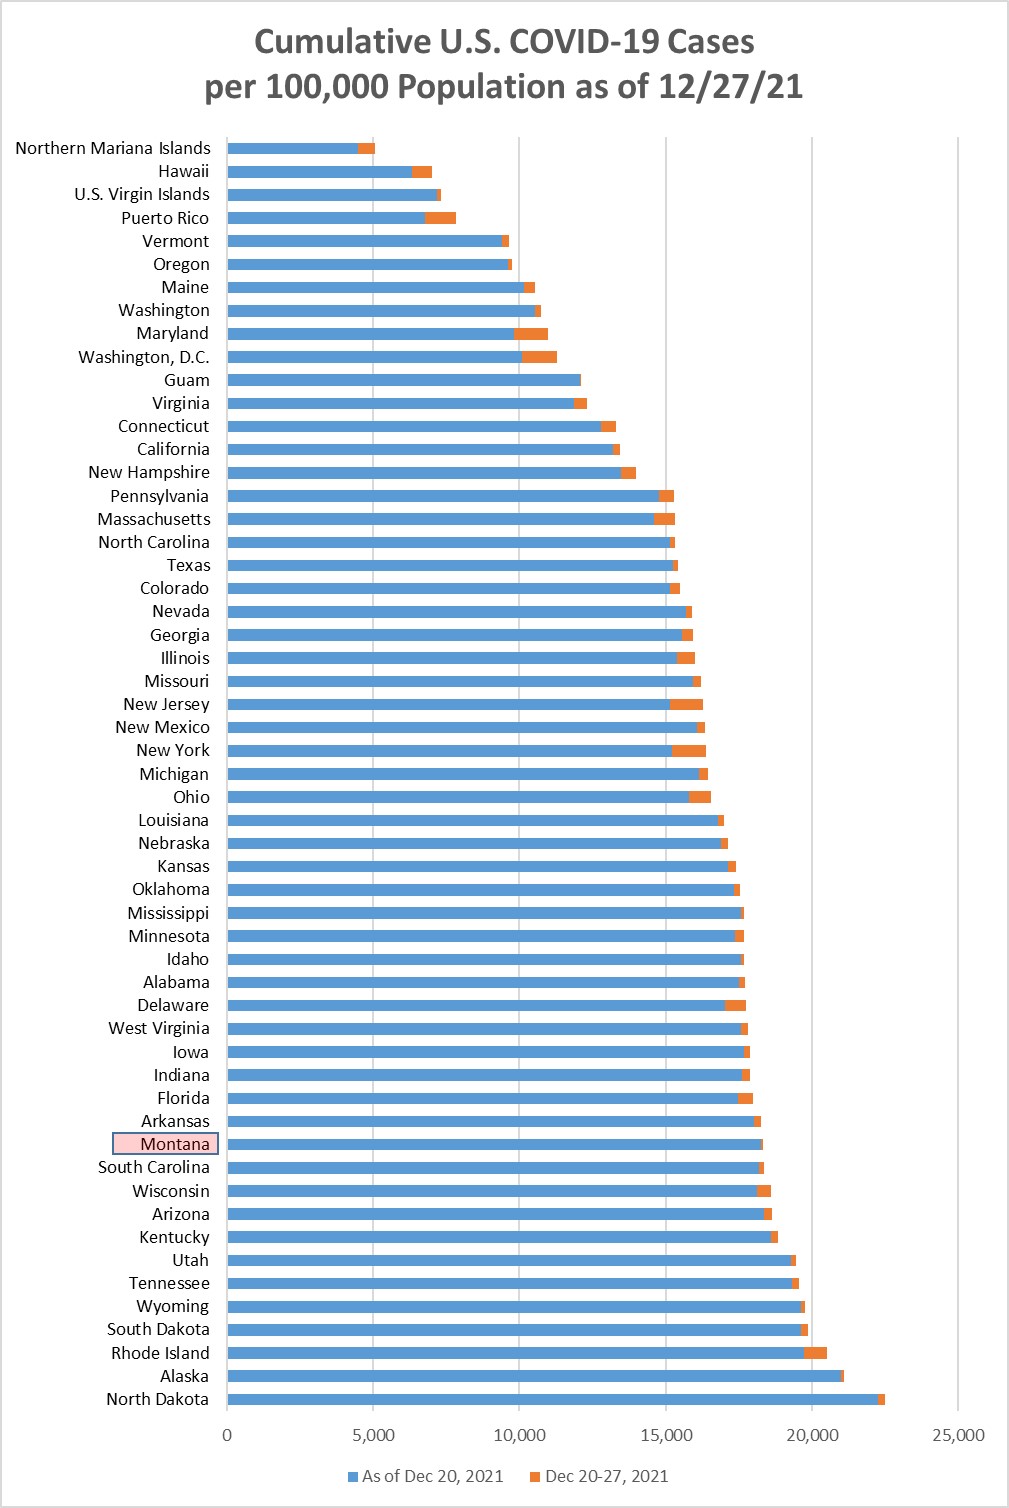
Chart 2 shows the same information as Chart 1, but with the overall cumulative cases
per 100k in each state to December 27. Montana moved down to position 12 this week,
being passed by Wisconsin and South Carolina.
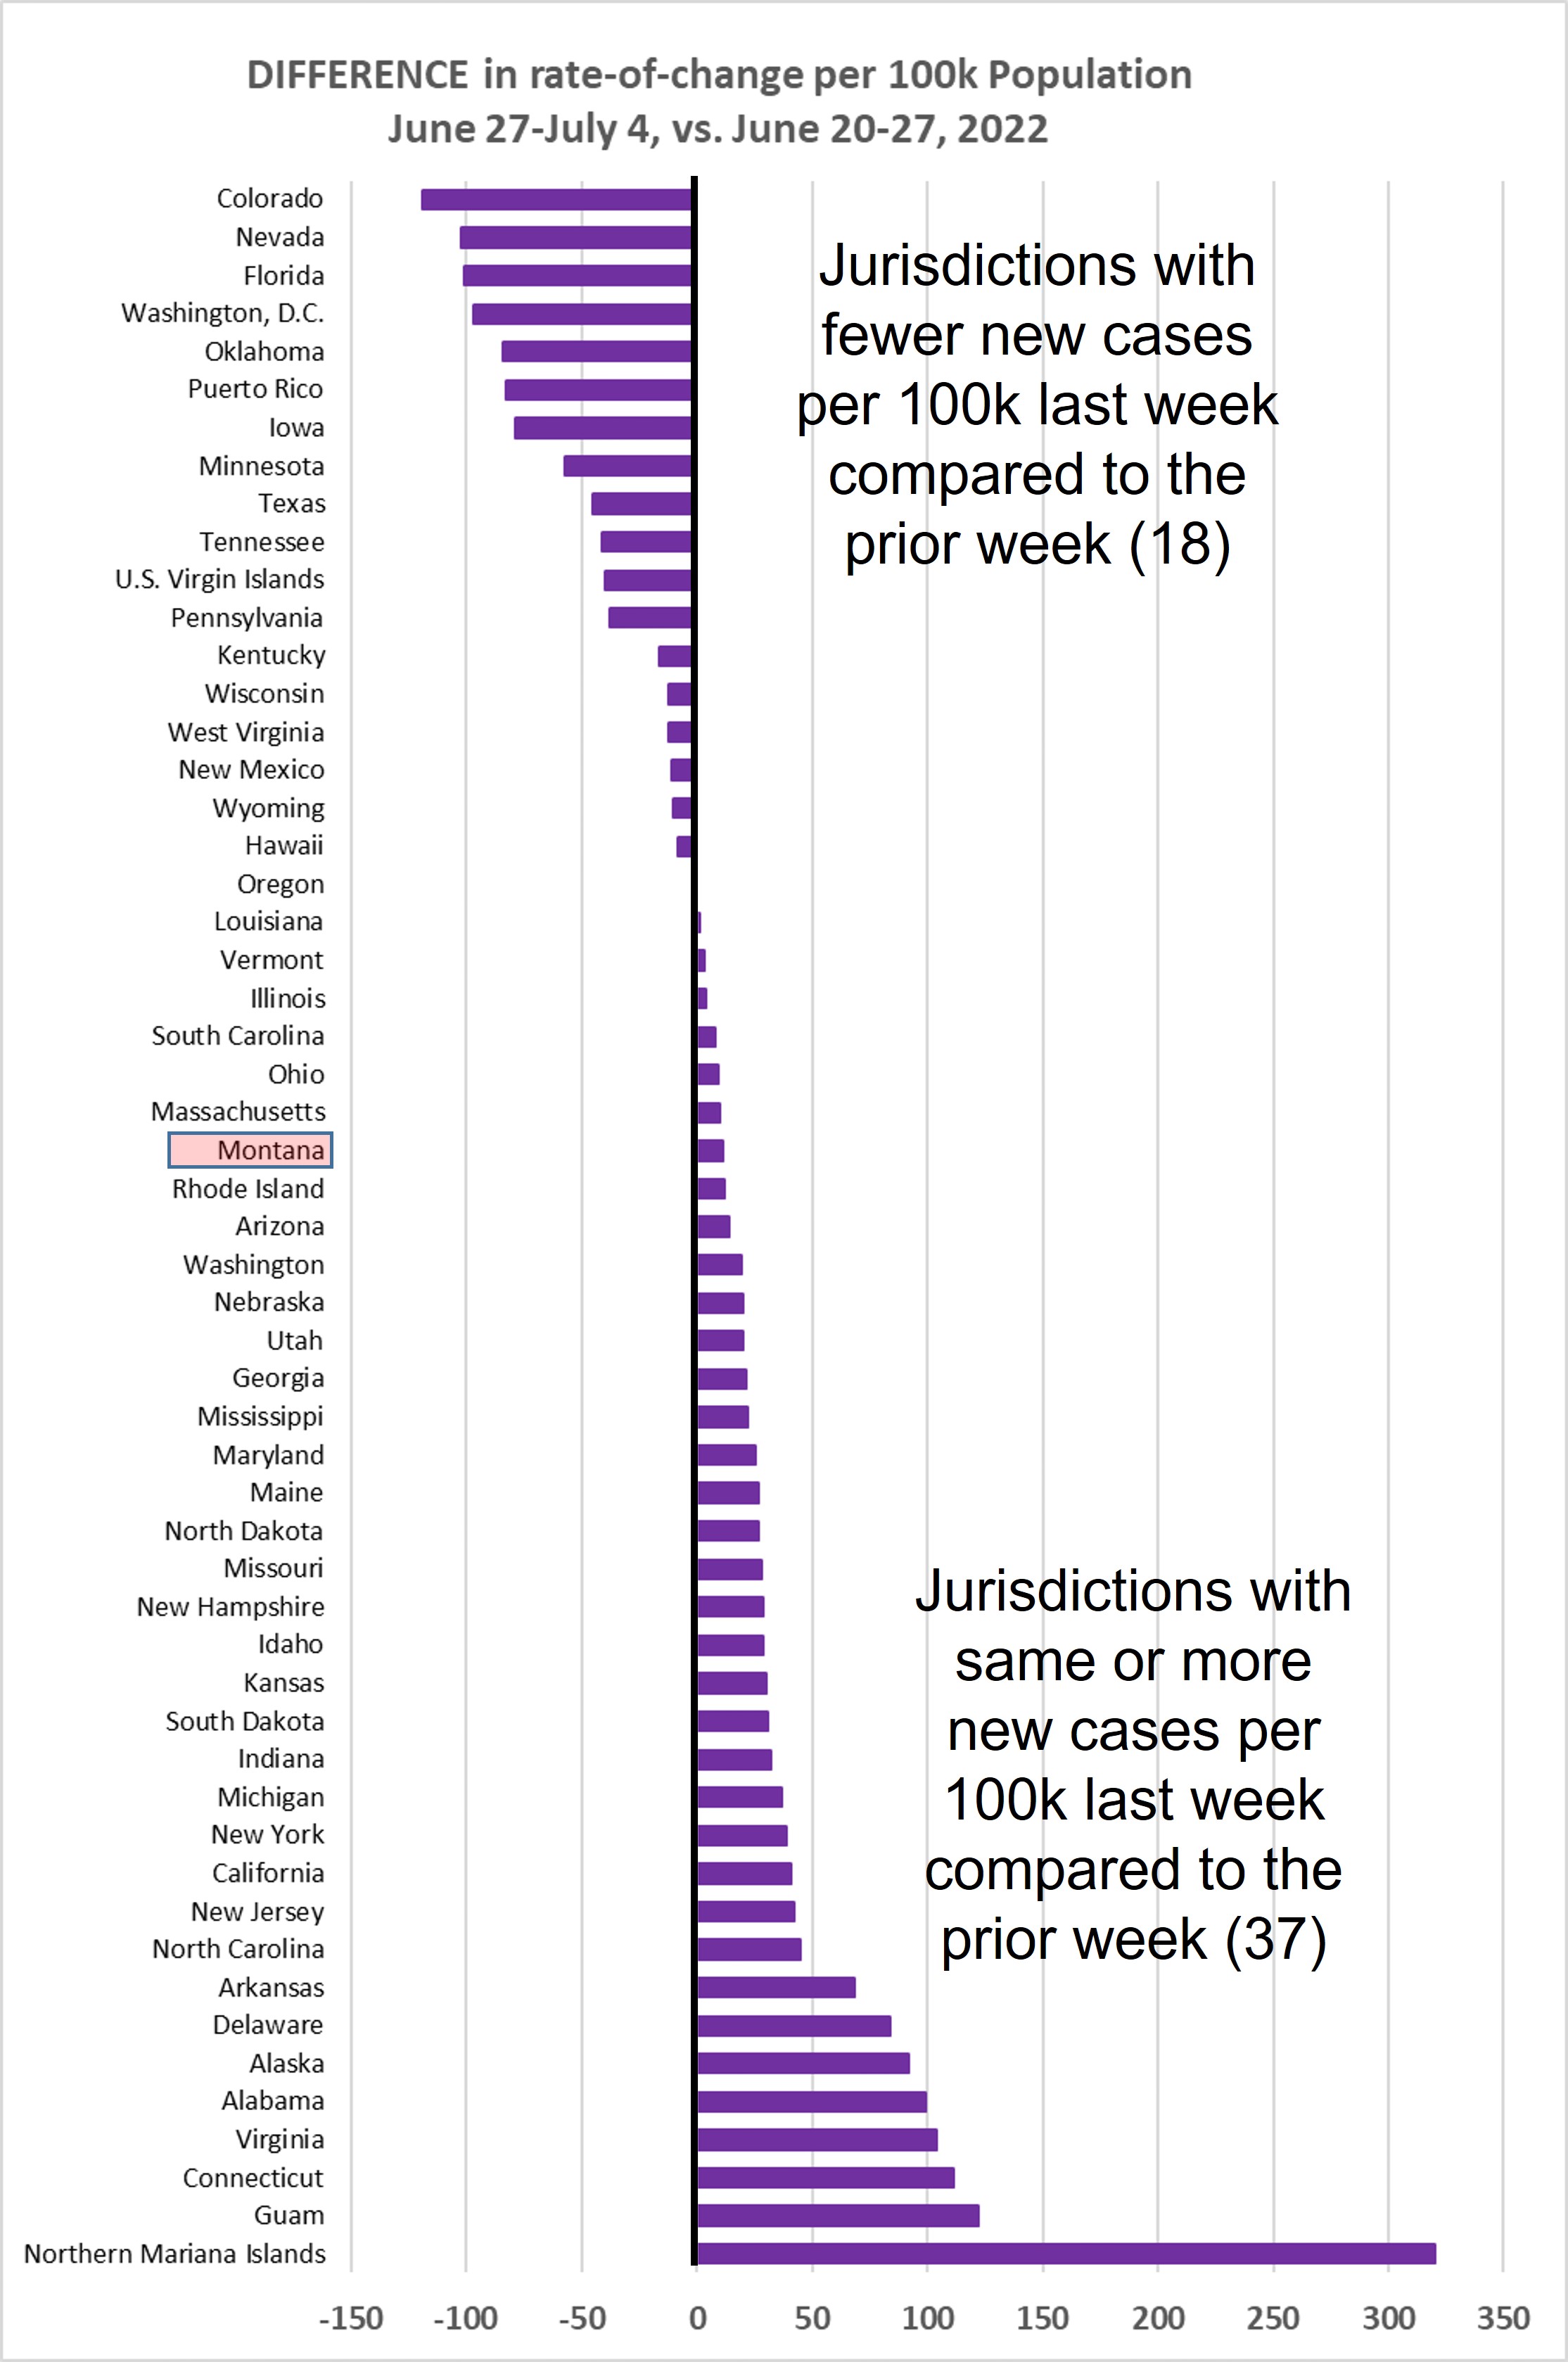
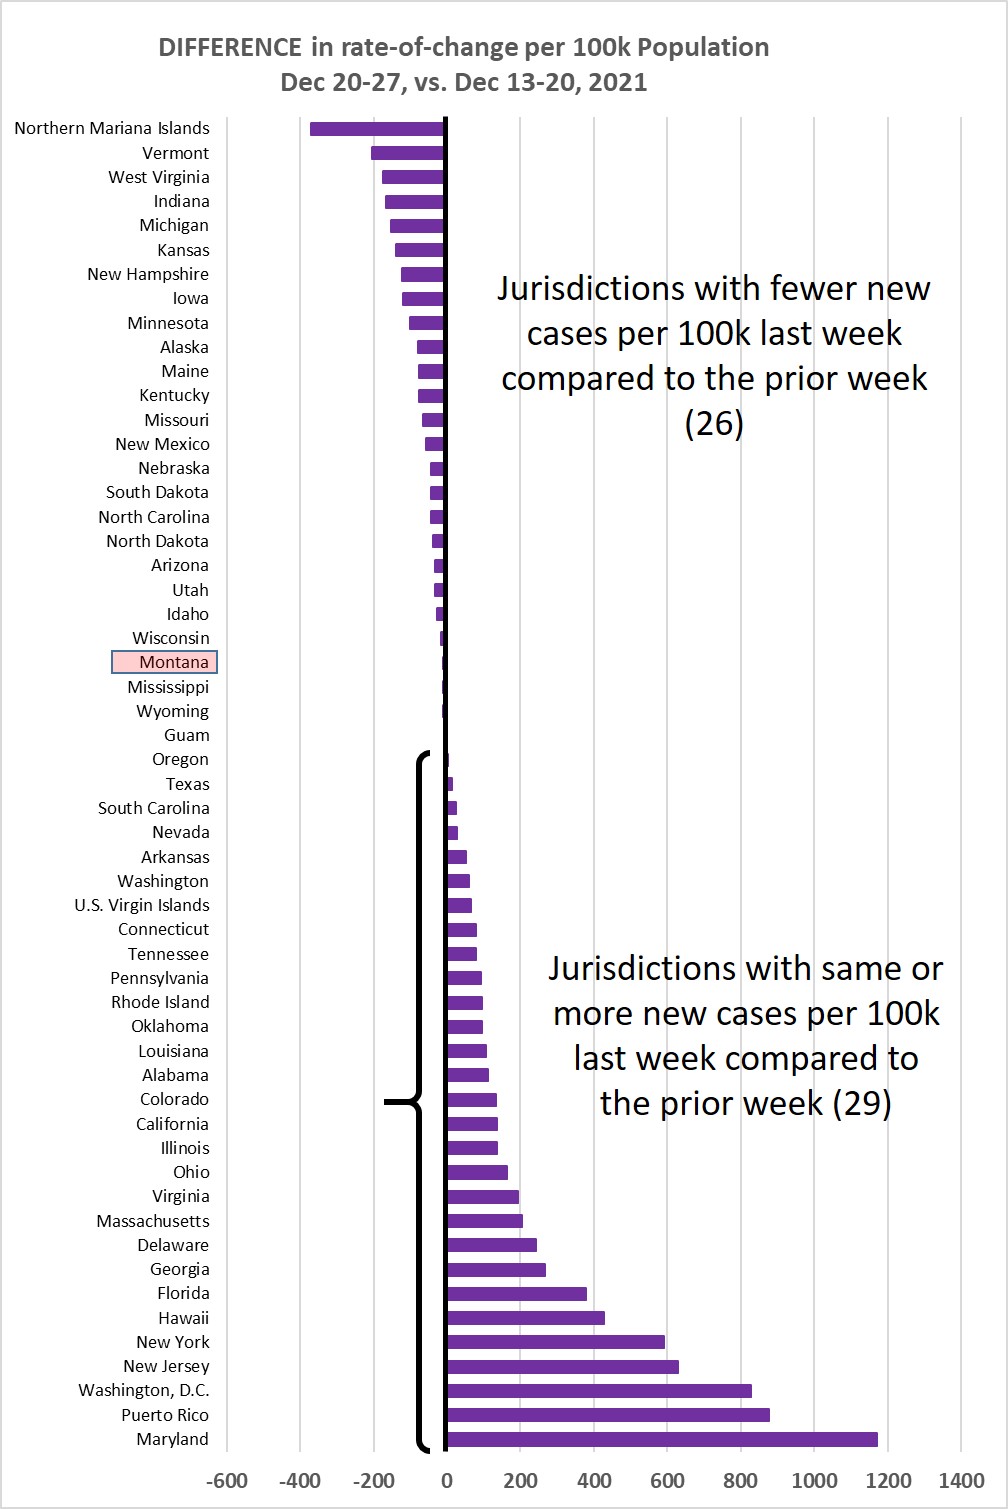
Chart 3 shows the difference in weekly new cases per 100k population for Dec 20-27,
vs. Dec 13-20, 2021. This past week 29/55 jurisdictions (53%) showed a higher rate
of new cases.
Chart 4 shows the percentage of the population in each jurisdiction having received
1 or 2 Covid-19 vaccination shots. This is sorted by the fraction that have received
2 shots--or one shot of the J&J vaccine. Average across the 55 jurisdictions is 60.67%
being fully immunized, for a weekly increase of about 0.11% (weekly increase the prior
week was 0.69%).

Monday, December 20, 2021
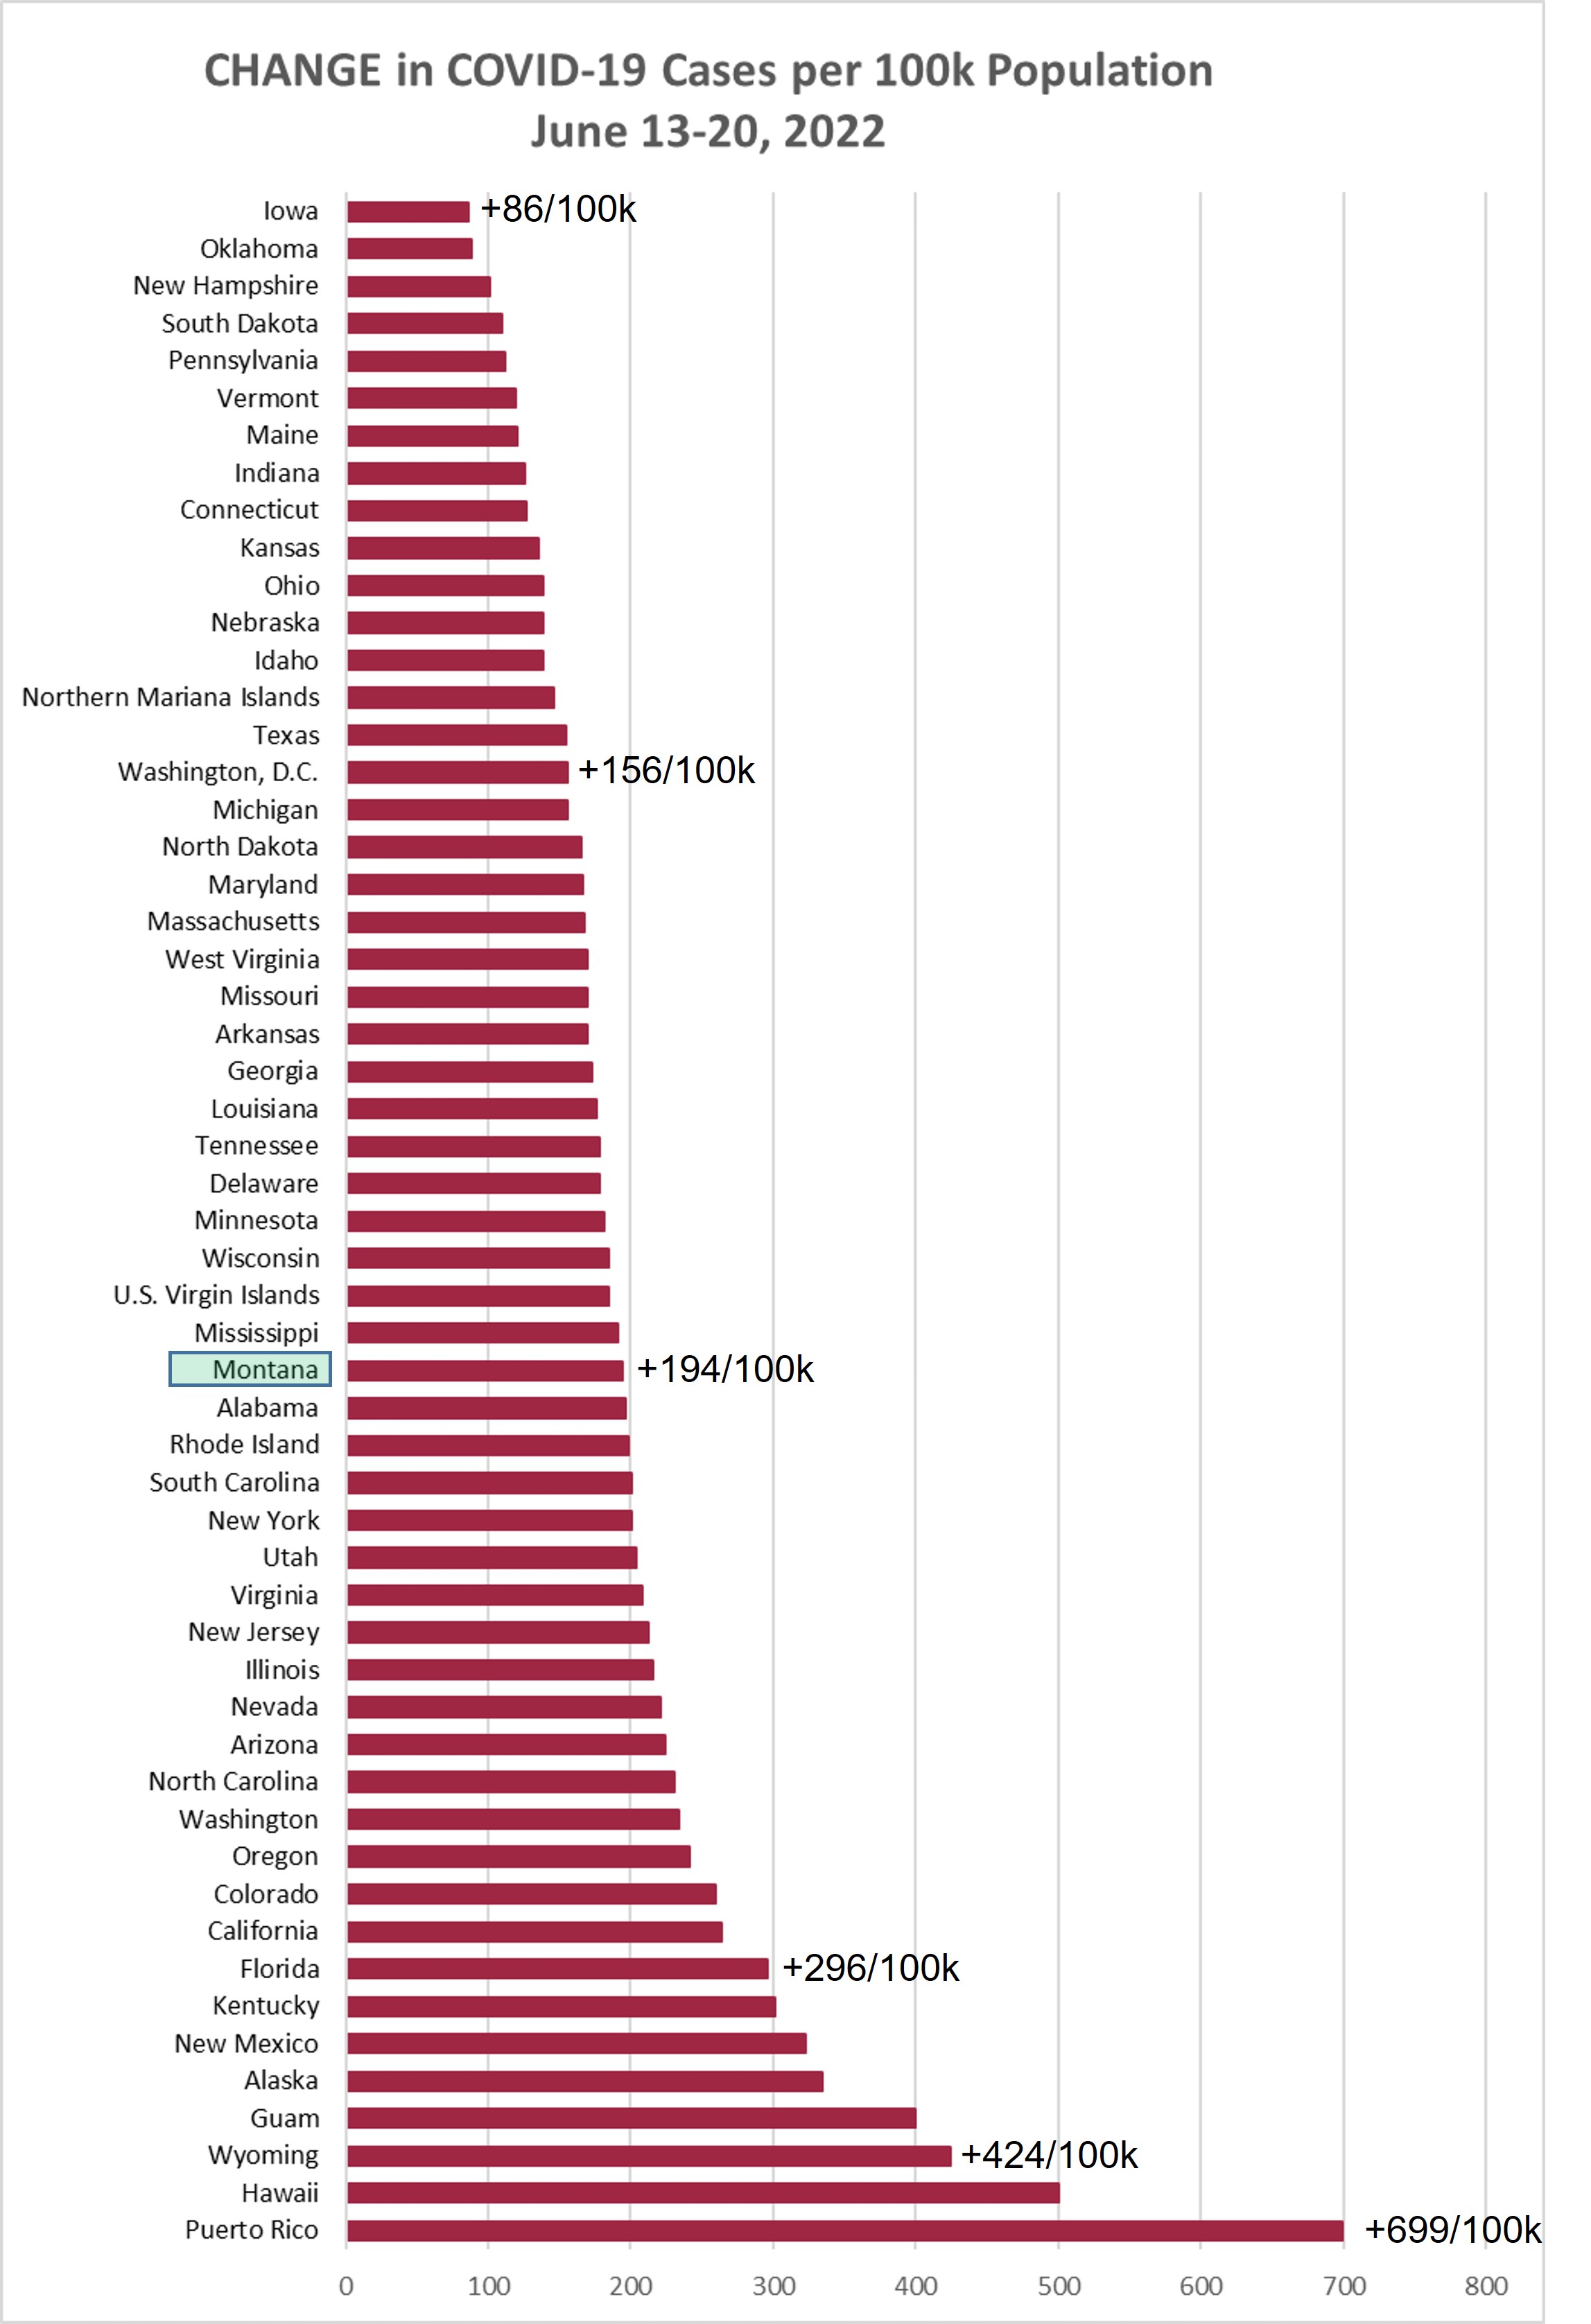
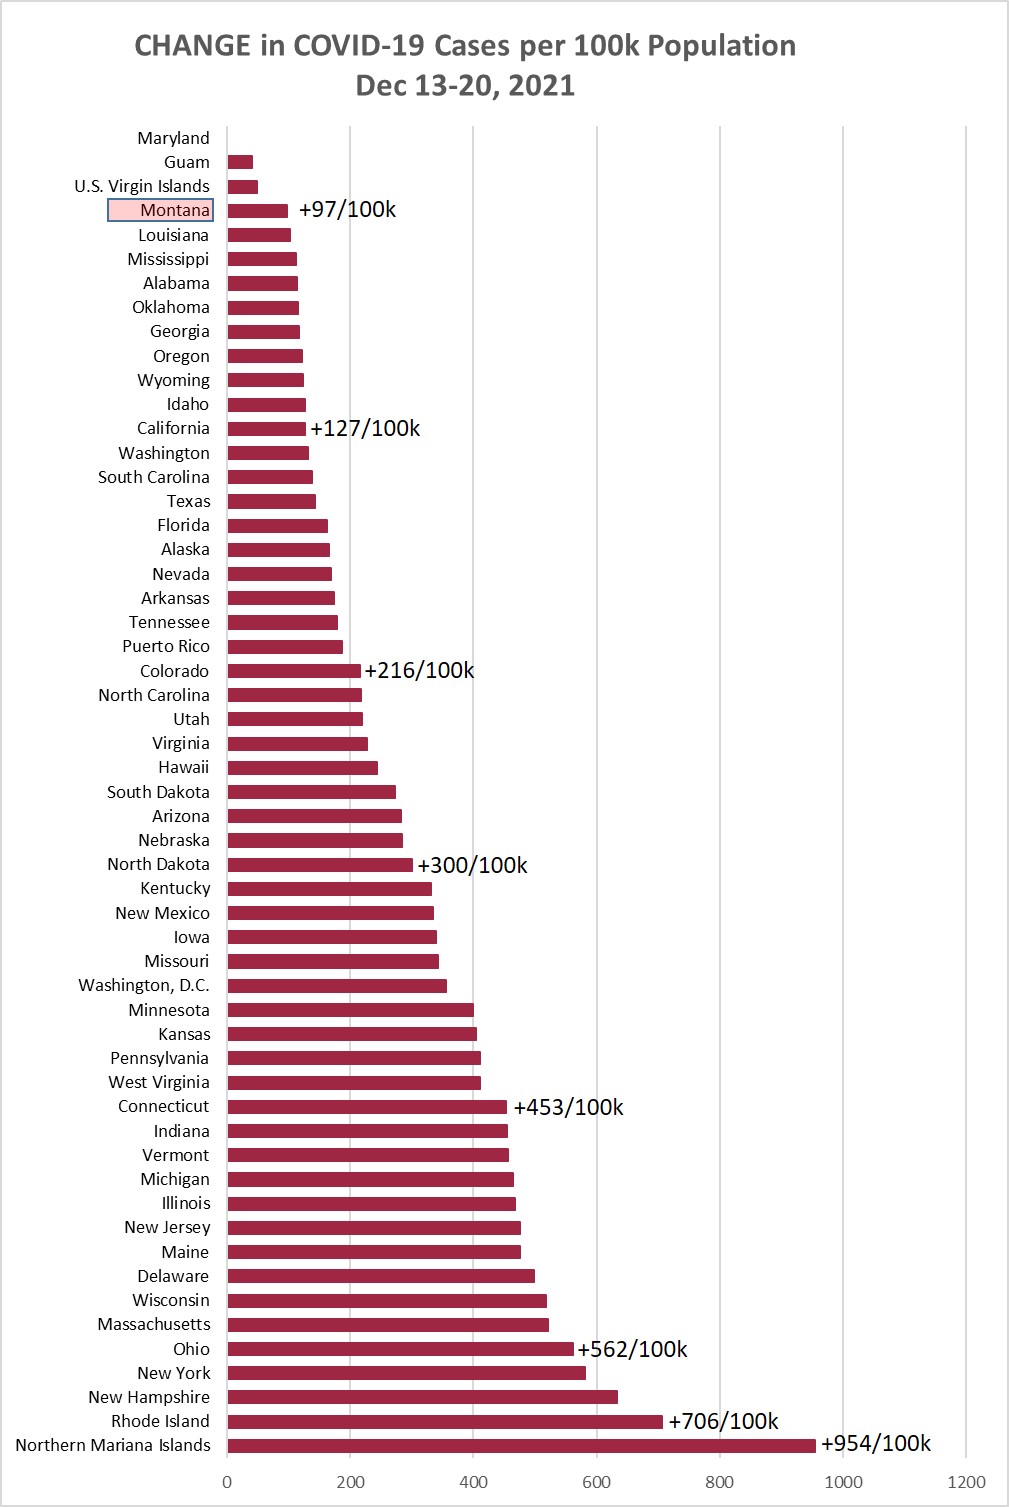
Chart 1 shows the change in cases per 100,000 population as of this morning (December
20, 2021) compared to the cases per 100,000 on December 13, 2021. Montana was up +97/100k
this week, compared to +139/100k the prior week, and +209/100k the week before that.
This is the first week Montana has been under 100 new cases per 100k since July. How
long can this low rate last?
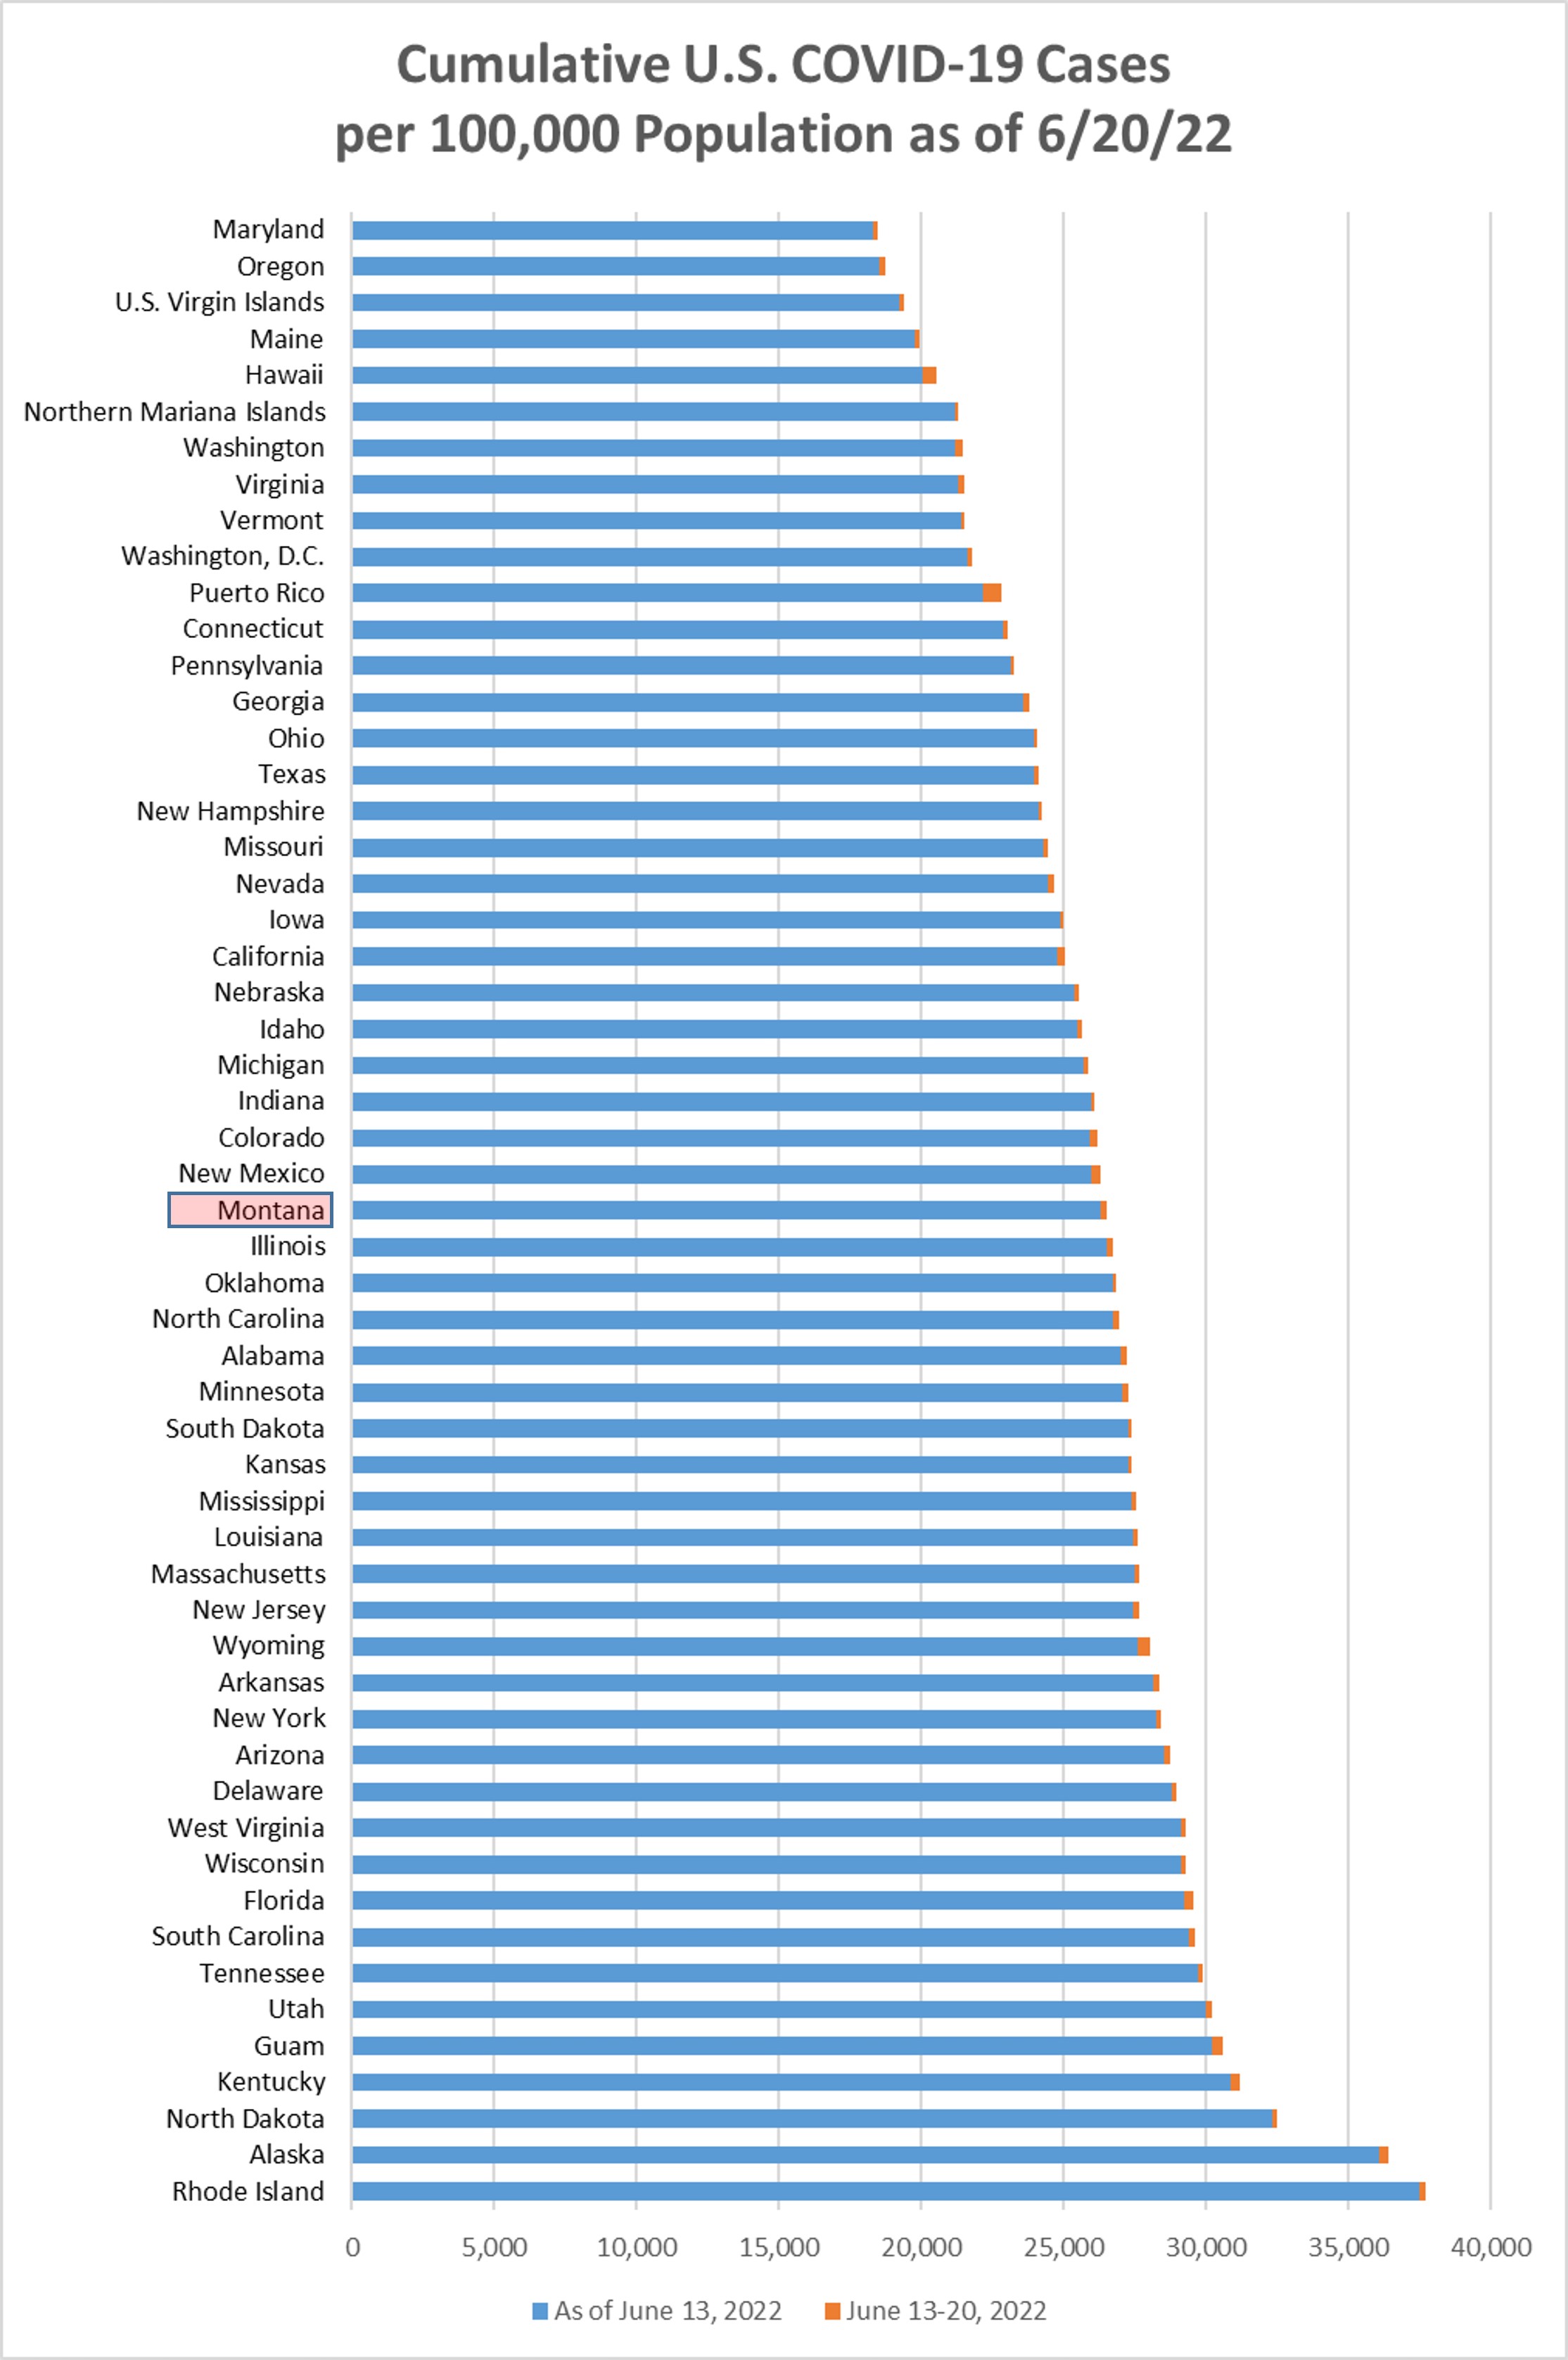
Chart 2 shows the same information as Chart 1, but with the overall cumulative cases
per 100k in each state to December 20. Montana moved down to position 10 this week,
being passed by Arizona.
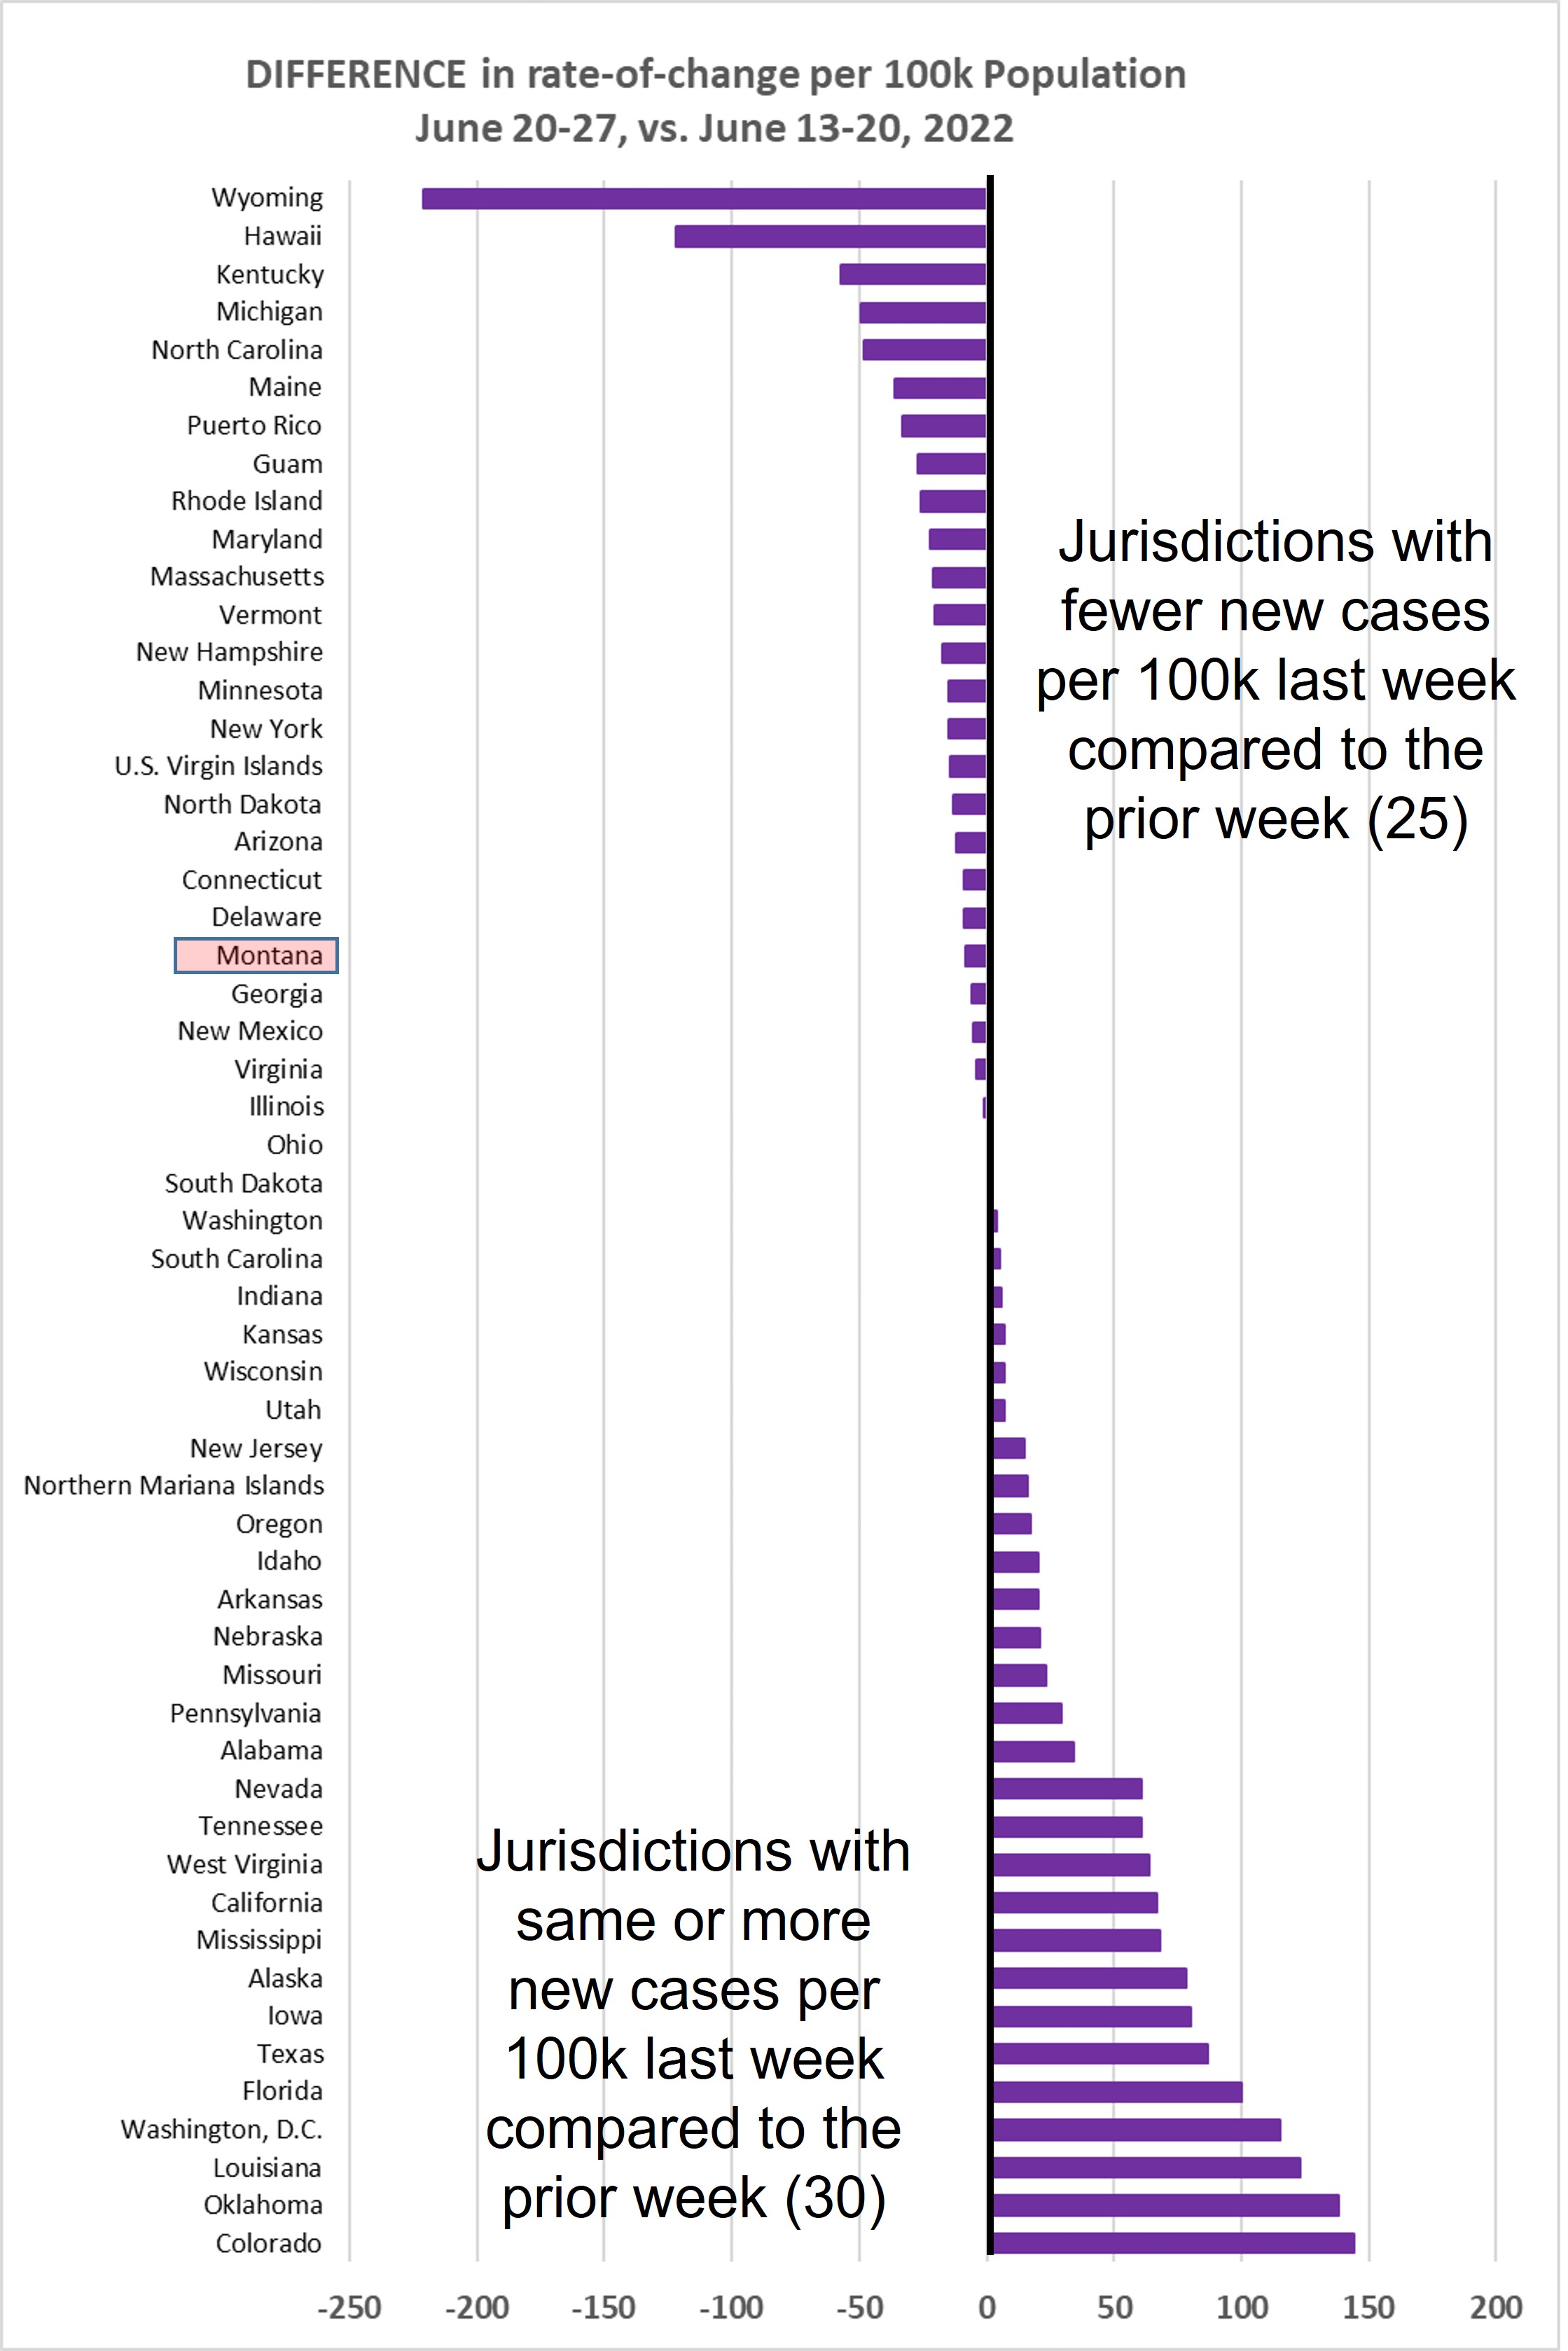
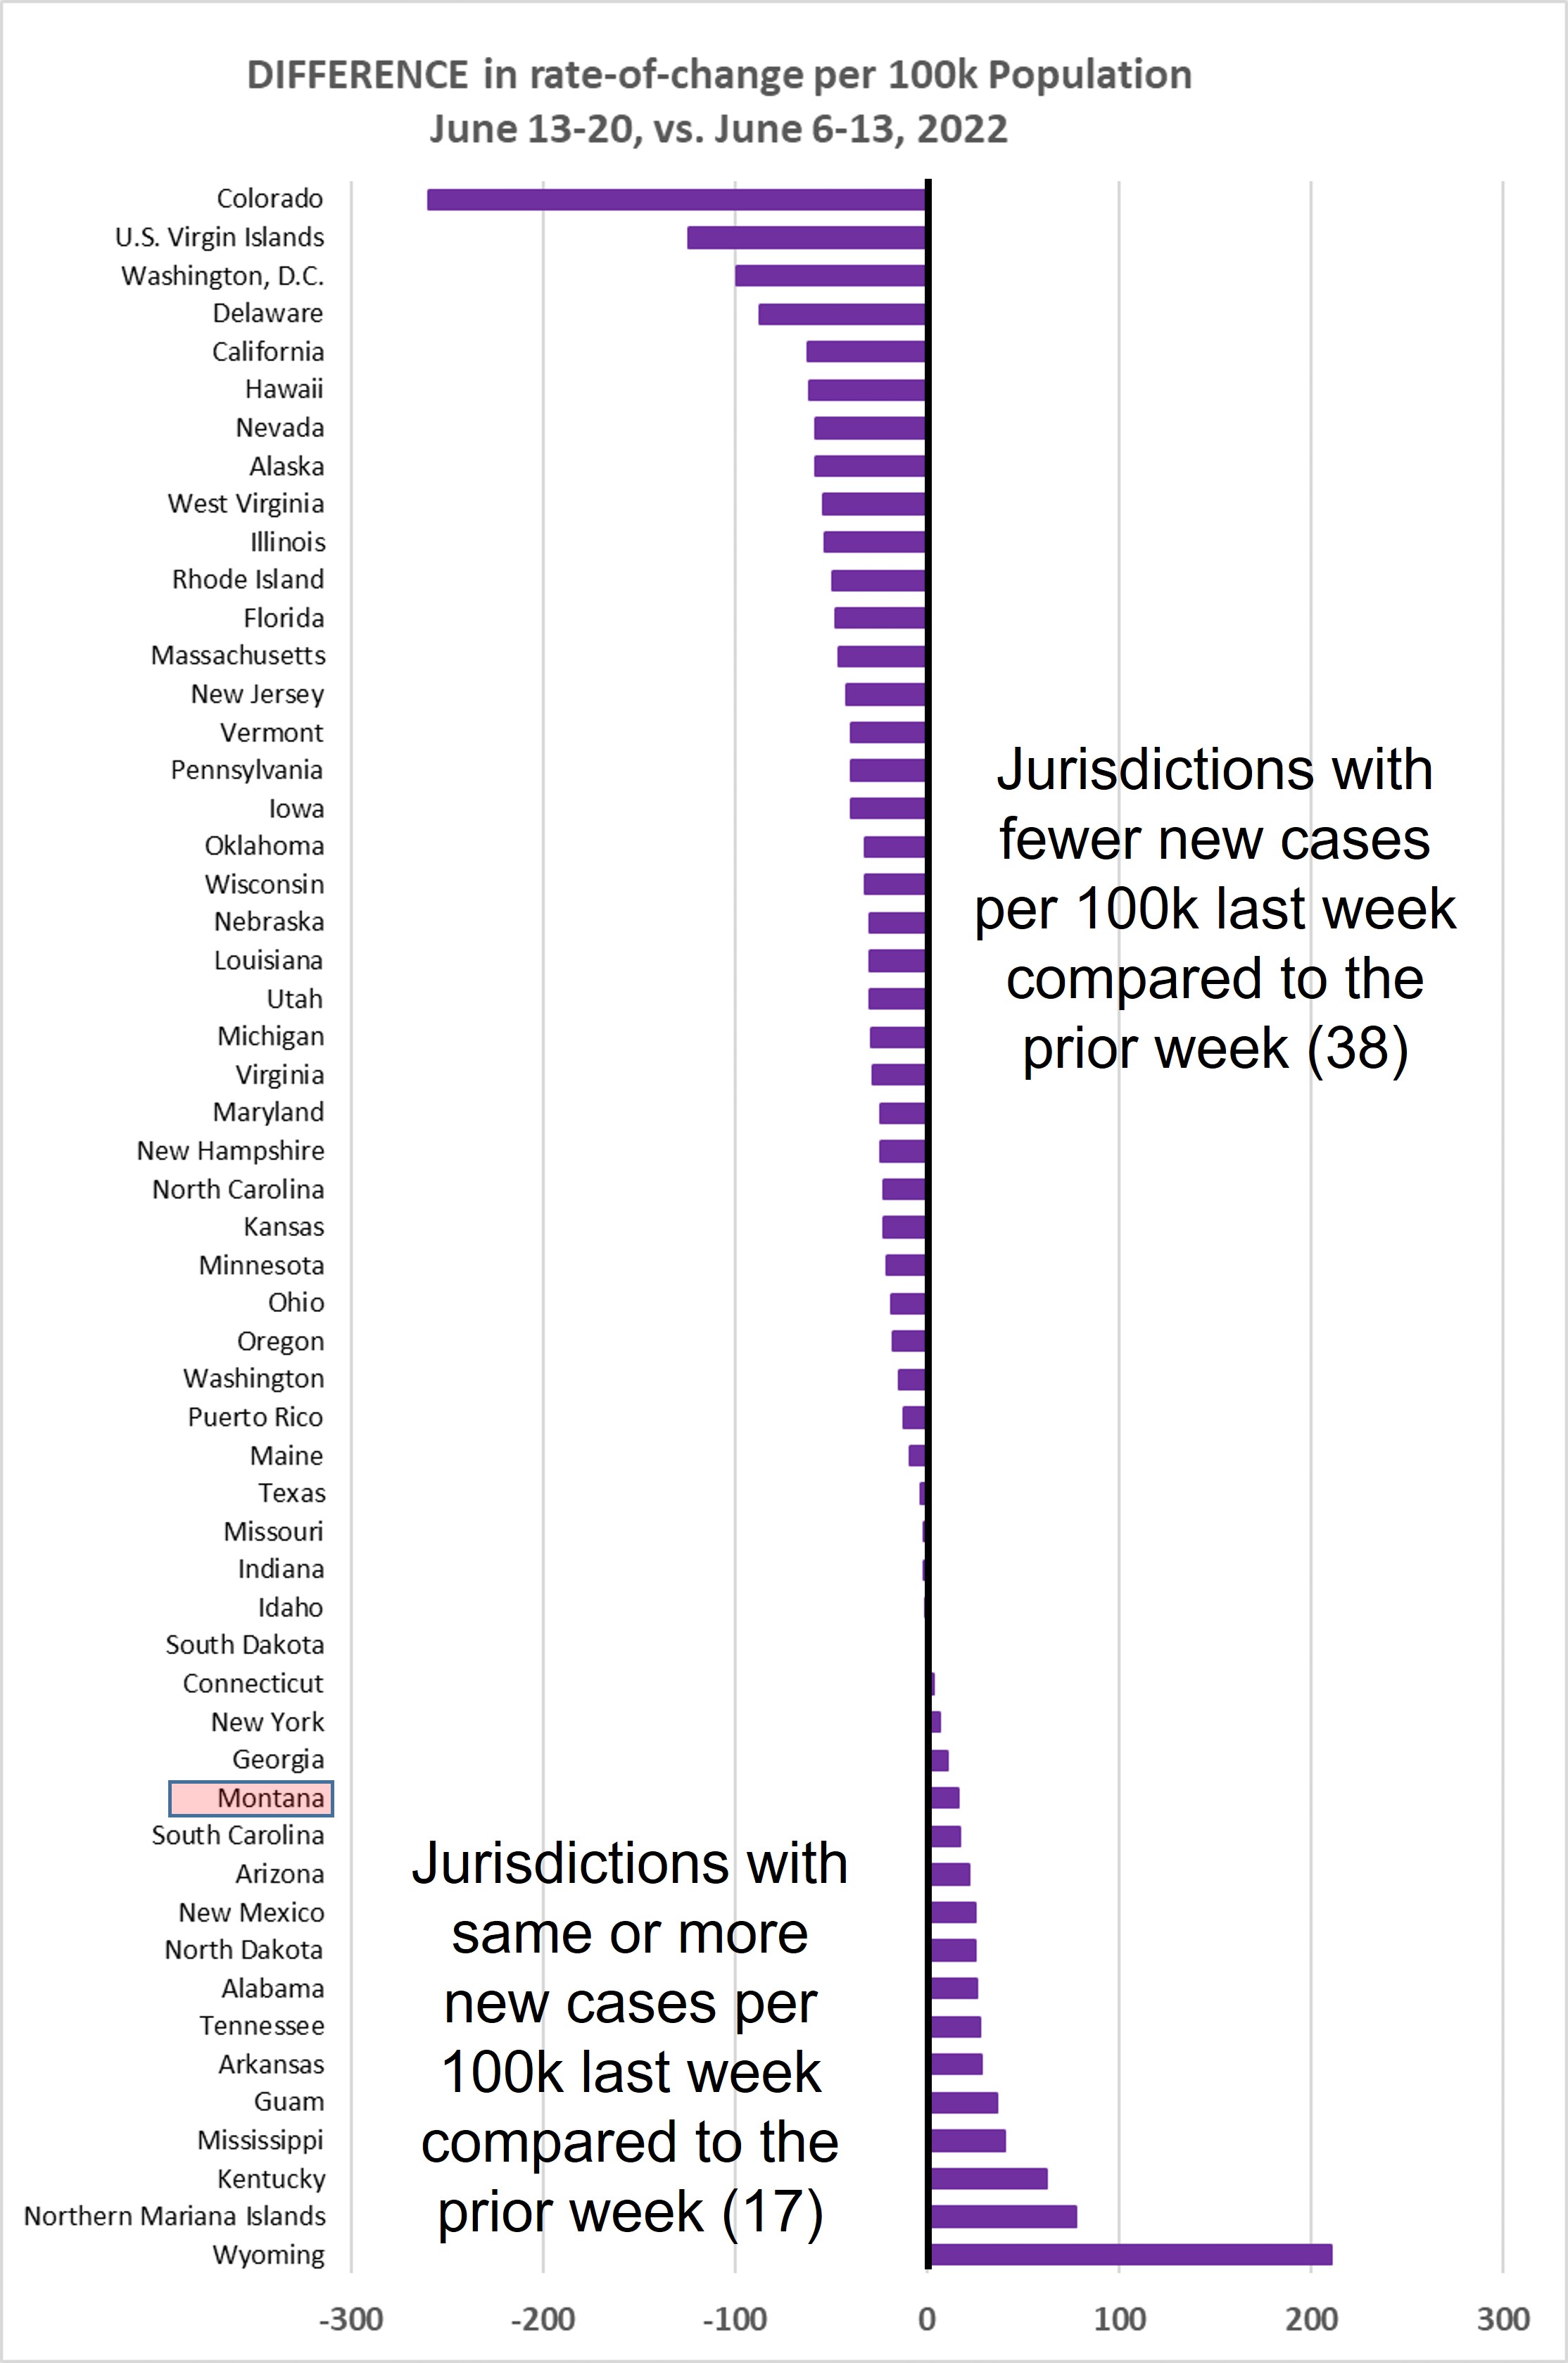
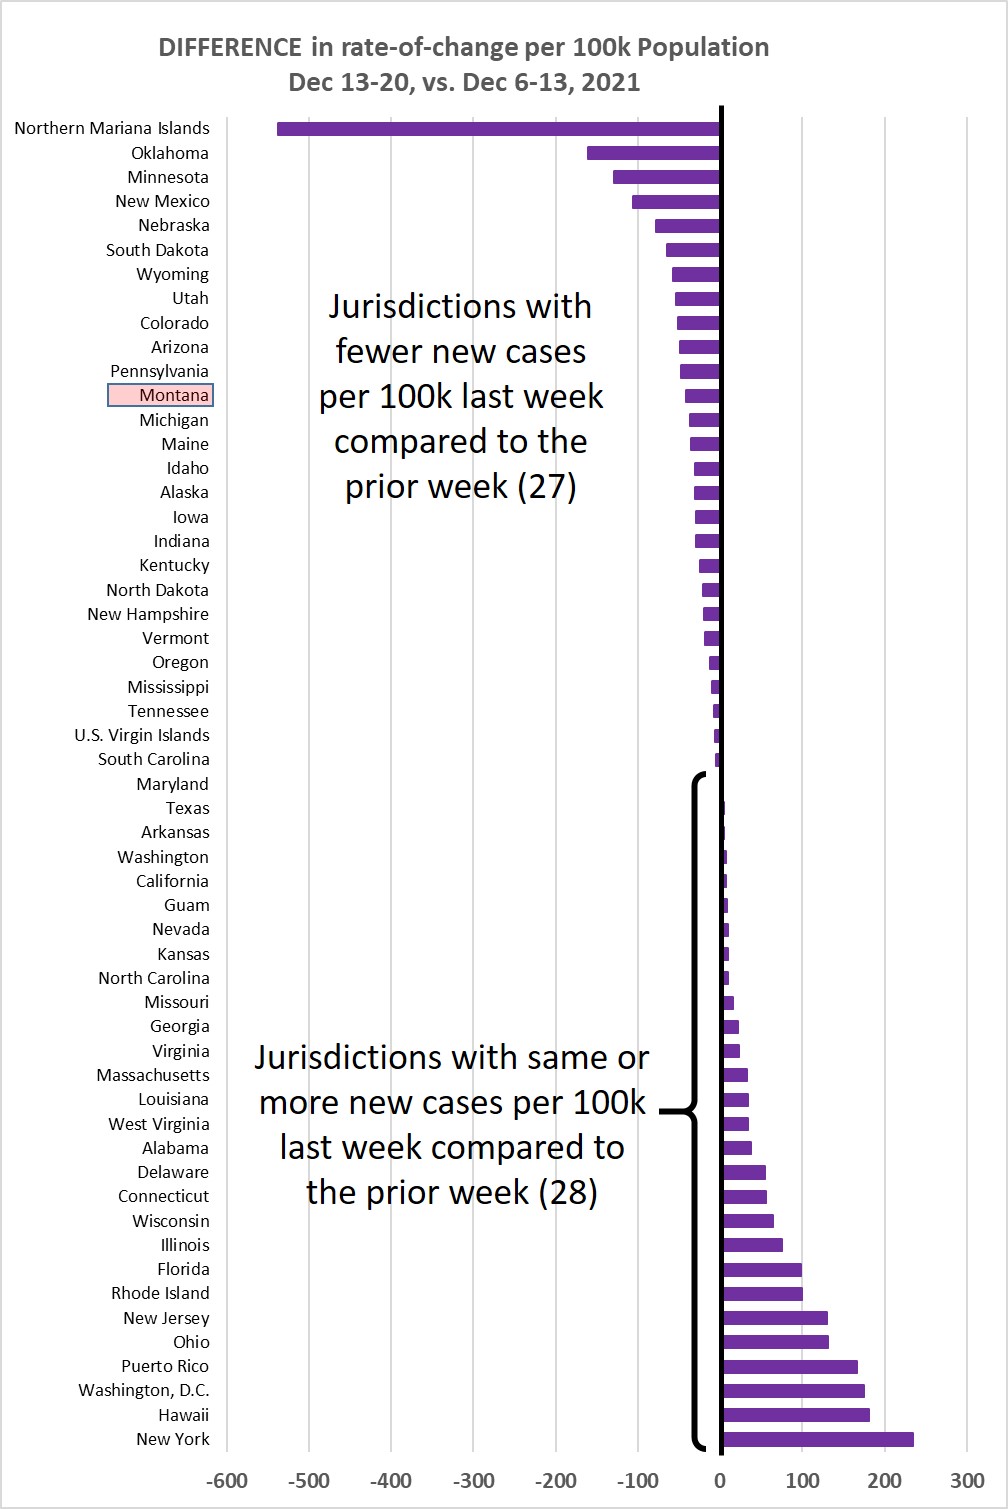
Chart 3 shows the difference in weekly new cases per 100k population for Dec 13-20,
vs. Dec 6-13, 2021. This past week 28/55 jurisdictions (51%) showed a higher rate
of new cases.
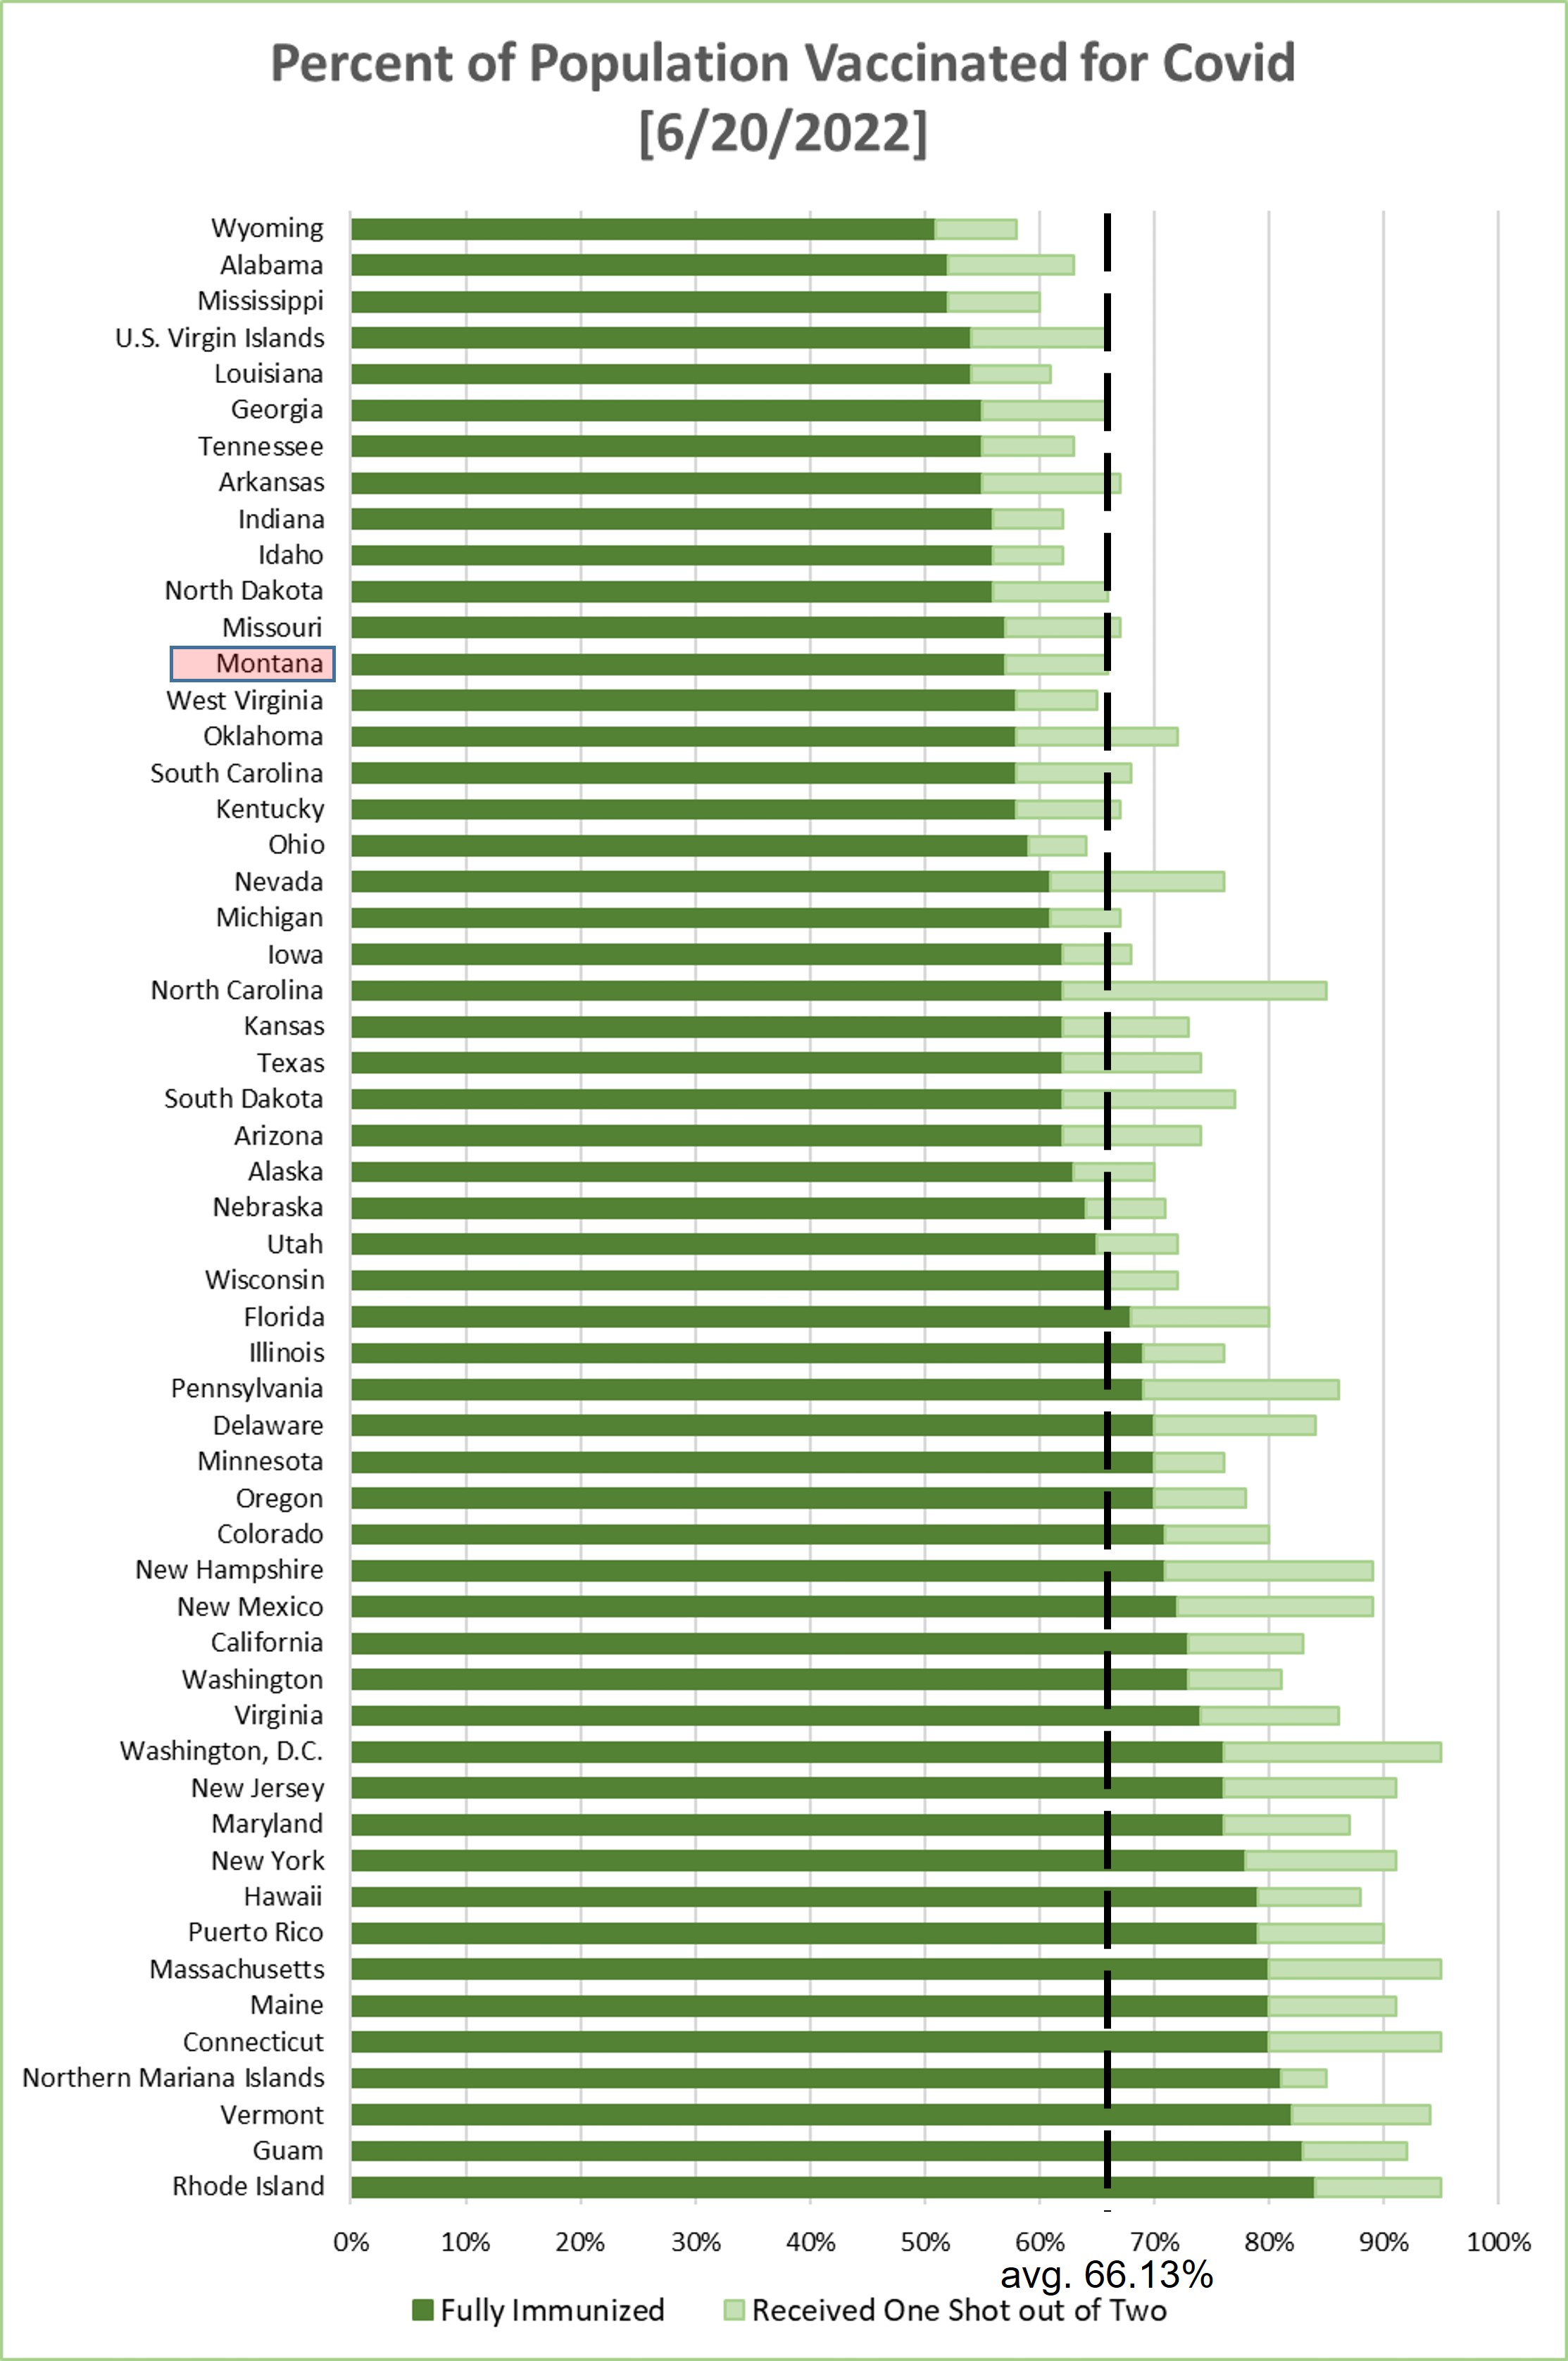
Chart 4 shows the percentage of the population in each jurisdiction having received
1 or 2 Covid-19 vaccination shots. This is sorted by the fraction that have received
2 shots--or one shot of the J&J vaccine. Average across the 55 jurisdictions is 60.56%
being fully immunized, for a weekly increase of about 0.69% (weekly increase the prior
week was 1.16%).


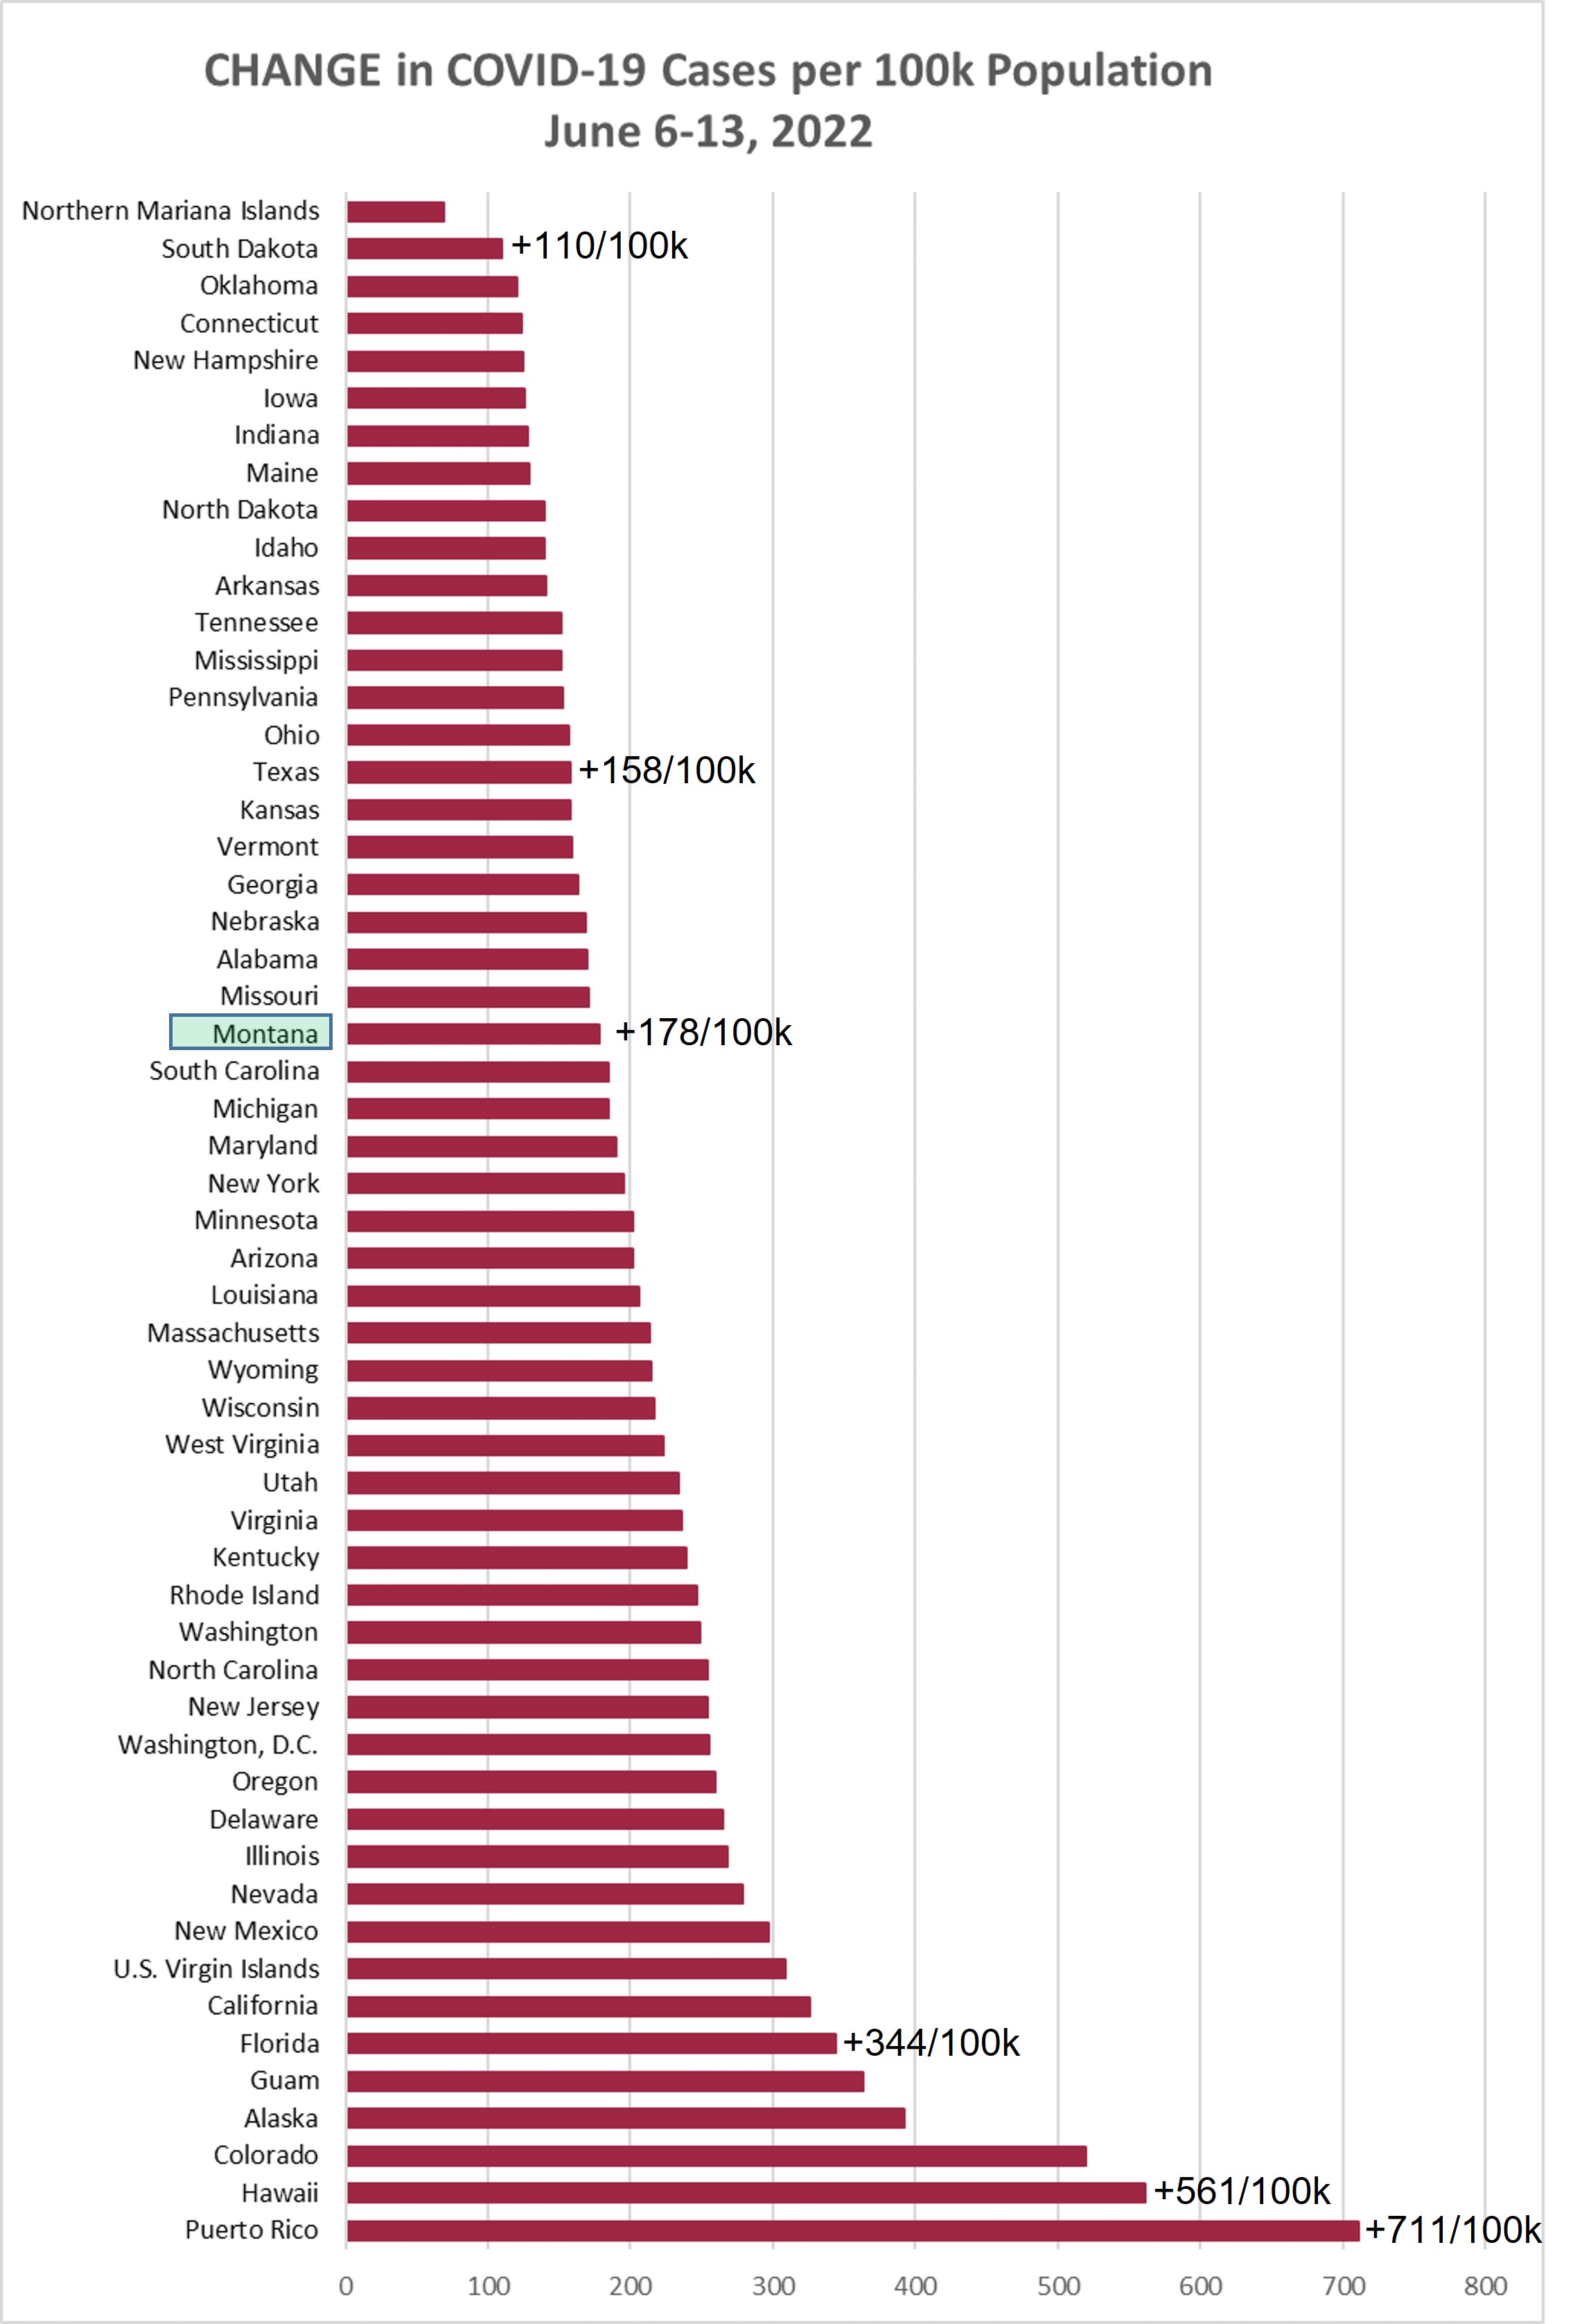
Monday, December 13, 2021
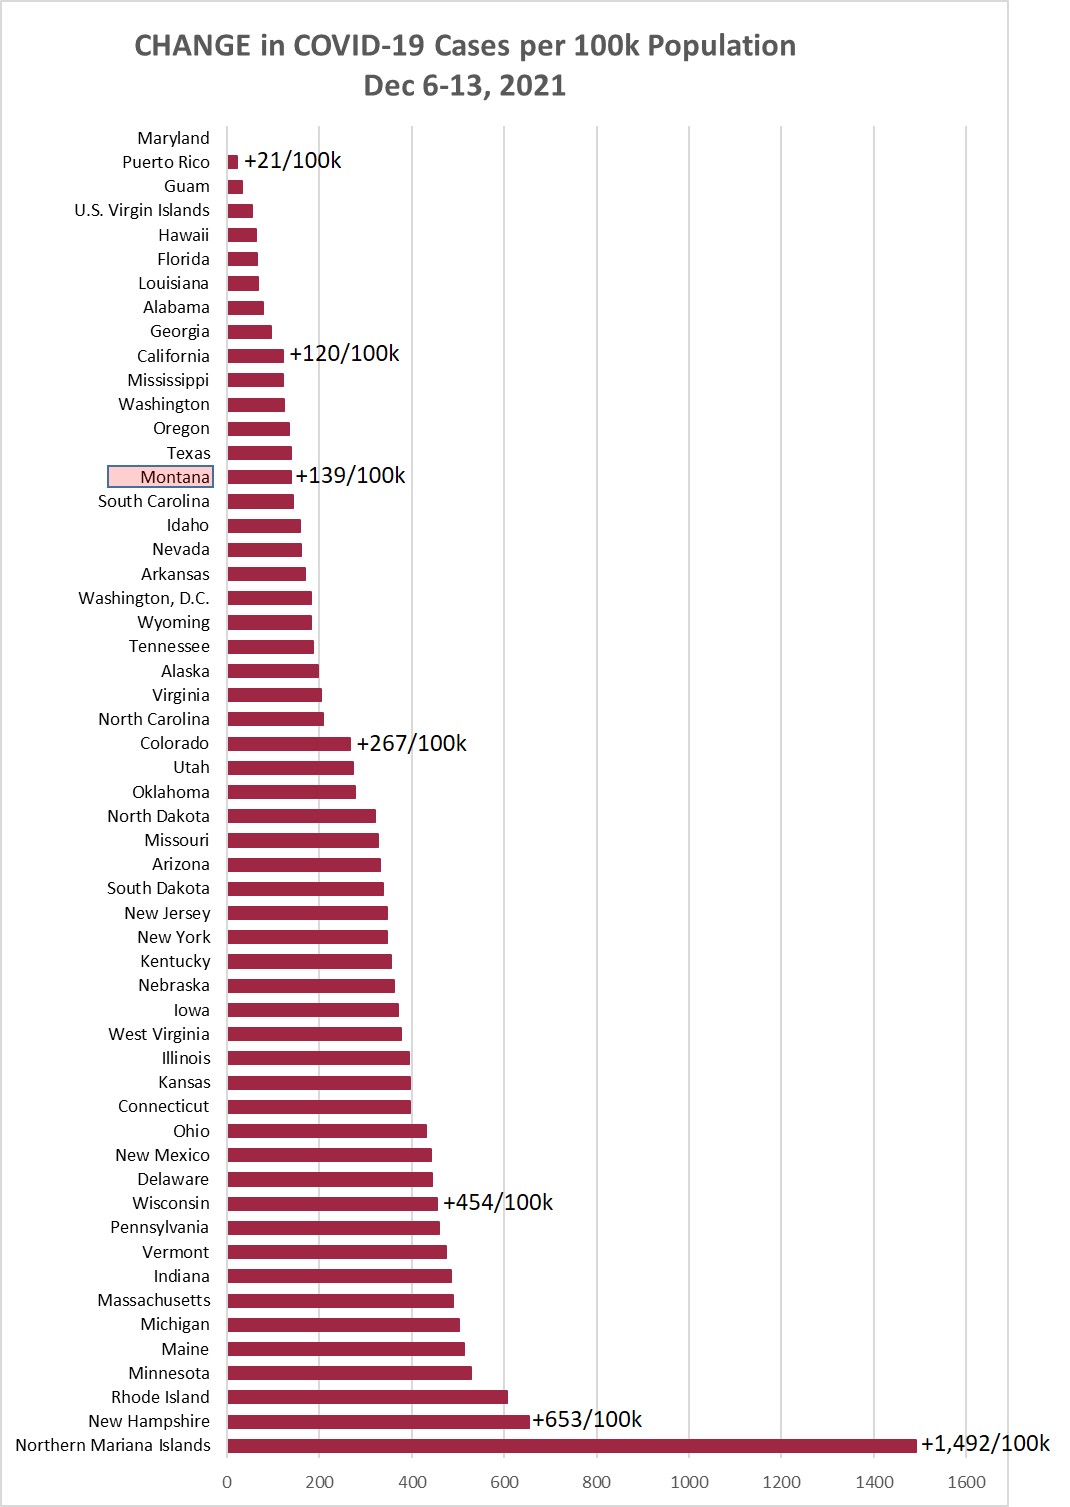
Chart 1 shows the change in cases per 100,000 population as of this morning (December
13, 2021) compared to the cases per 100,000 on December 6, 2021. Montana was up +139/100k
this week, compared to +209/100k the prior week, and +187/100k the week before that.
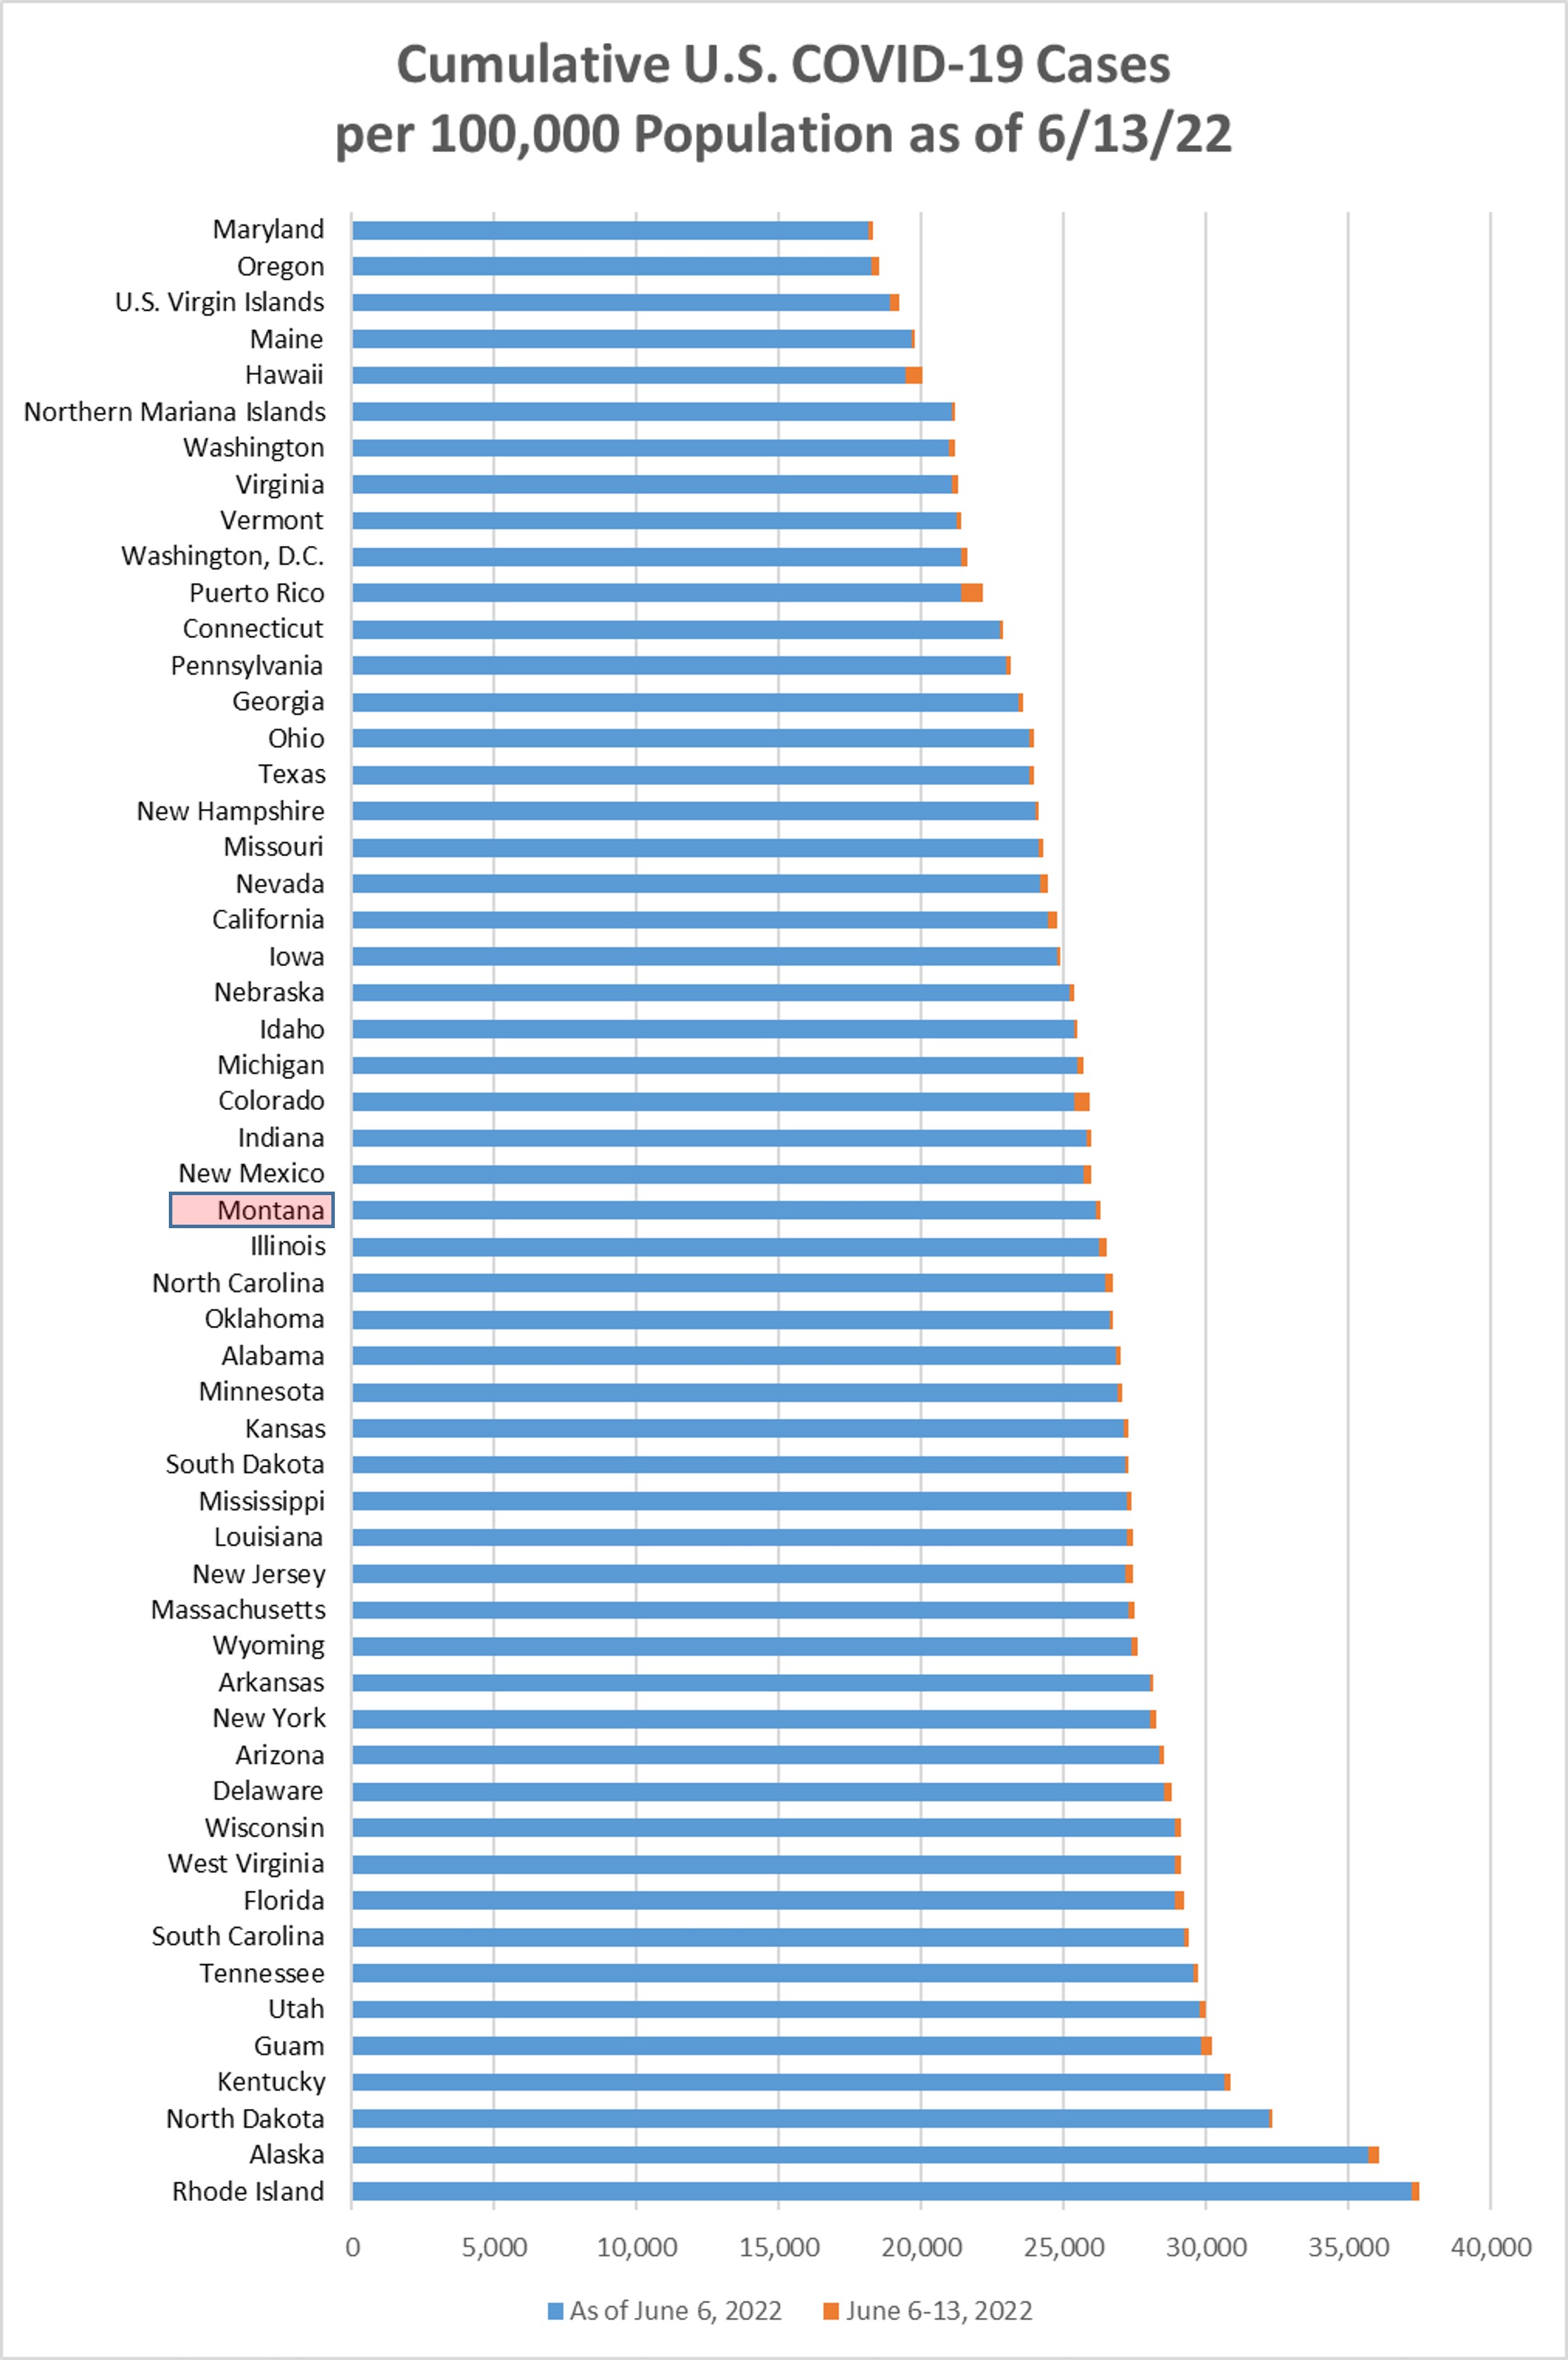
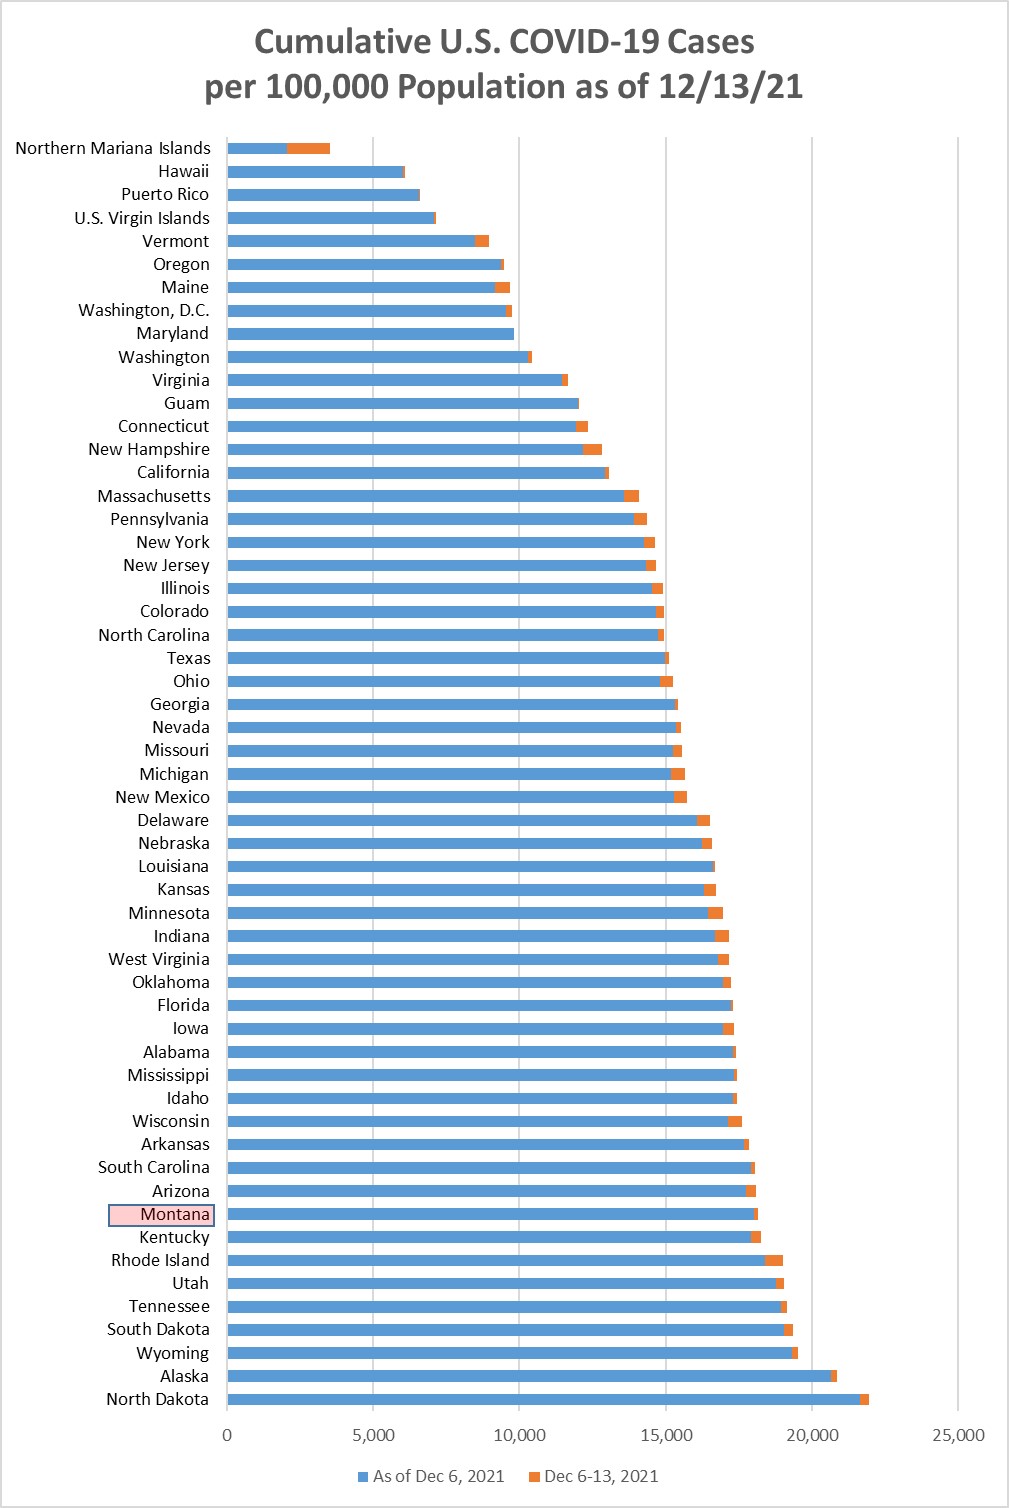
Chart 2 shows the same information as Chart 1, but with the overall cumulative cases
per 100k in each state to December 13. Montana moved down to position 9 this week,
being passed by Kentucky. Montana now has now had 18.2% of the population with a positive
Covid test at some point during the pandemic. At the end of September, Montana was
in position 23 at 13.6%.
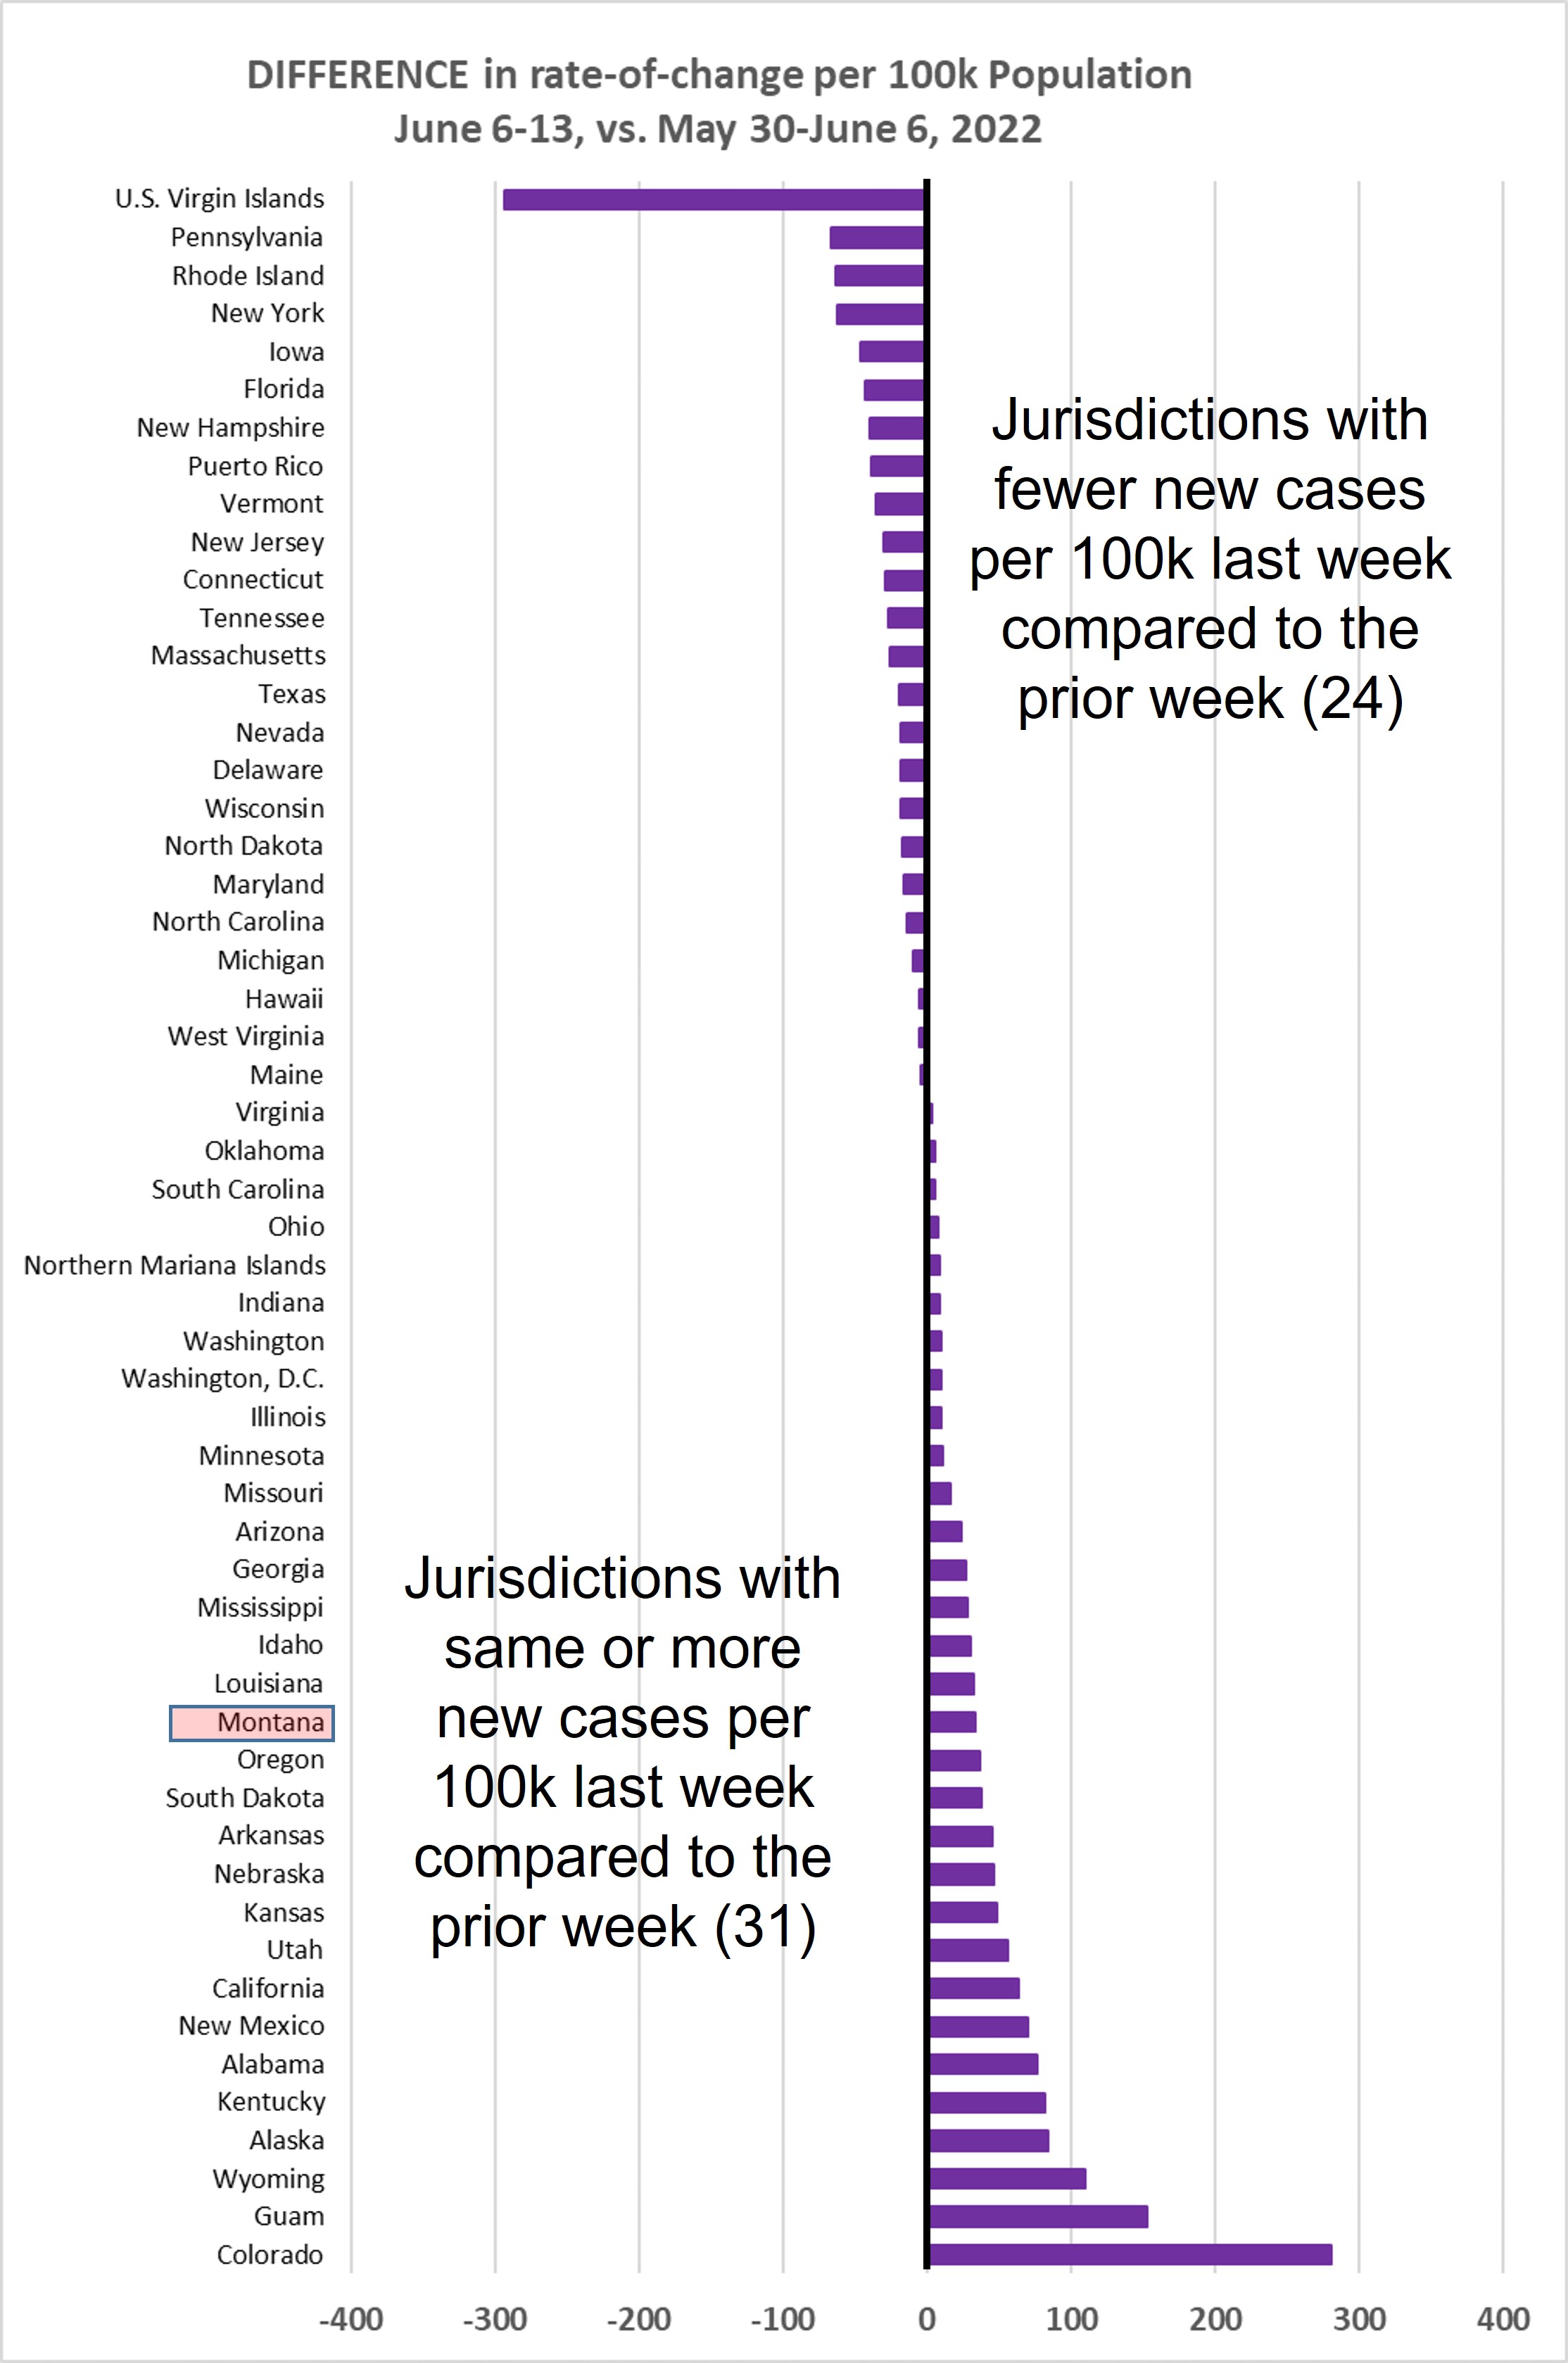
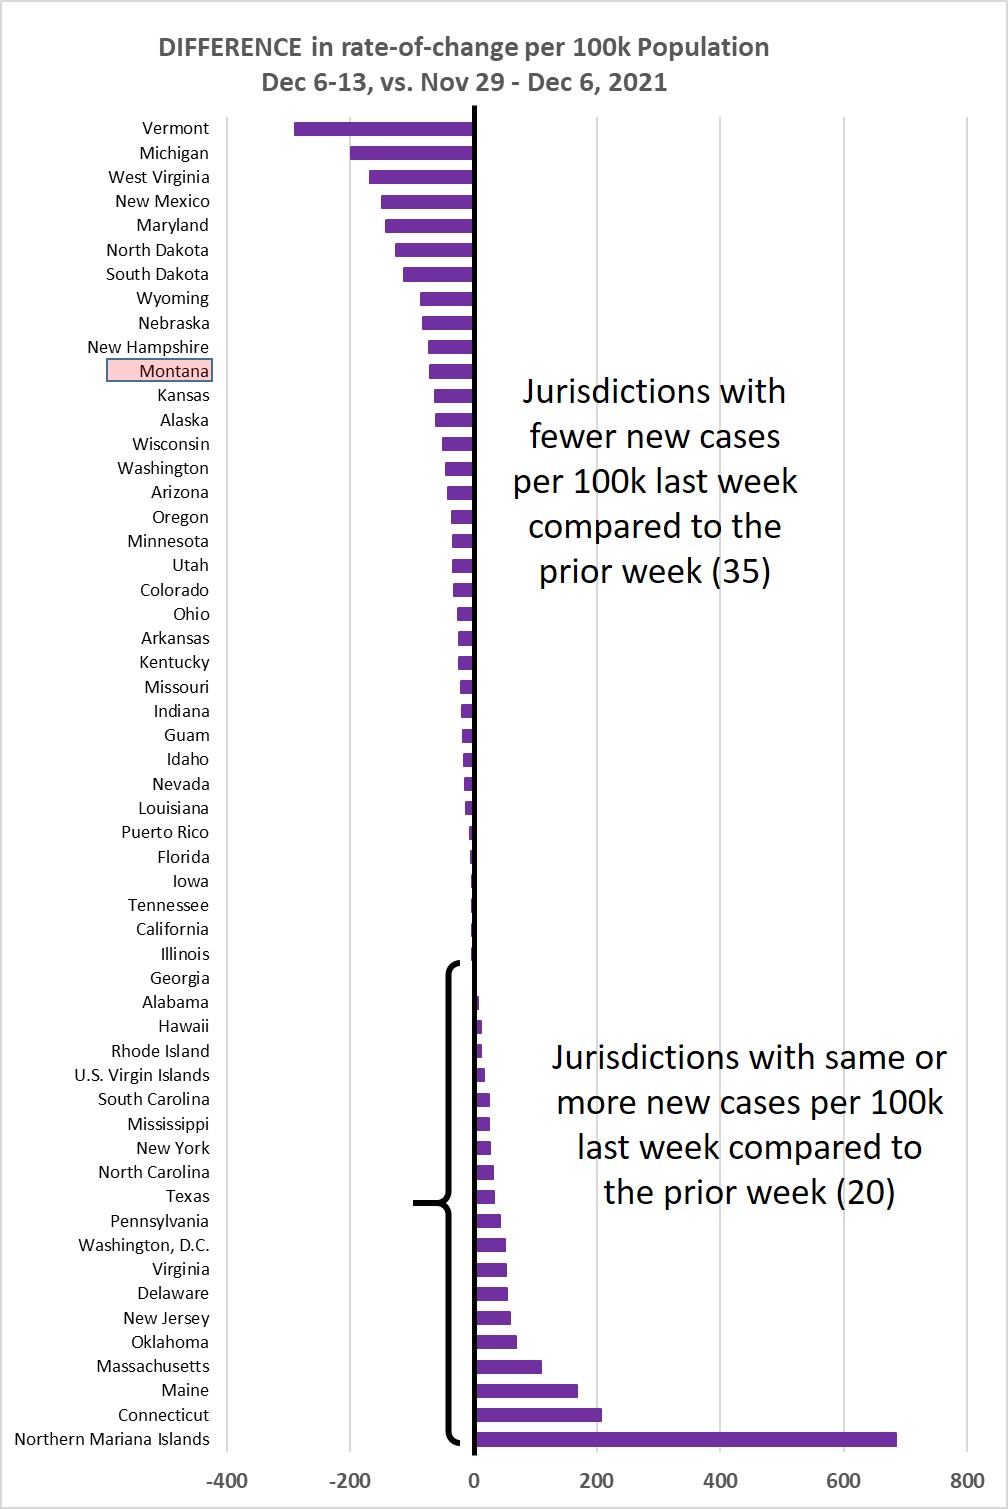
Chart 3 shows the difference in weekly new cases per 100k population for Dec 6-13,
vs. Nov 29-Dec 6, 2021. This past week 35/55 jurisdictions (64%) showed a lower rate
of new cases.
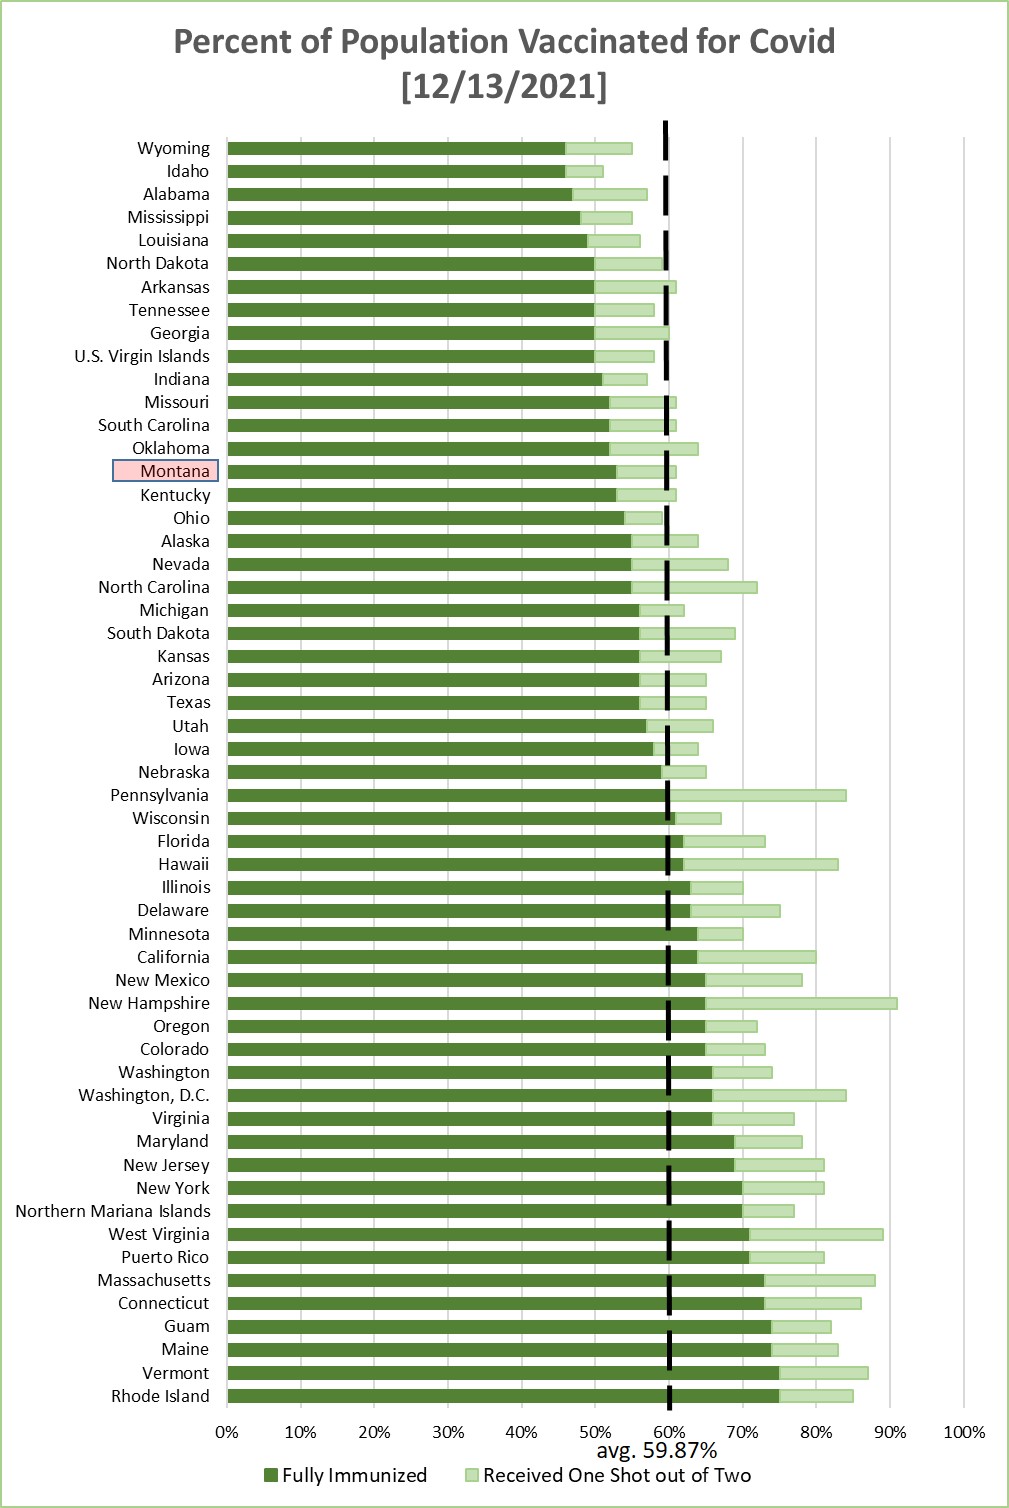
Chart 4 shows the percentage of the population in each jurisdiction having received
1 or 2 Covid-19 vaccination shots. This is sorted by the fraction that have received
2 shots--or one shot of the J&J vaccine. Average across the 55 jurisdictions is 59.87%
being fully immunized, for a weekly increase of about 1.16% (weekly increase the prior
week was 0.76%).
Monday, December 6, 2021
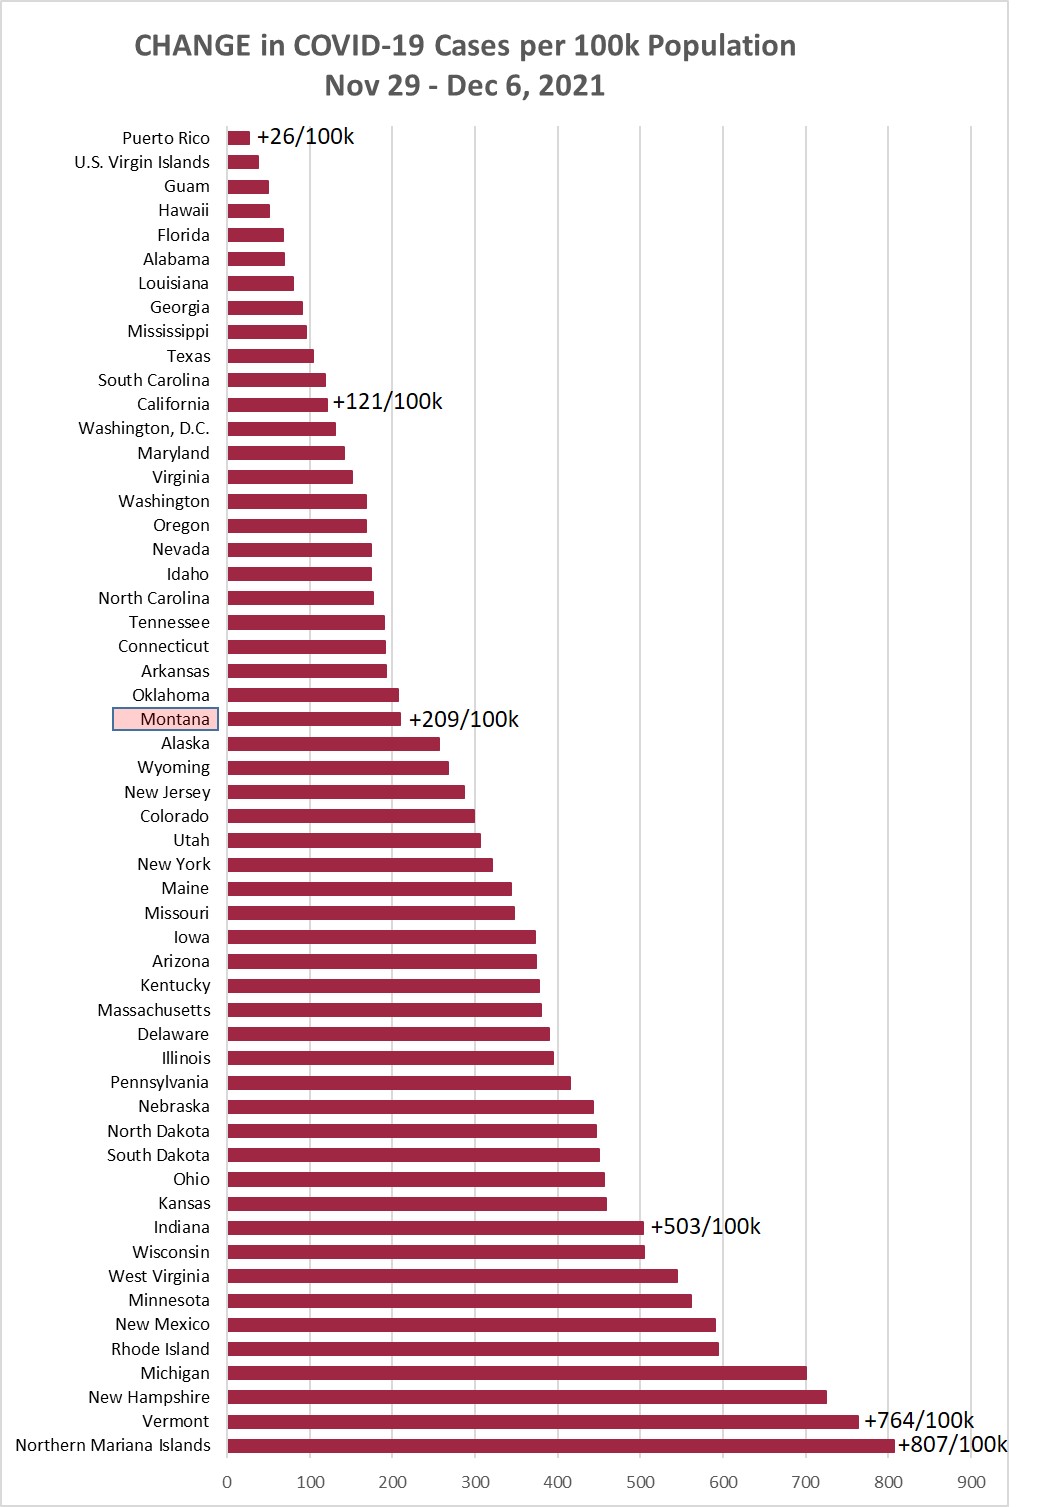
Chart 1 shows the change in cases per 100,000 population as of this morning (December
6, 2021) compared to the cases per 100,000 on November 29, 2021. Montana was up +209/100k
this week, compared to +187/100k the prior week, and +338/100k the week before that.
Probably reflecting lower new case counts the prior week due to Thanksgiving.
Chart 2 shows the same information as Chart 1, but with the overall cumulative cases
per 100k in each state to December 6. Montana remains in position 8 this week. Montana
now has now had 18% of the population with a positive Covid test at some point during
the pandemic. At the end of September, Montana was in position 23 at 13.6%.
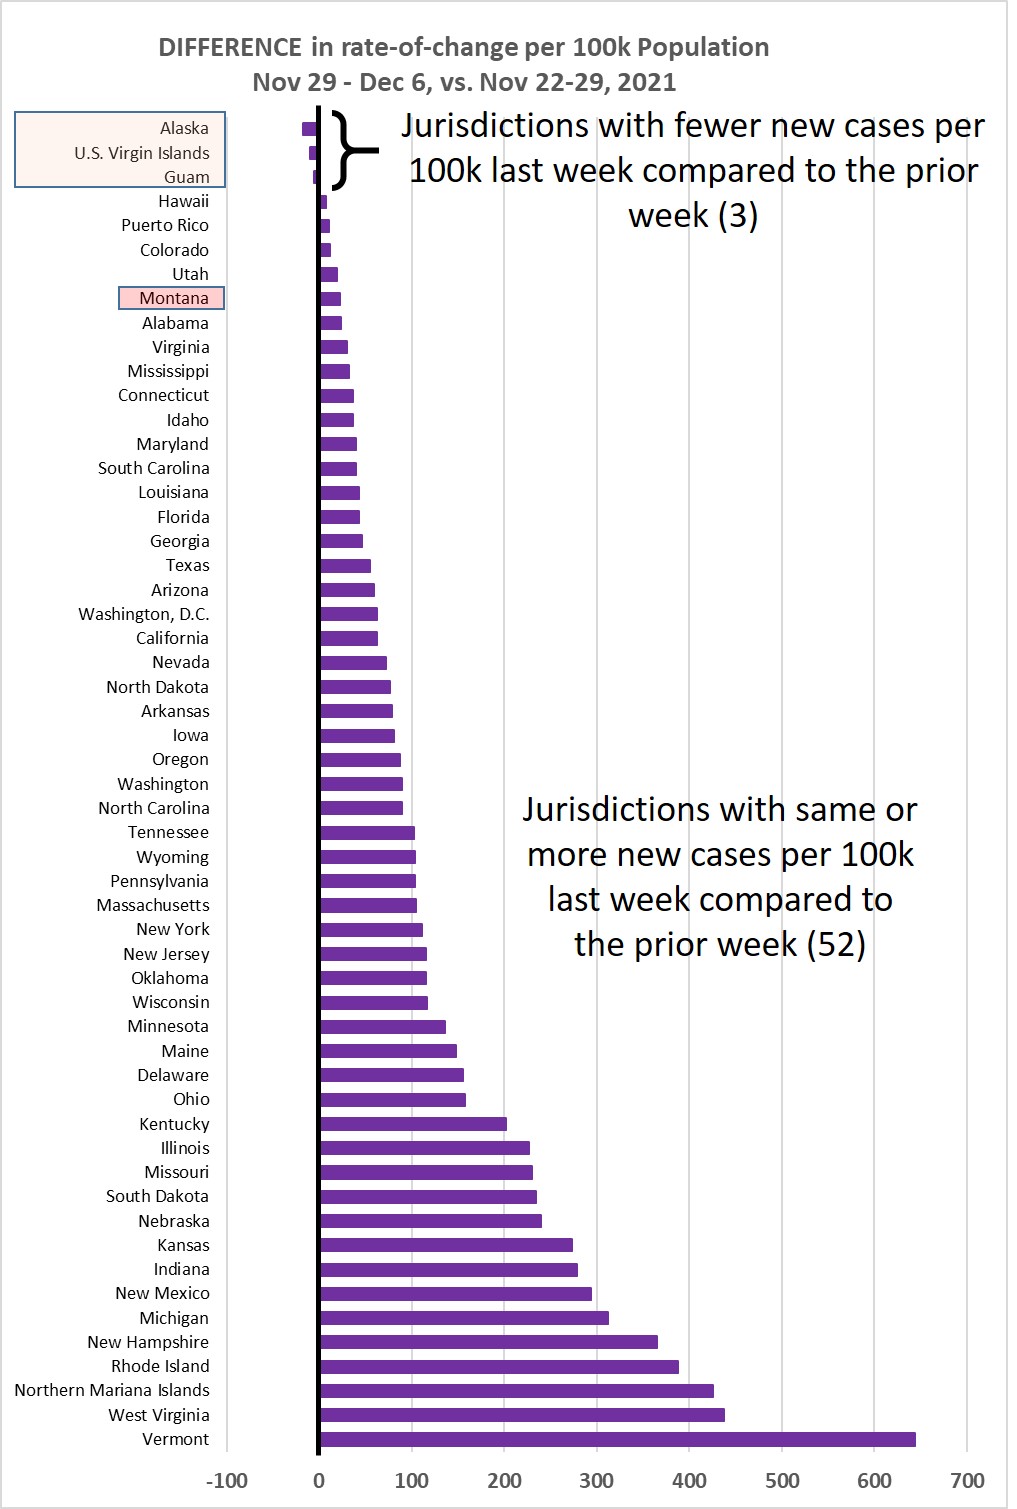
Chart 3 shows the difference in weekly new cases per 100k population for Nov 29-Dec
6, vs. Nov 22-29, 2021. This past week 52/55 jurisdictions (95%) showed a higher rate
of new cases. Again, probalby partly due to the lower new case counts during Thanksgiving
week.
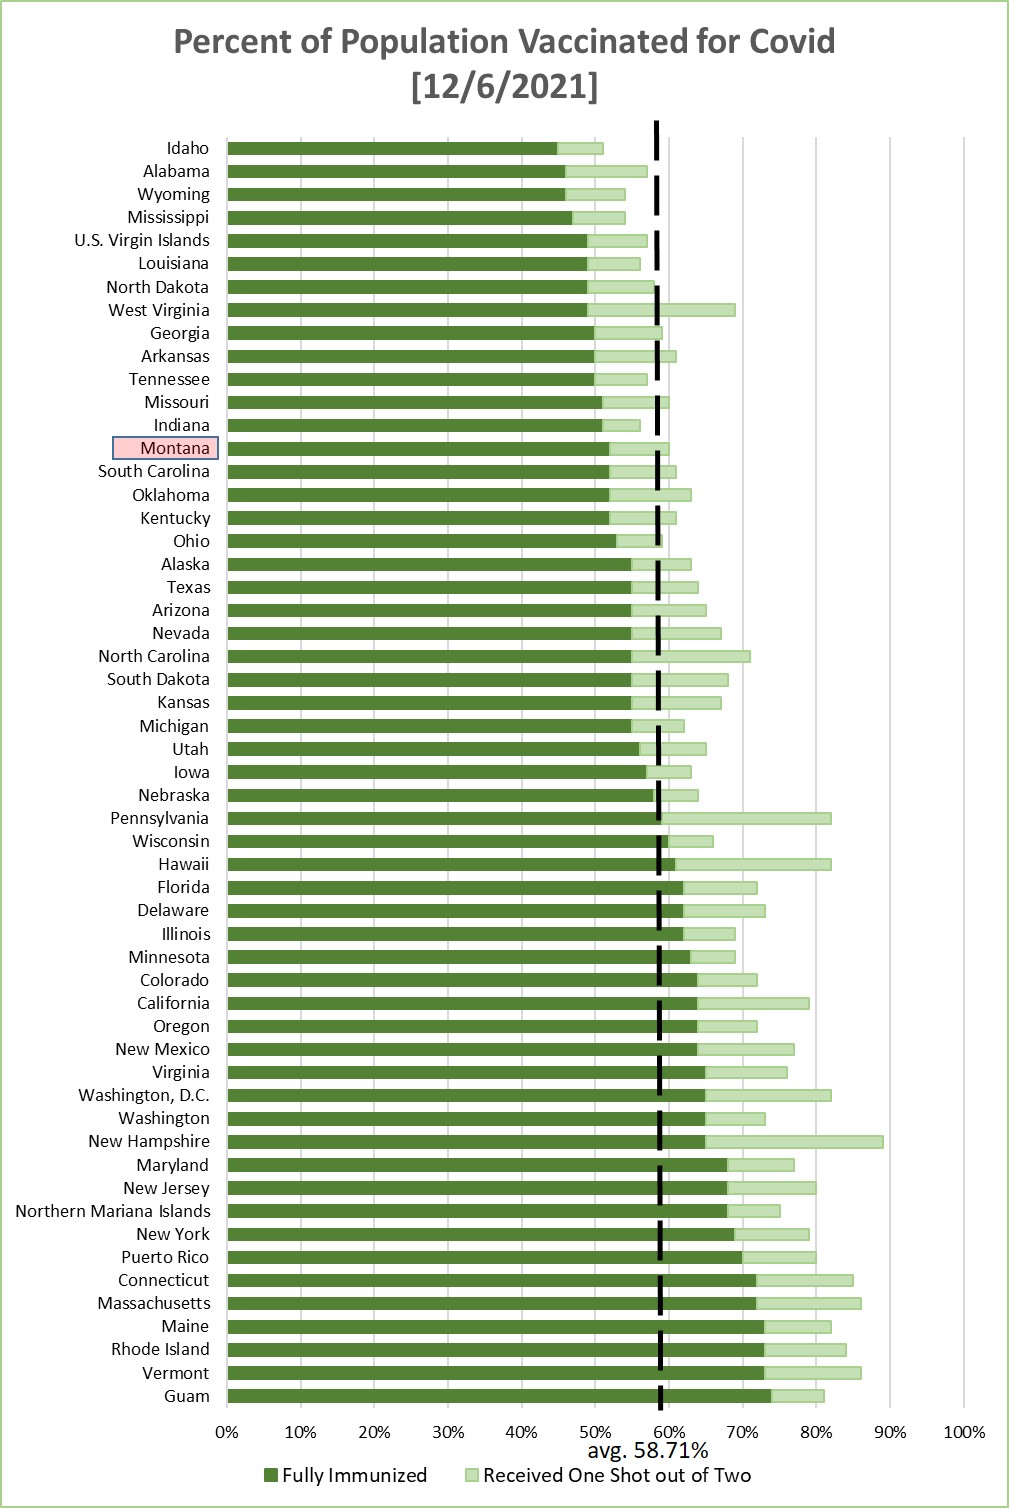
Chart 4 shows the percentage of the population in each jurisdiction having received
1 or 2 Covid-19 vaccination shots. This is sorted by the fraction that have received
2 shots--or one shot of the J&J vaccine. Average across the 55 jurisdictions is 58.71%
being fully immunized--a "healthy" weekly increase of about 0.76%, (weekly increase
the prior holiday-shortened week was 0.13%).

Monday, November 29, 2021
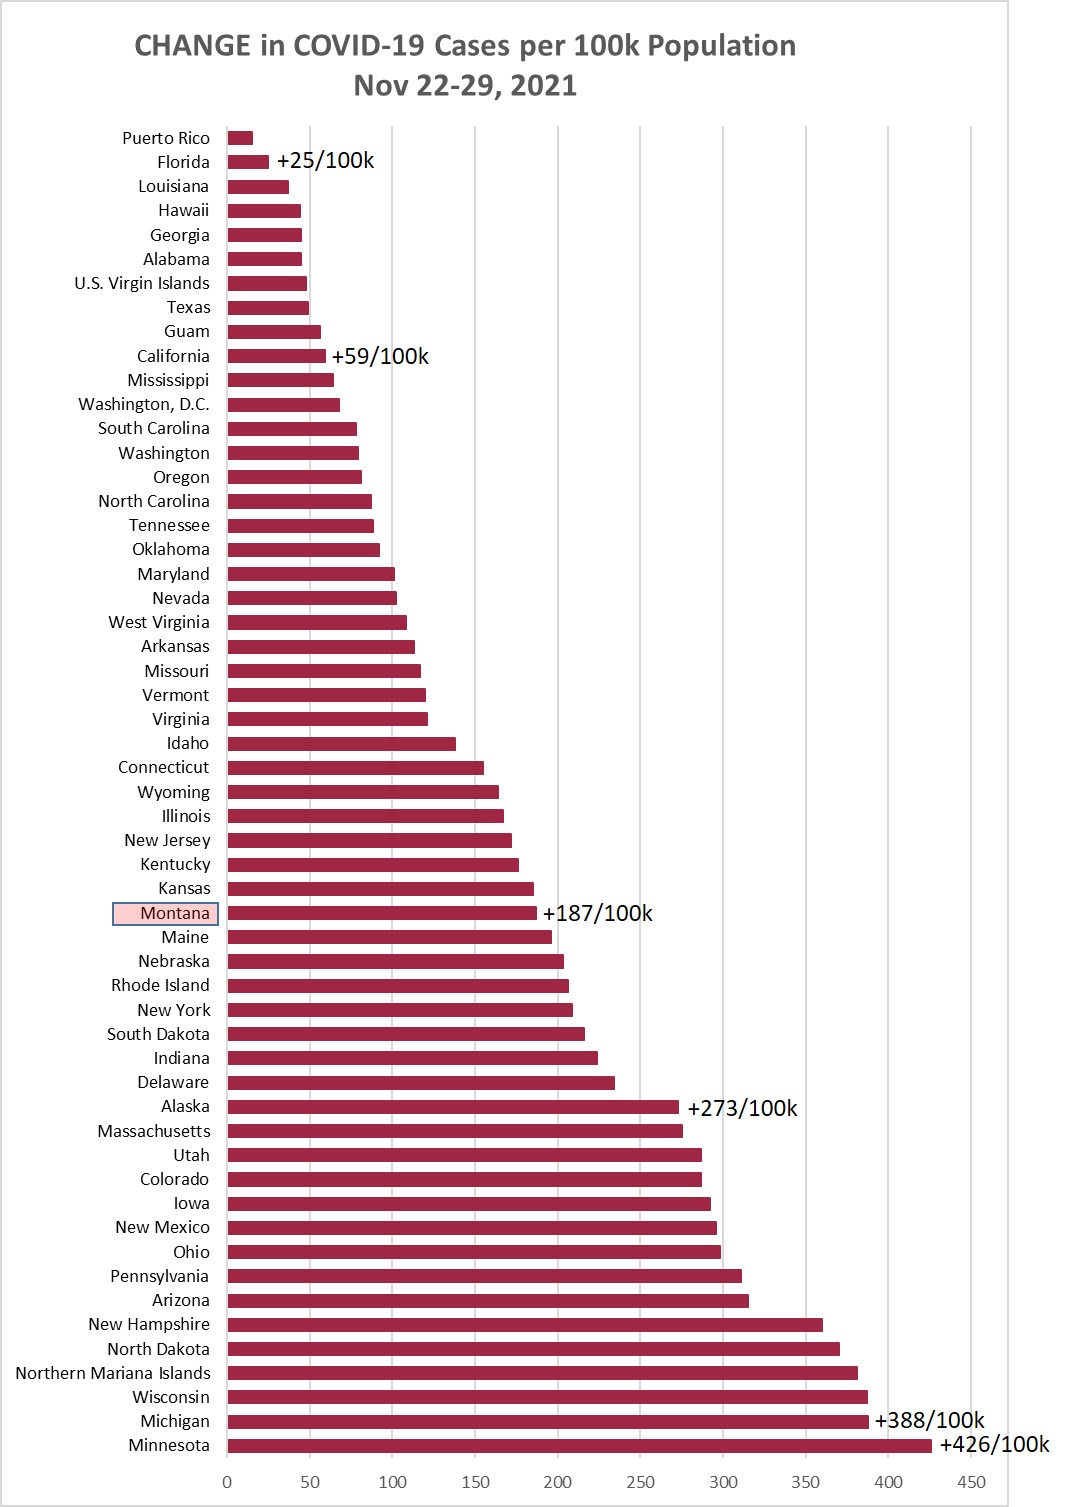
Chart 1 shows the change in cases per 100,000 population as of this morning (November
29, 2021) compared to the cases per 100,000 on November 22, 2021. Montana was up +187/100k
this week, compared to +338/100k the prior week, and +370/100k the week before that.
Down is definitely good.
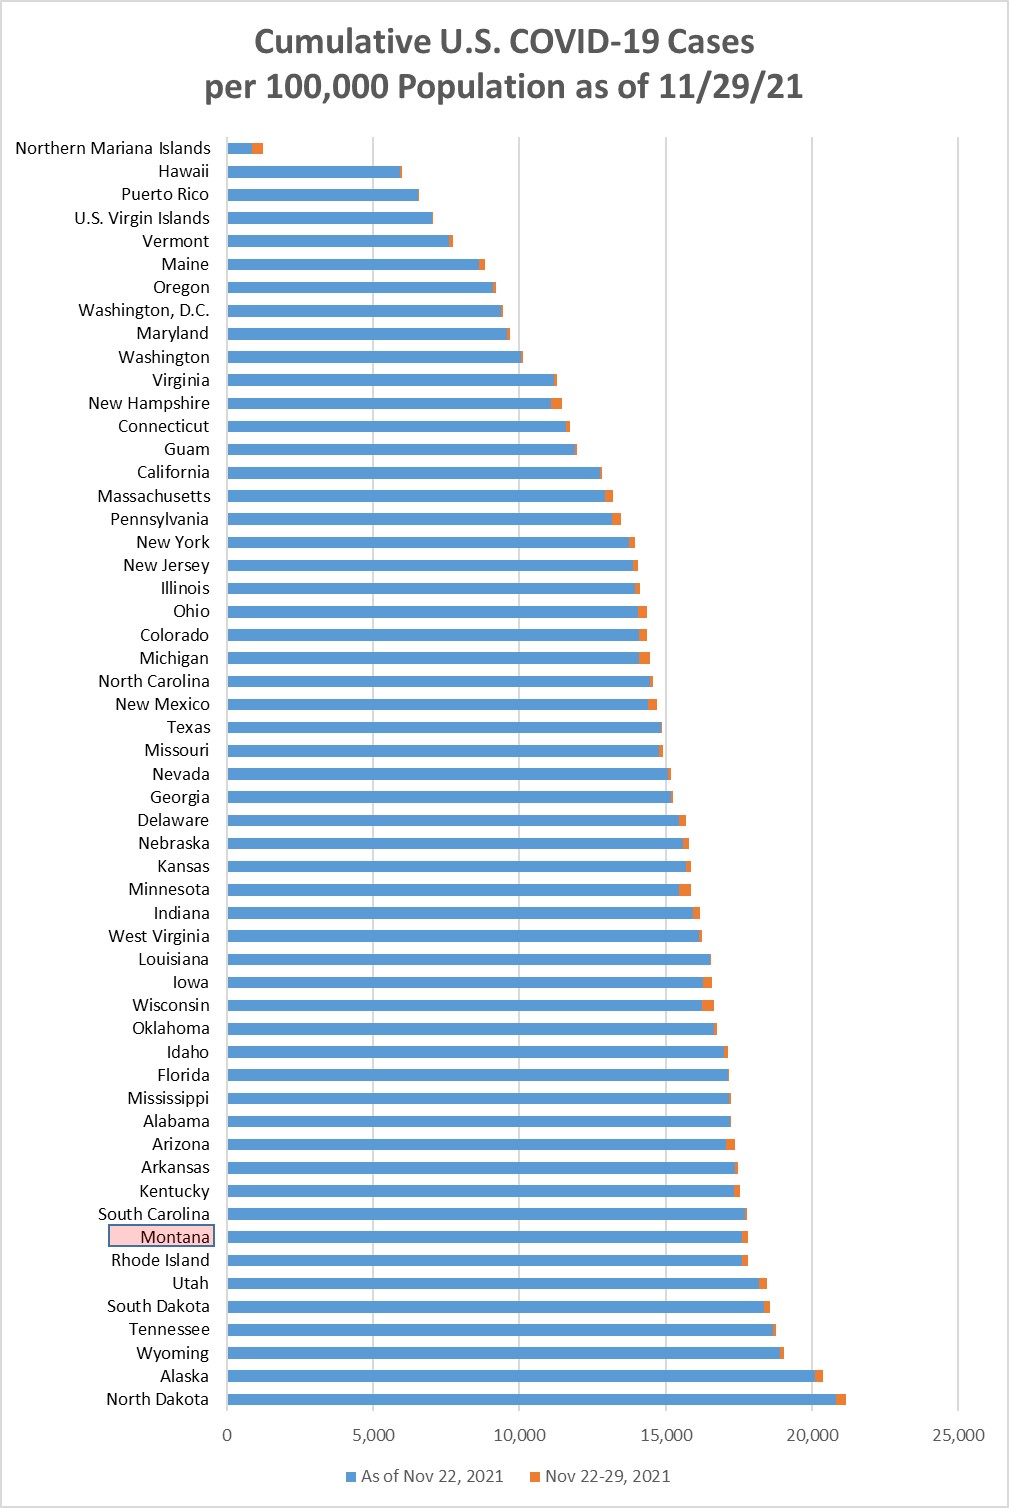
Chart 2 shows the same information as Chart 1, but with the overall cumulative cases
per 100k in each state to November 29. Montana remains in position 8 this week. Montana
now has now had 17.8% of the population with a positive Covid test at some point during
the pandemic. At the end of September, Montana was in position 23 at 13.6%.
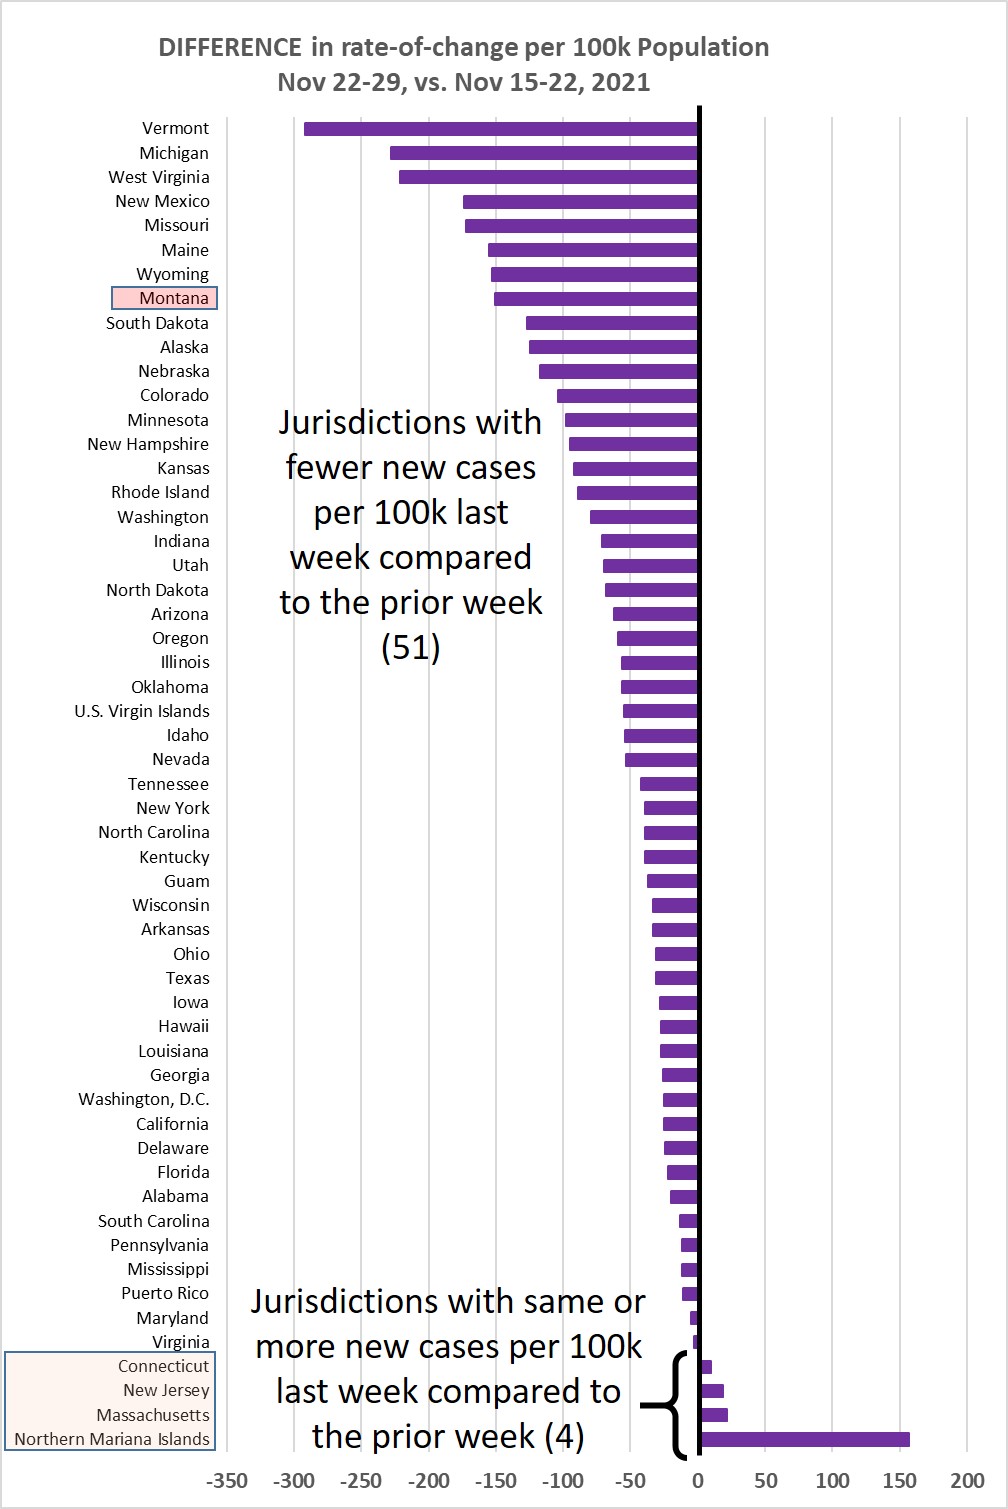
Chart 3 shows the difference in weekly new cases per 100k population for Nov 22-29,
vs. Nov 15-22, 2021. This past week 51/55 jurisdictions (93%) showed a lower rate
of new cases.
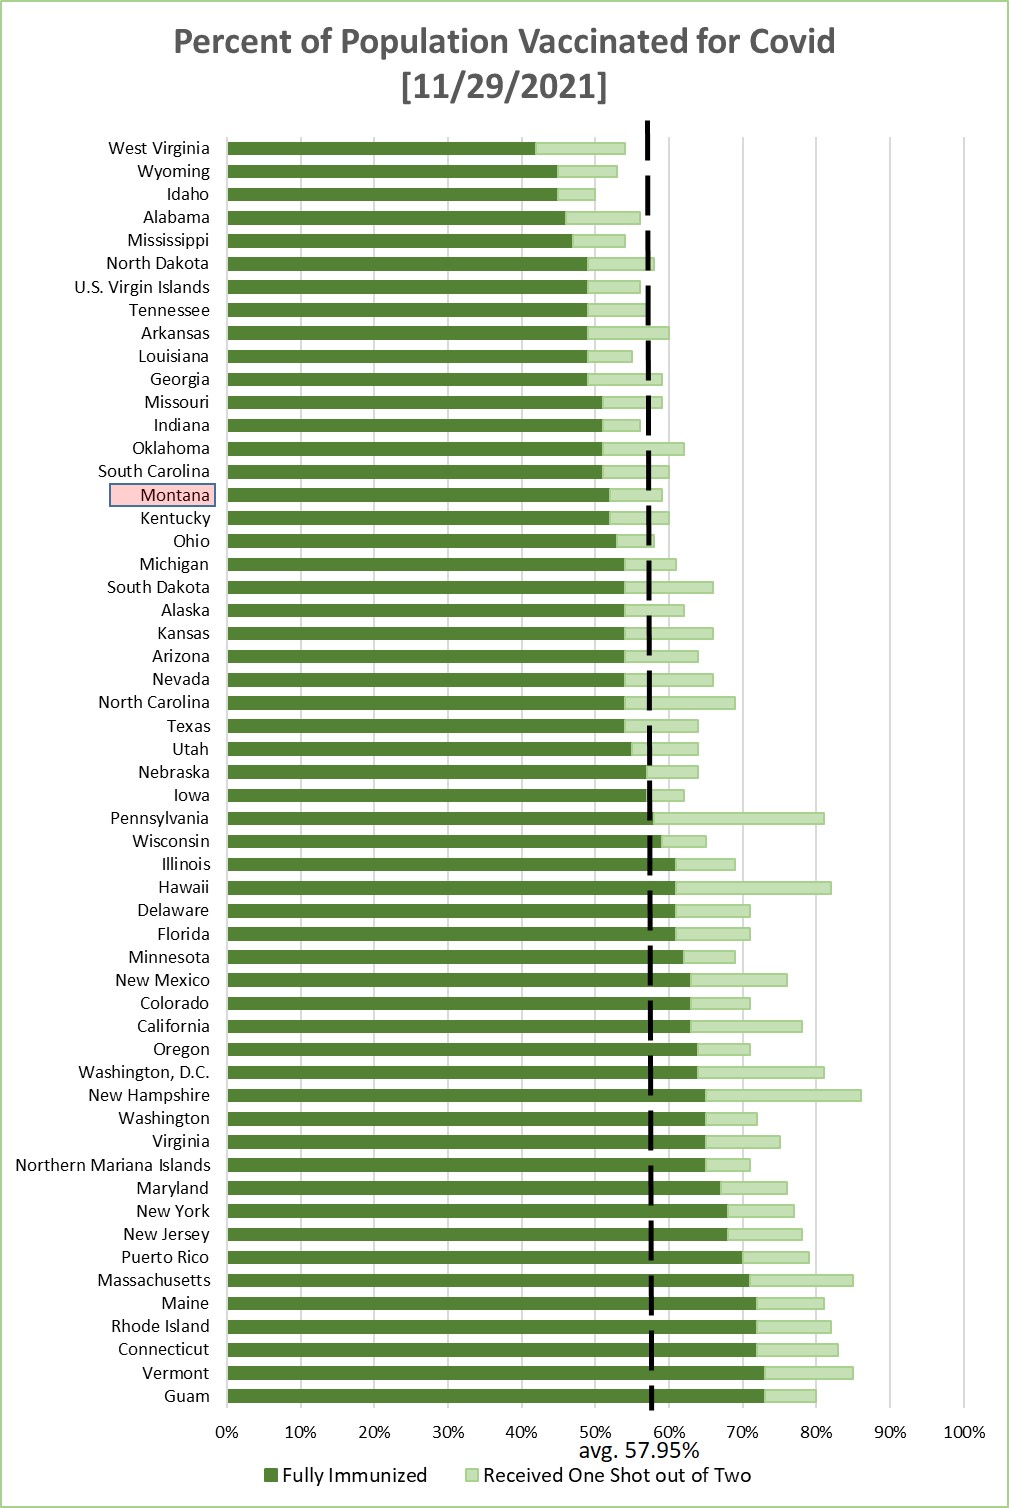
Chart 4 shows the percentage of the population in each jurisdiction having received
1 or 2 Covid-19 vaccination shots. This is sorted by the fraction that have received
2 shots--or one shot of the J&J vaccine. Average across the 55 jurisdictions is 57.95%
being fully immunized--a weekly increase of about 0.13%, counting just through last
Wednesday (weekly increase the prior week was 0.42%).
Monday, November 22, 2021
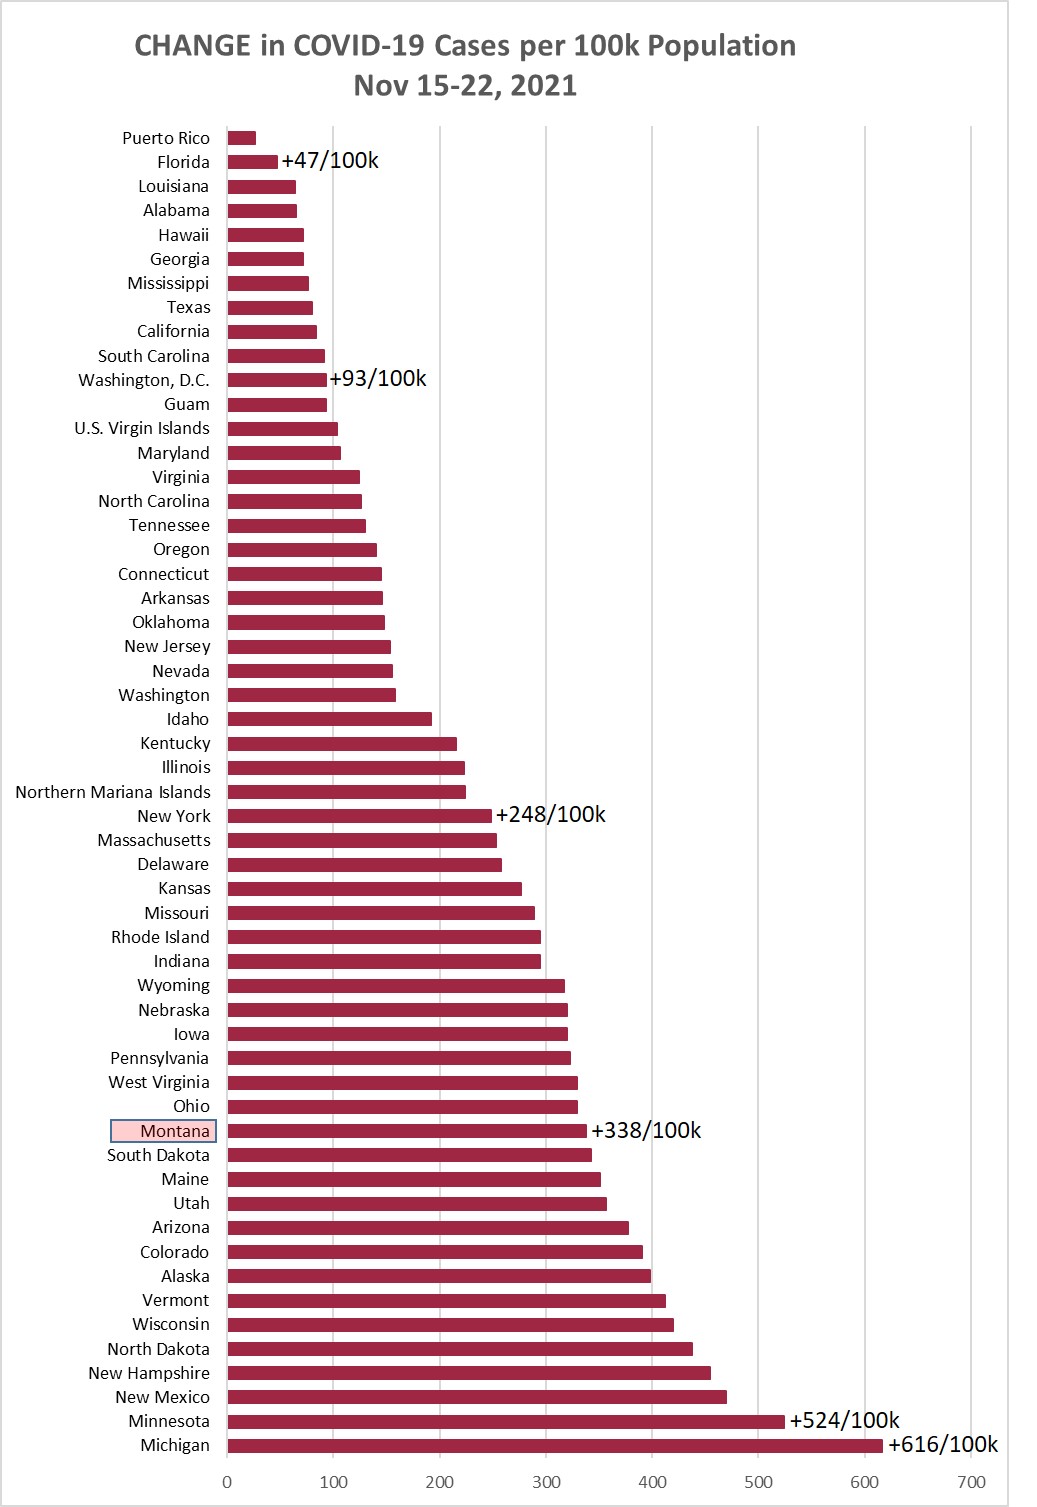
Chart 1 shows the change in cases per 100,000 population as of this morning (November
22, 2021) compared to the cases per 100,000 on November 15, 2021. Montana was up +338/100k
this week, compared to +370/100k the prior week, and +431/100k the week before that.
Heading downward continues to be good.
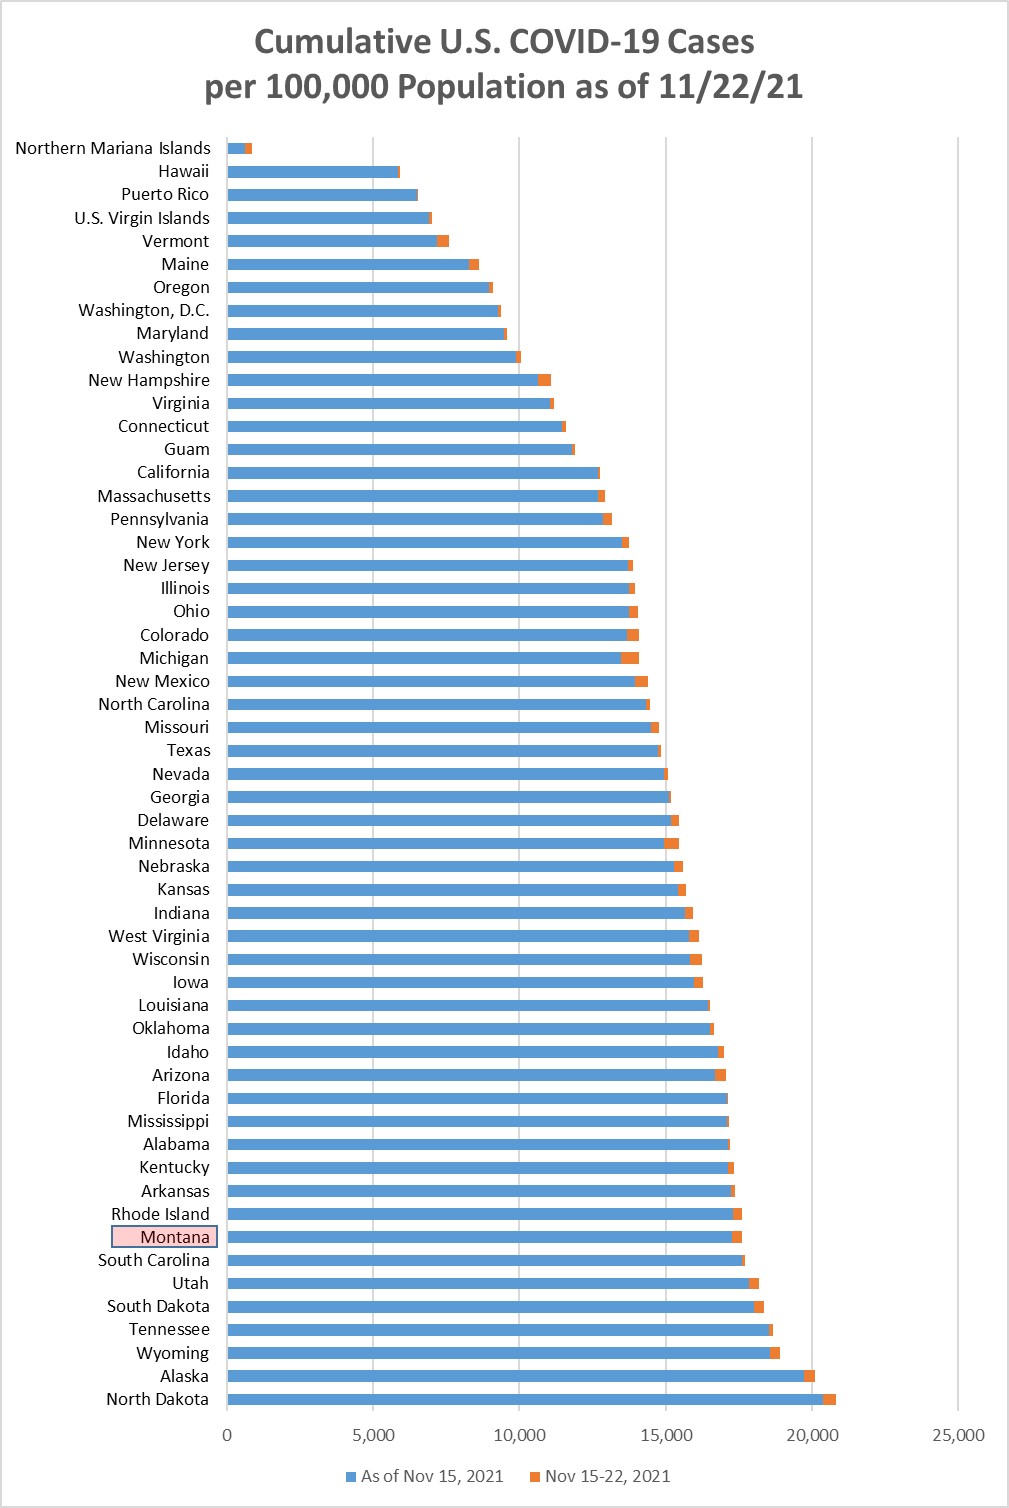
Chart 2 shows the same information as Chart 1, but with the overall cumulative cases
per 100k in each state to November 22. Montana moved up to position 8 this week, passing
Rhode Island. Montana now has now had 17.6% of the population with a positive Covid
test at some point during the pandemic. At the end of September, Montana was in position
23 at 13.6%.
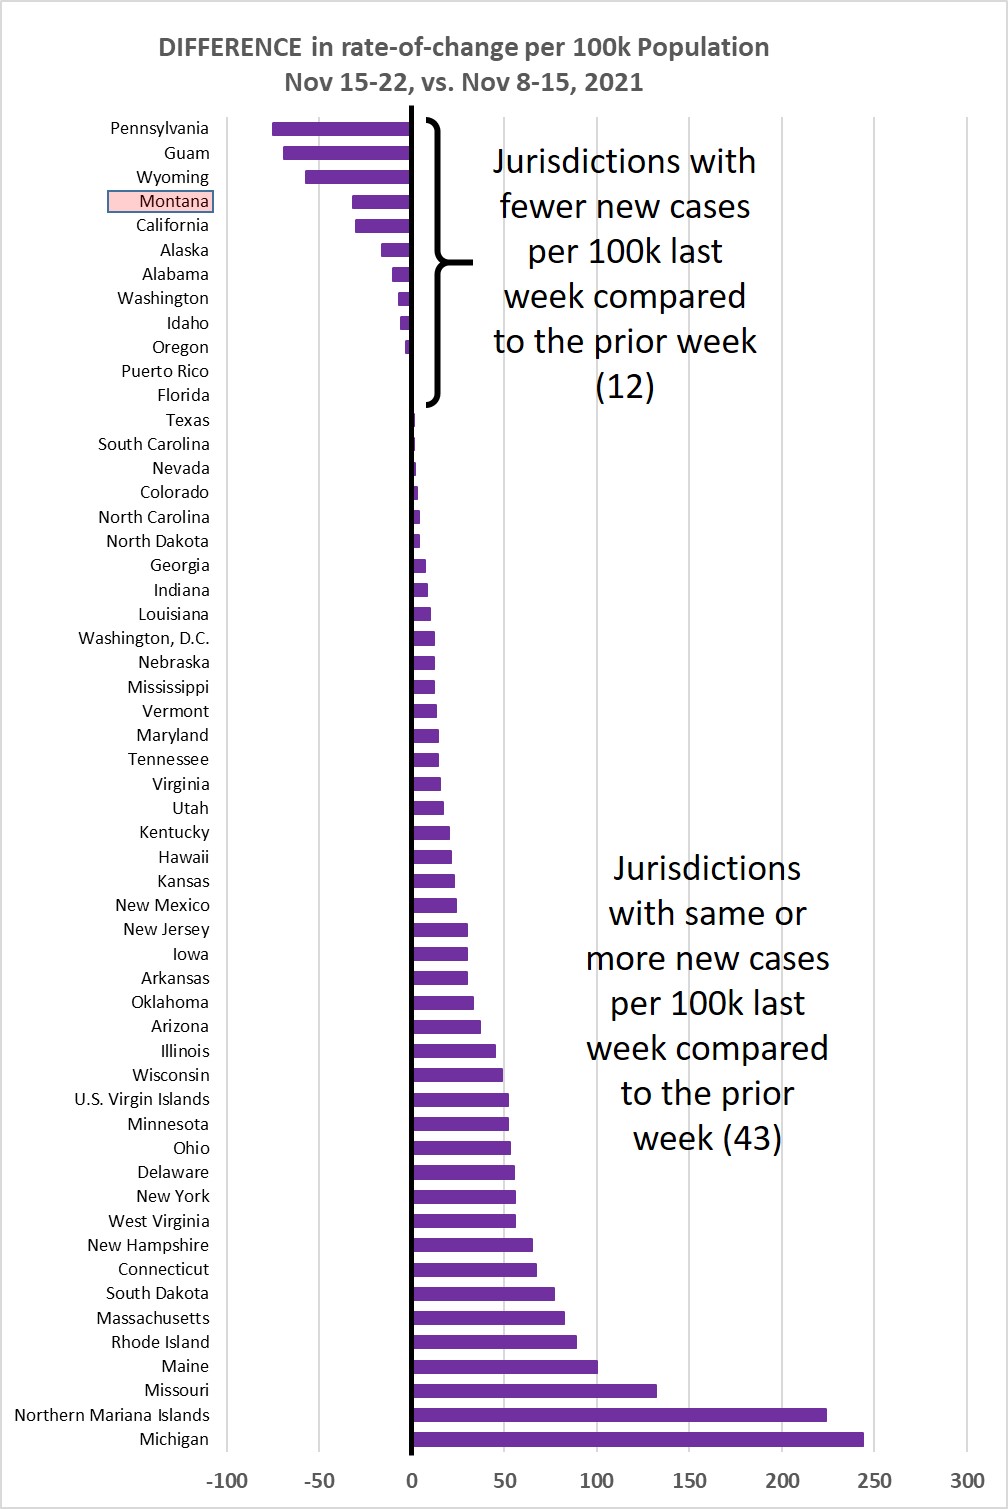
Chart 3 shows the difference in weekly new cases per 100k population for Nov 15-22,
vs. Nov 8-15, 2021. This past week 43/55 jurisdictions (78%) showed a higher rate
of new cases. Looks like the declining trend has flattened out.
Chart 4 shows the percentage of the population in each jurisdiction having received
1 or 2 Covid-19 vaccination shots. This is sorted by the fraction that have received
2 shots--or one shot of the J&J vaccine. Average across the 55 jurisdictions is 57.82%
being fully immunized--a weekly increase of about 0.42% (weekly increase the prior
week was 0.36%).

Monday, November 15, 2021
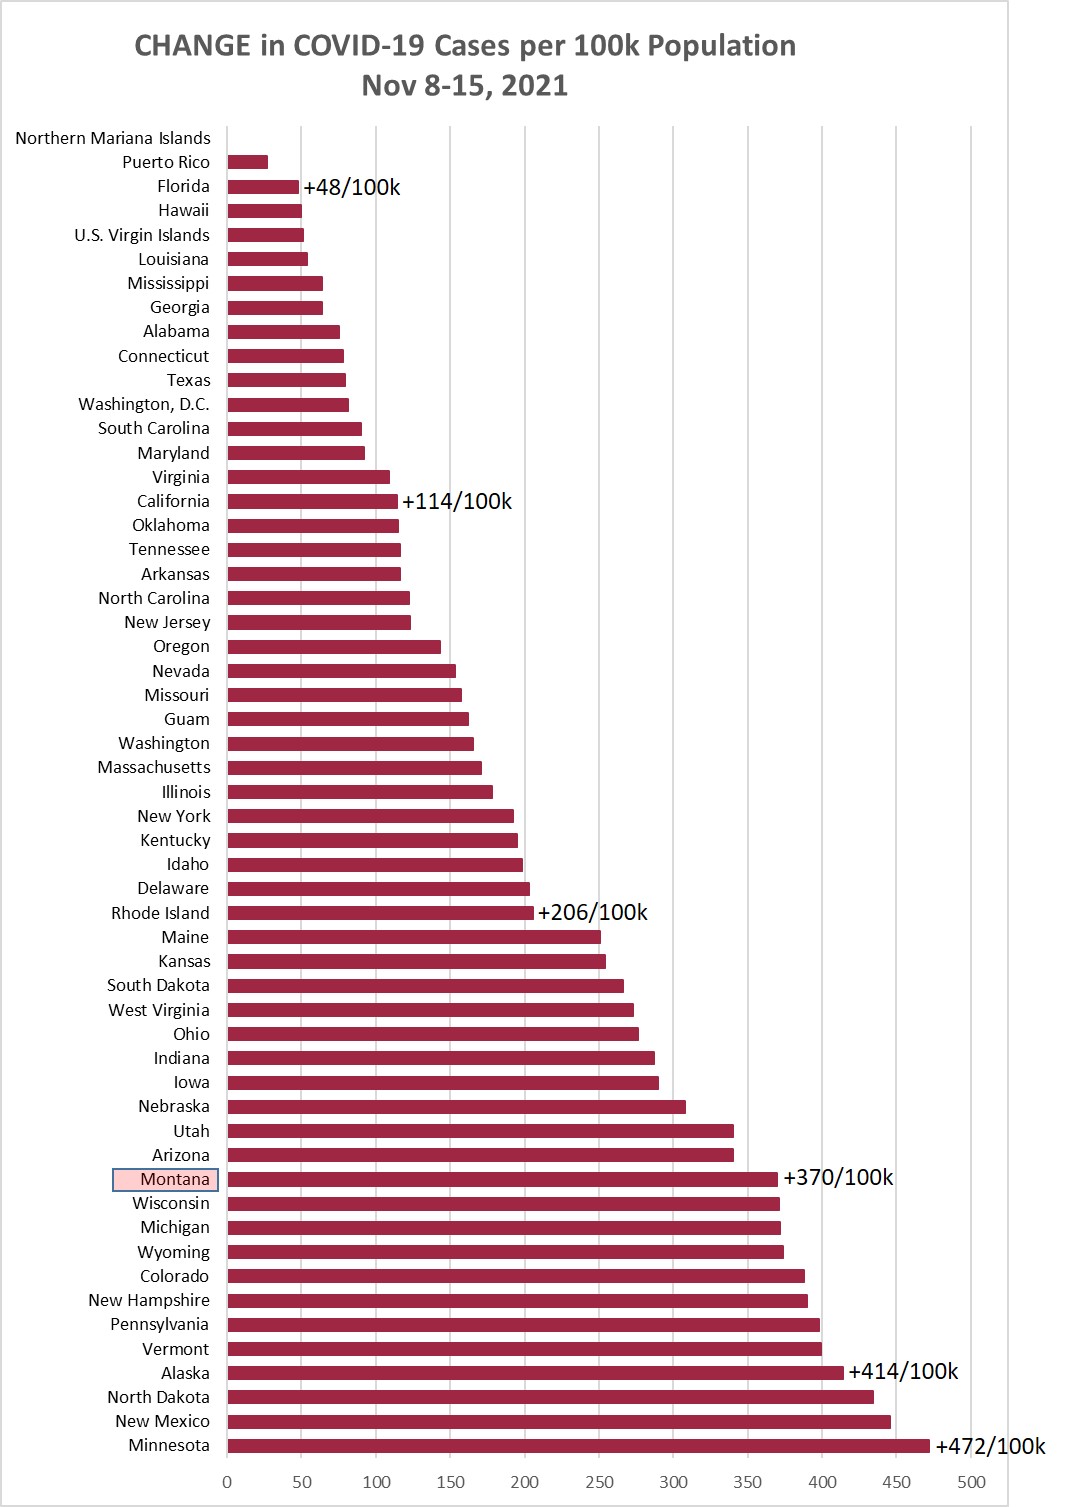
Chart 1 shows the change in cases per 100,000 population as of this morning (November
15, 2021) compared to the cases per 100,000 on November 8, 2021. Montana was up +370/100k
this week, compared to +431/100k the prior week, and +494/100k the week before that.
Heading downward continues to be good.
Chart 2 shows the same information as Chart 1, but with the overall cumulative cases
per 100k in each state to November 15. Montana moved up to position 9 this week, passing
Florida, Alabama, Arkansas, etc. Montana now has now had 17.3% of the population with
a positive Covid test at some point during the pandemic. At the end of September,
Montana was in position 23 at 13.6%.
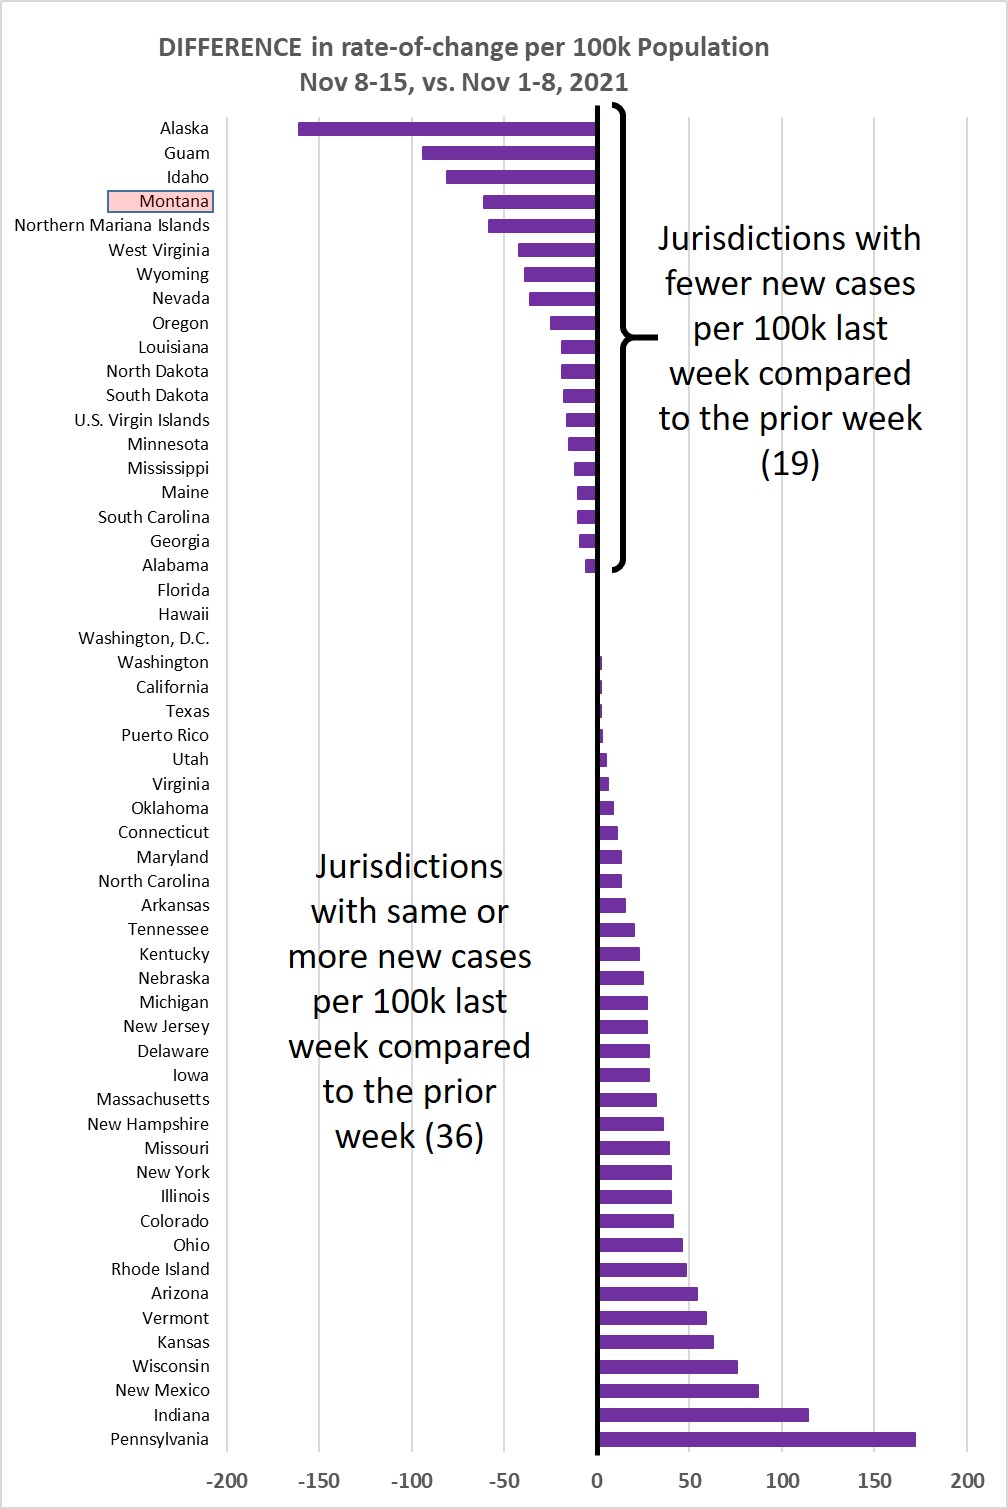
Chart 3 shows the difference in weekly new cases per 100k population for Nov 8-15,
vs. Nov 1-8, 2021. This past week 36/55 jurisdictions (66%) showed a higher rate of
new cases.
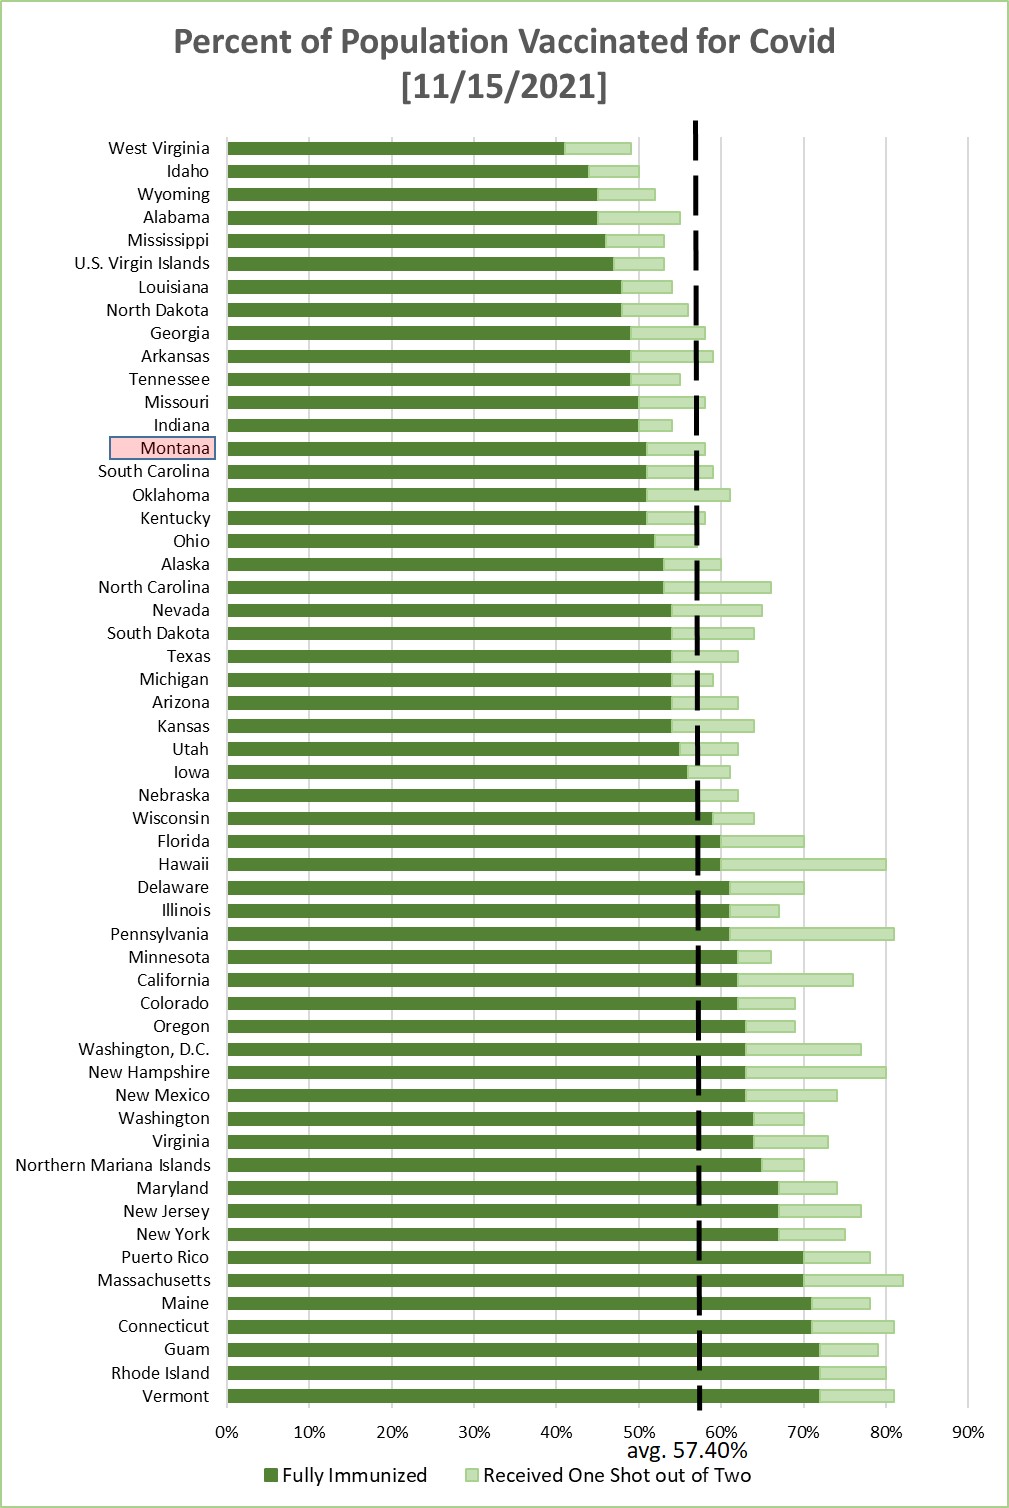
Chart 4 shows the percentage of the population in each jurisdiction having received
1 or 2 Covid-19 vaccination shots. This is sorted by the fraction that have received
2 shots--or one shot of the J&J vaccine. Average across the 55 jurisdictions is 57.40%
being fully immunized--a weekly increase of about 0.36% (weekly increase the prior
week was 0.33%).

Monday, November 8, 2021
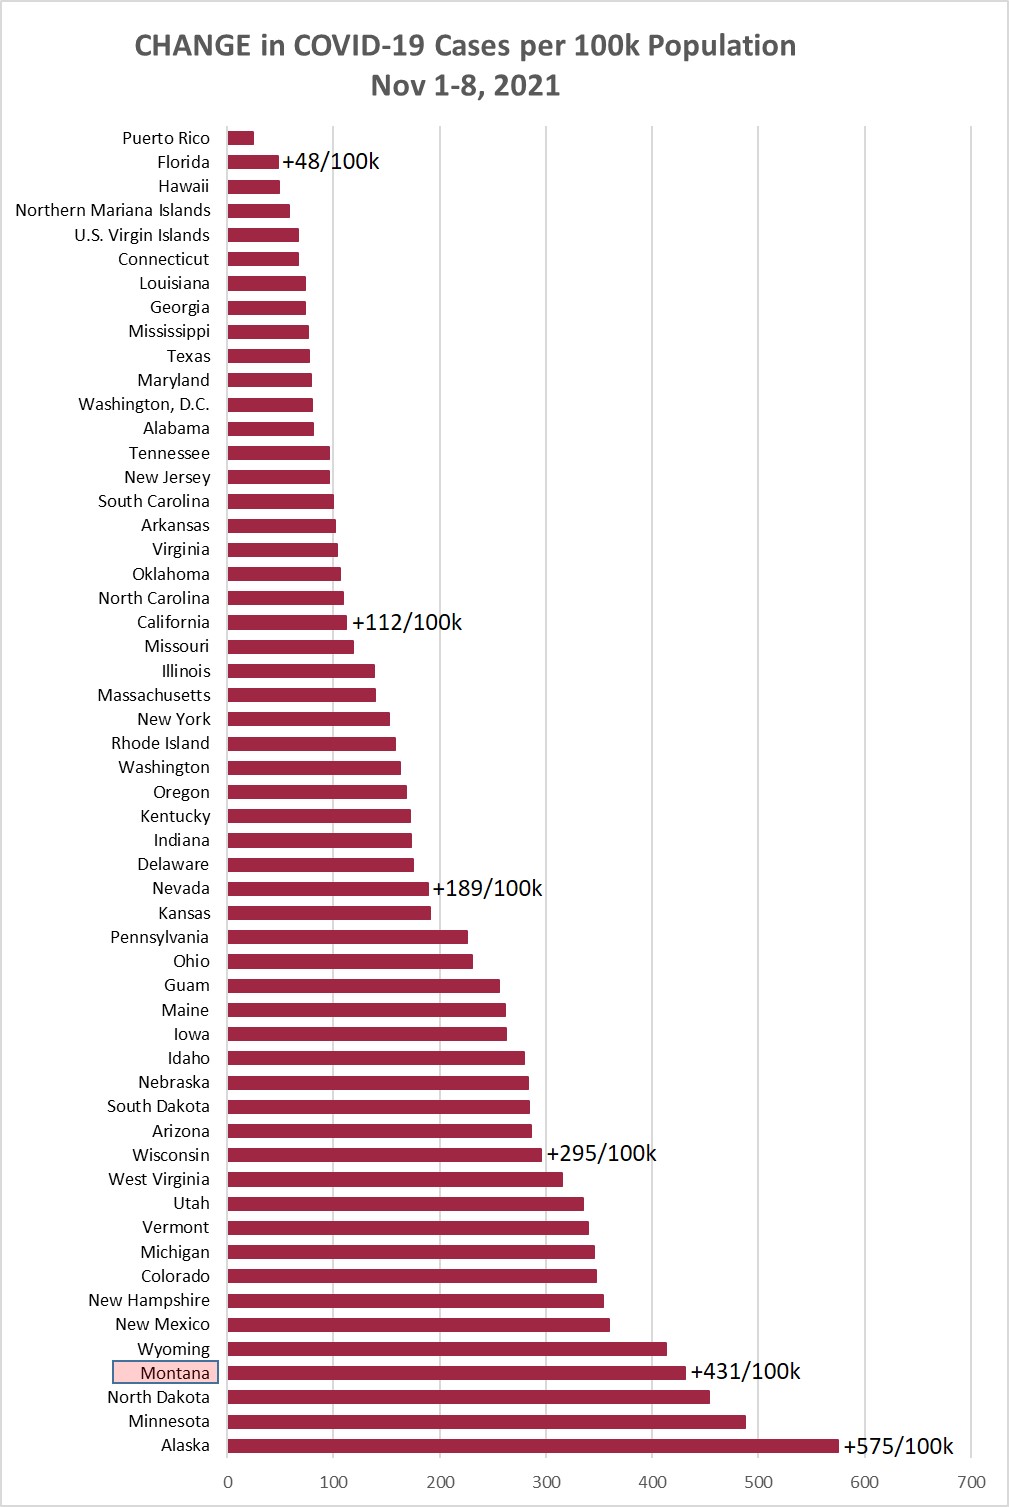
Chart 1 shows the change in cases per 100,000 population as of this morning (November
8, 2021) compared to the cases per 100,000 on November 1, 2021. Montana was up +431/100k
this week, compared to +494/100k the prior week, and +553/100k the week before that.
Montana moved from third to fourth in the weekly number of new cases per 100k. Heading
downward is good.
Chart 2 shows the same information as Chart 1, but with the overall cumulative cases
per 100k in each state to November 8. Montana remained in position 14 this week, and
has now had 16.9% of the population with a positive Covid test at some point during
the pandemic. At the end of September, Montana was in position 23 at 13.6%.
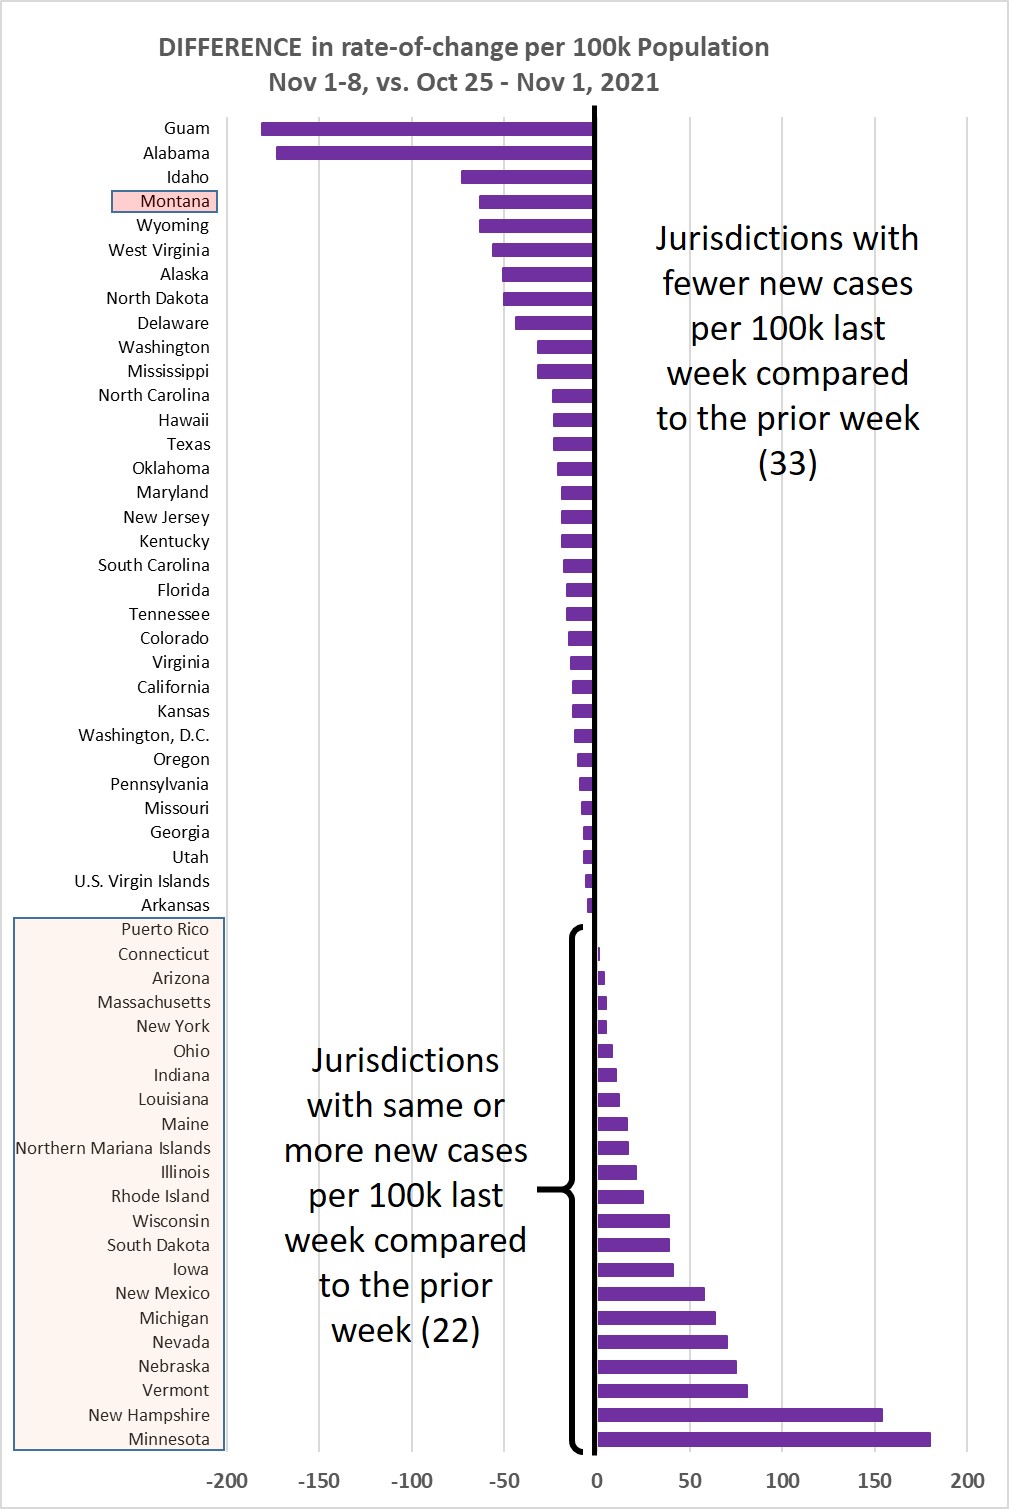
Chart 3 shows the difference in weekly new cases per 100k population for Nov 1-8,
vs. Oct 25-Nov 1, 2021. This past week 33/55 jurisdictions (60%) showed a lower rate
of new cases, and Alaska, Montana, Wyoming, and Idaho all continued to show a declining
trend. Good.
Chart 4 shows the percentage of the population in each jurisdiction having received
1 or 2 Covid-19 vaccination shots. This is sorted by the fraction that have received
2 shots--or one shot of the J&J vaccine. Average across the 55 jurisdictions is 57.04%
being fully immunized--a weekly increase of about 0.33% (weekly increase the prior
week was 0.47%).


Monday, November 1, 2021
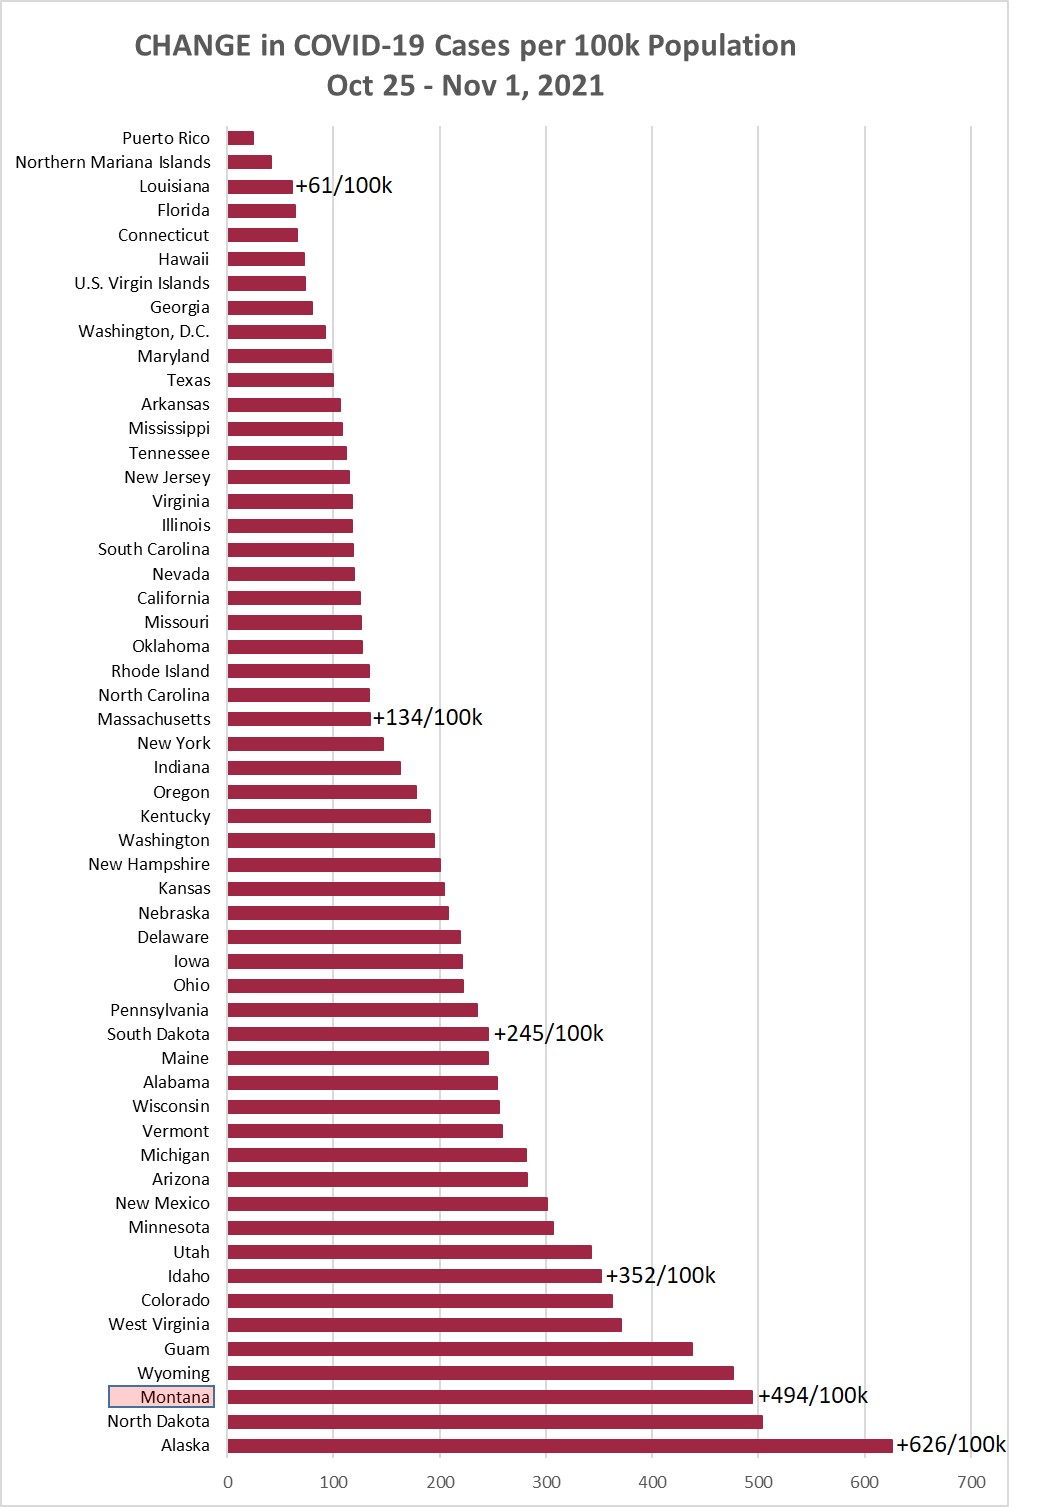
Chart 1 shows the change in cases per 100,000 population as of this morning (November
1, 2021) compared to the cases per 100,000 on October 25, 2021. Montana was up +494/100k
this week, compared to +553/100k the prior week, and +561/100k the week before that.
Montana moved from second to third in the weekly number of new cases per 100k. Heading
downward is good.
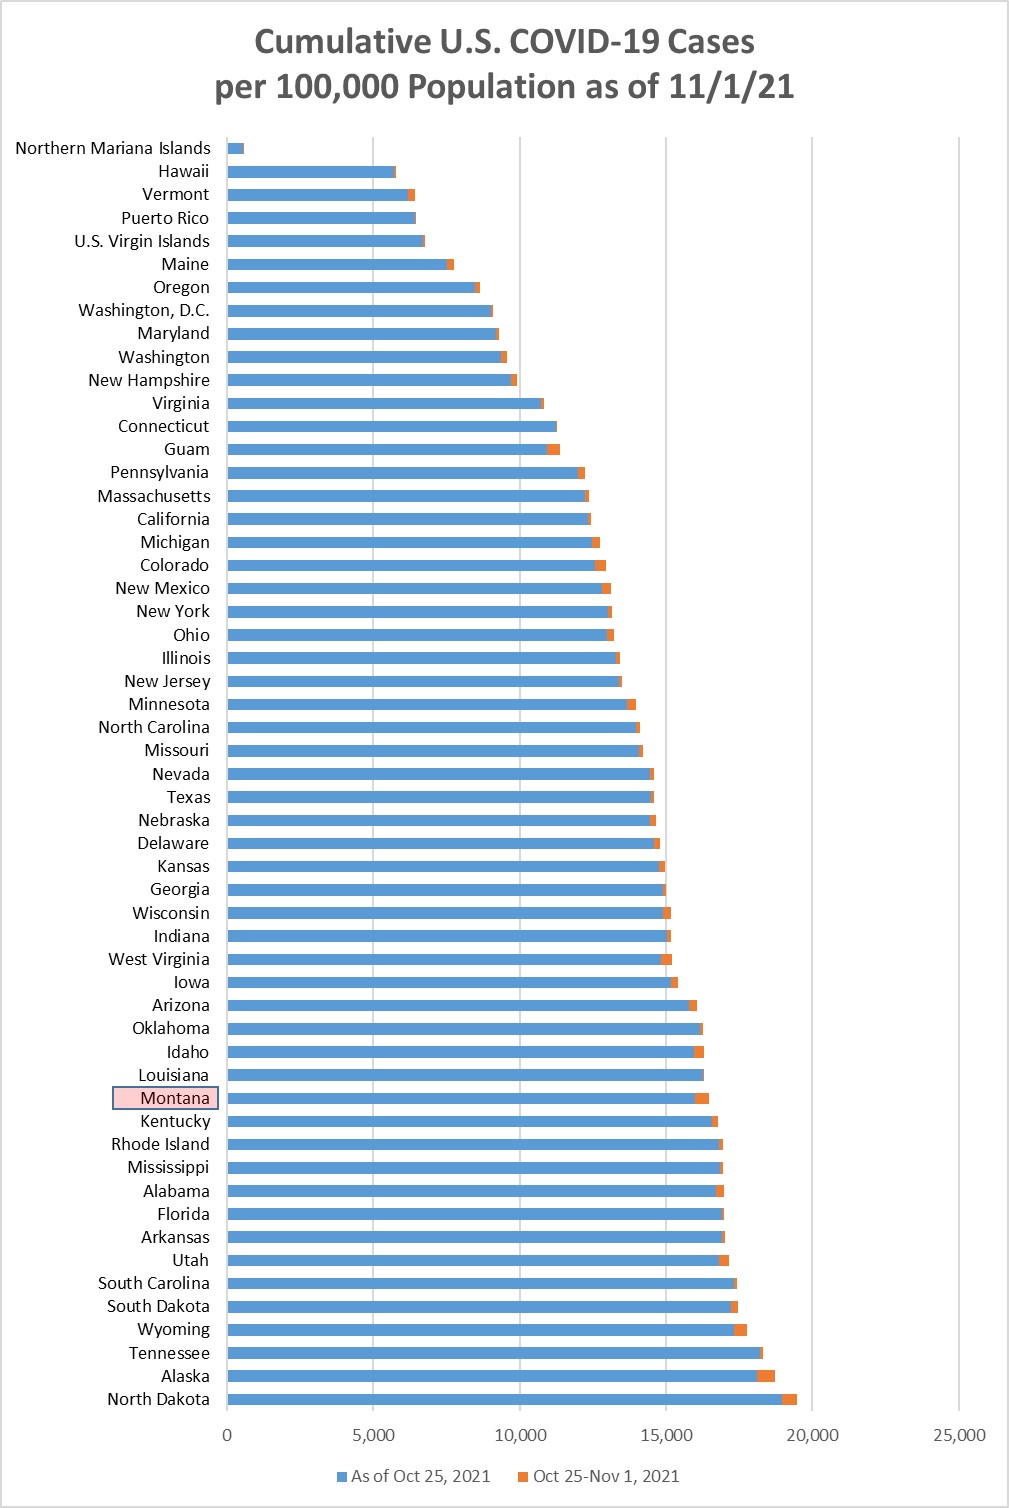
Chart 2 shows the same information as Chart 1, but with the overall cumulative cases
per 100k in each state to November 1. Montana moved up to position 14 this week, and
has now had 16.5% of the population with a positive Covid test at some point during
the pandemic. At the end of September, Montana was in position 23 at 13.6%.
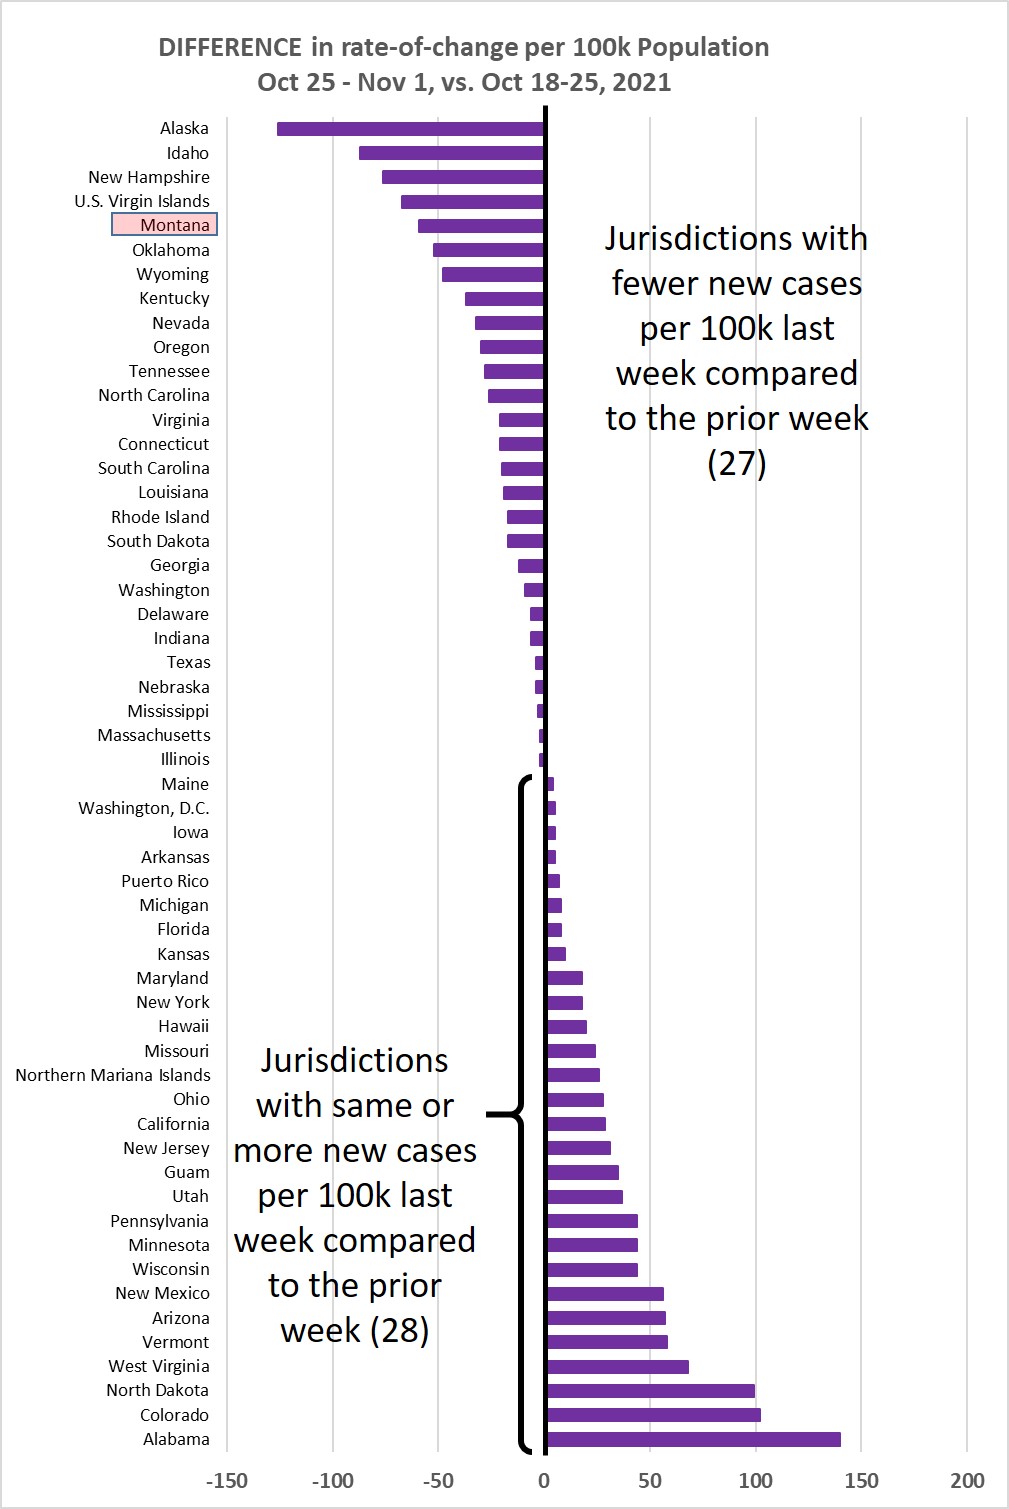
Chart 3 shows the difference in weekly new cases per 100k population for Oct 25-Nov
1, vs. Oct 18-25, 2021. This past week 27/55 jurisdictions (49%) showed a lower rate
of new cases, and Alaska, Montana, Wyoming, and Idaho showed a declining trend. Good.
Chart 4 shows the percentage of the population in each jurisdiction having received
1 or 2 Covid-19 vaccination shots. This is sorted by the fraction that have received
2 shots--or one shot of the J&J vaccine. Average across the 55 jurisdictions is 56.71%
being fully immunized--a weekly increase of about 0.47% (weekly increase the prior
week was 0.42%).

Monday, October 25, 2021
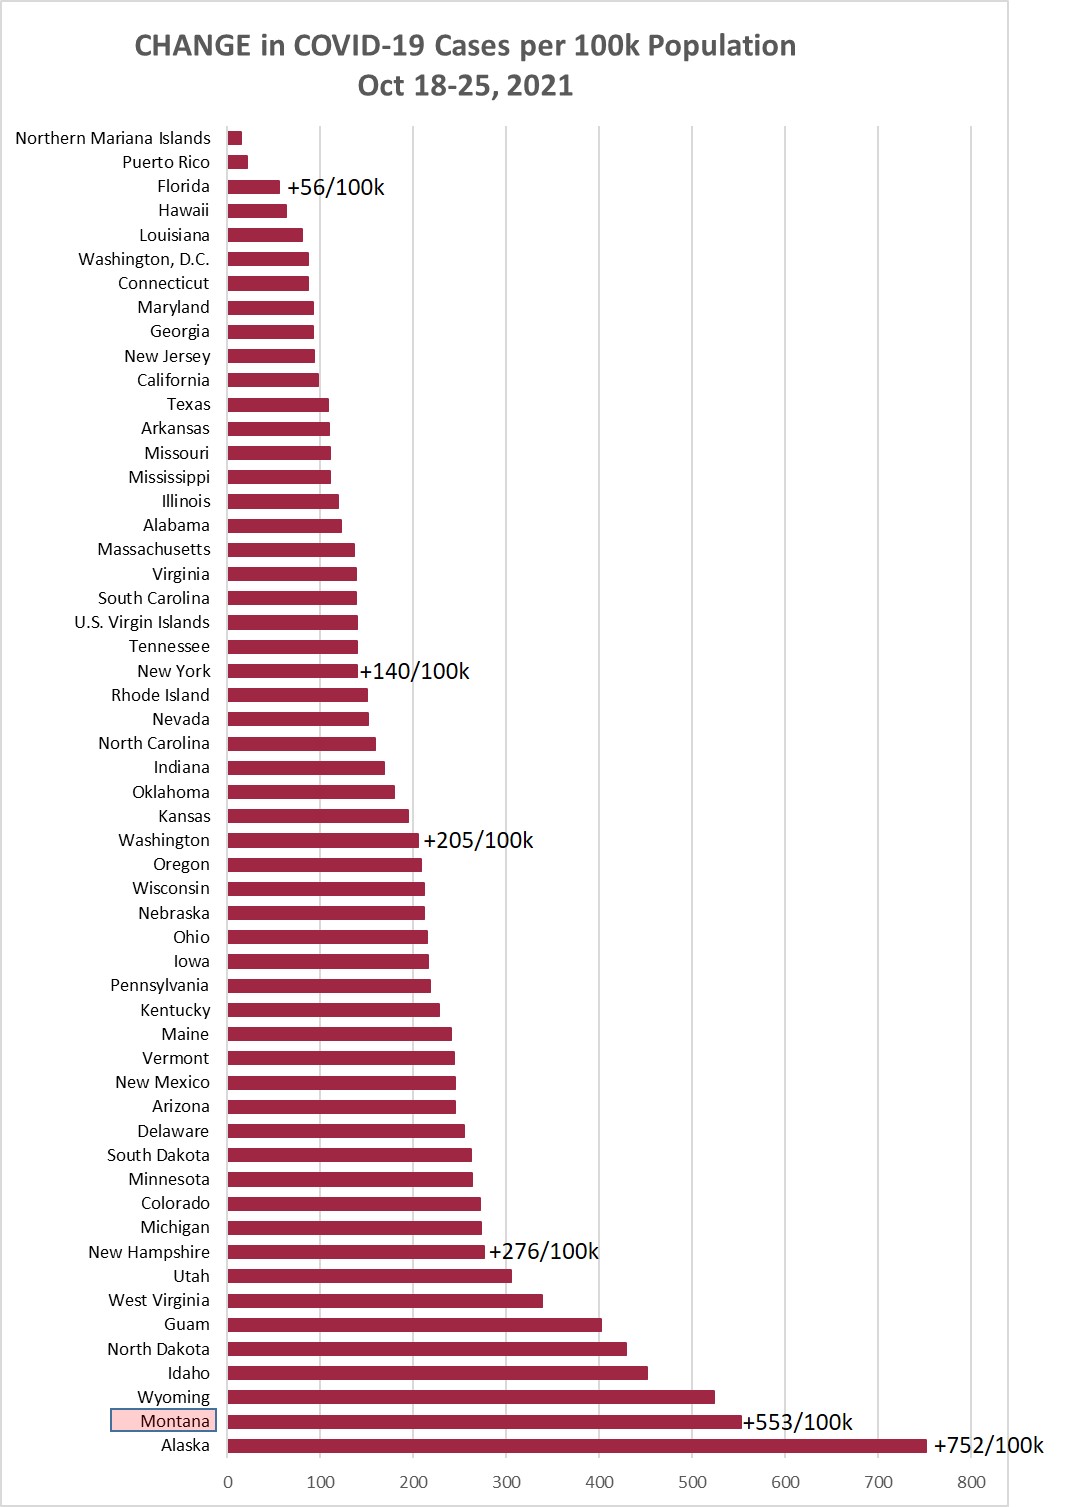
Chart 1 shows the change in cases per 100,000 population as of this morning (October
25, 2021) compared to the cases per 100,000 on October 18, 2021. Montana was up +553/100k
this week, compared to +561/100k the prior week, and +626/100k the week before that.
Montana again had the second highest rate of increase in cases in the country this
week.

But inching downward, hopefully.
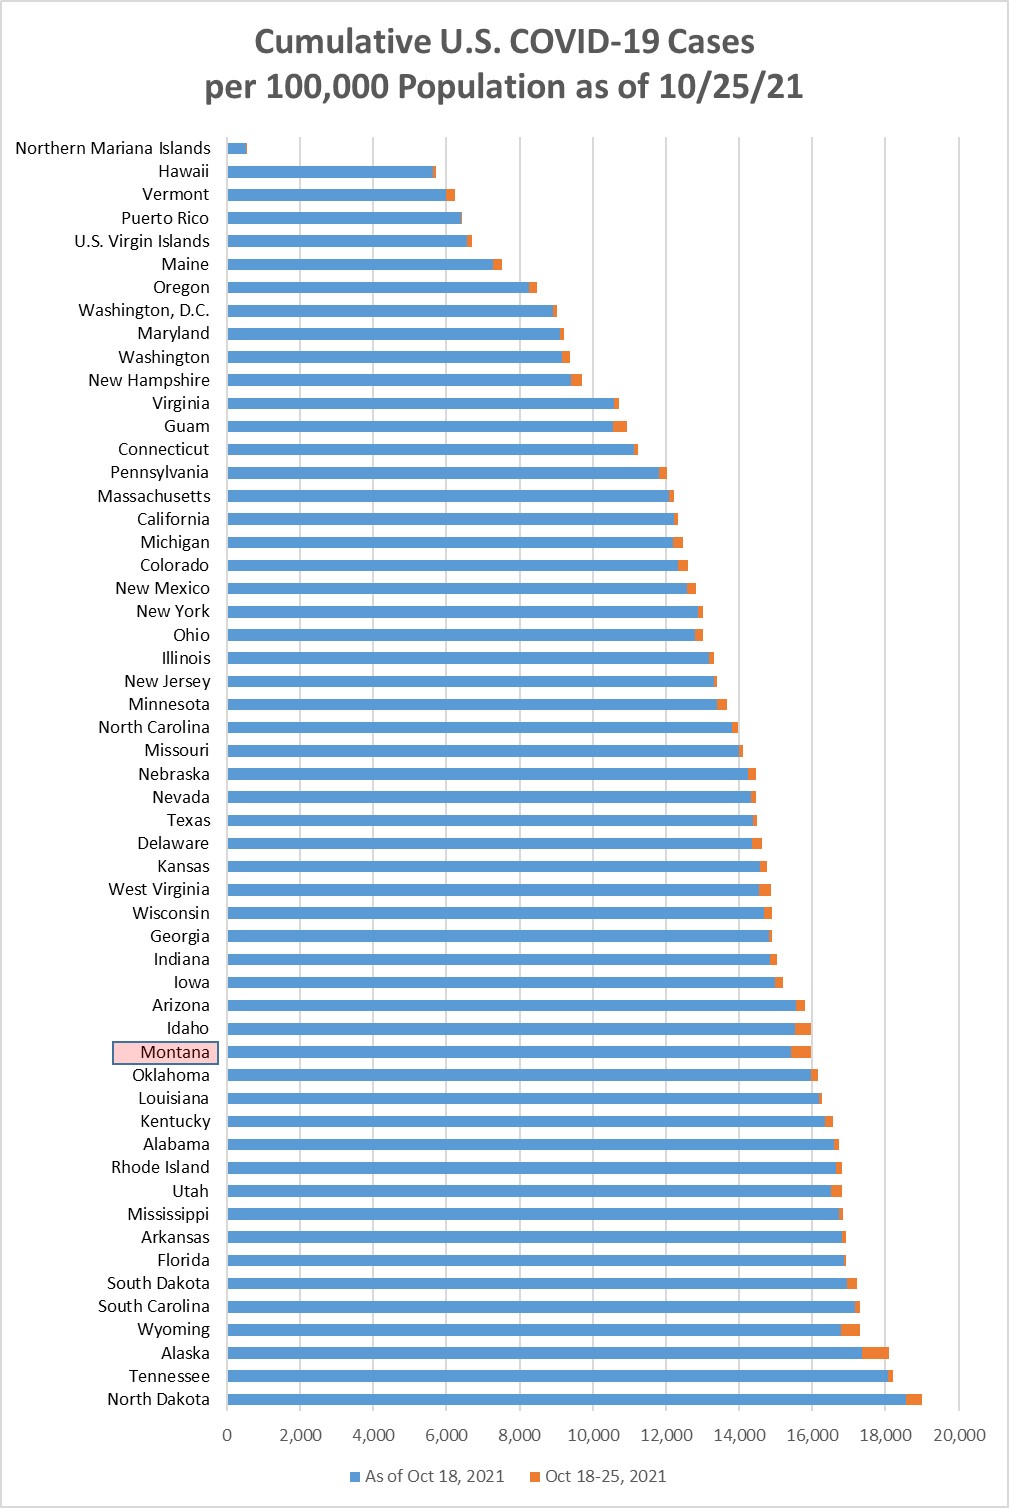
Chart 2 shows the same information as Chart 1, but with the overall cumulative cases
per 100k in each state to October 25. Montana moved up to position 16 this week, and
has now had 15.98% of the population with a positive Covid test at some point during
the pandemic. At the end of September, Montana was at 13.6%.
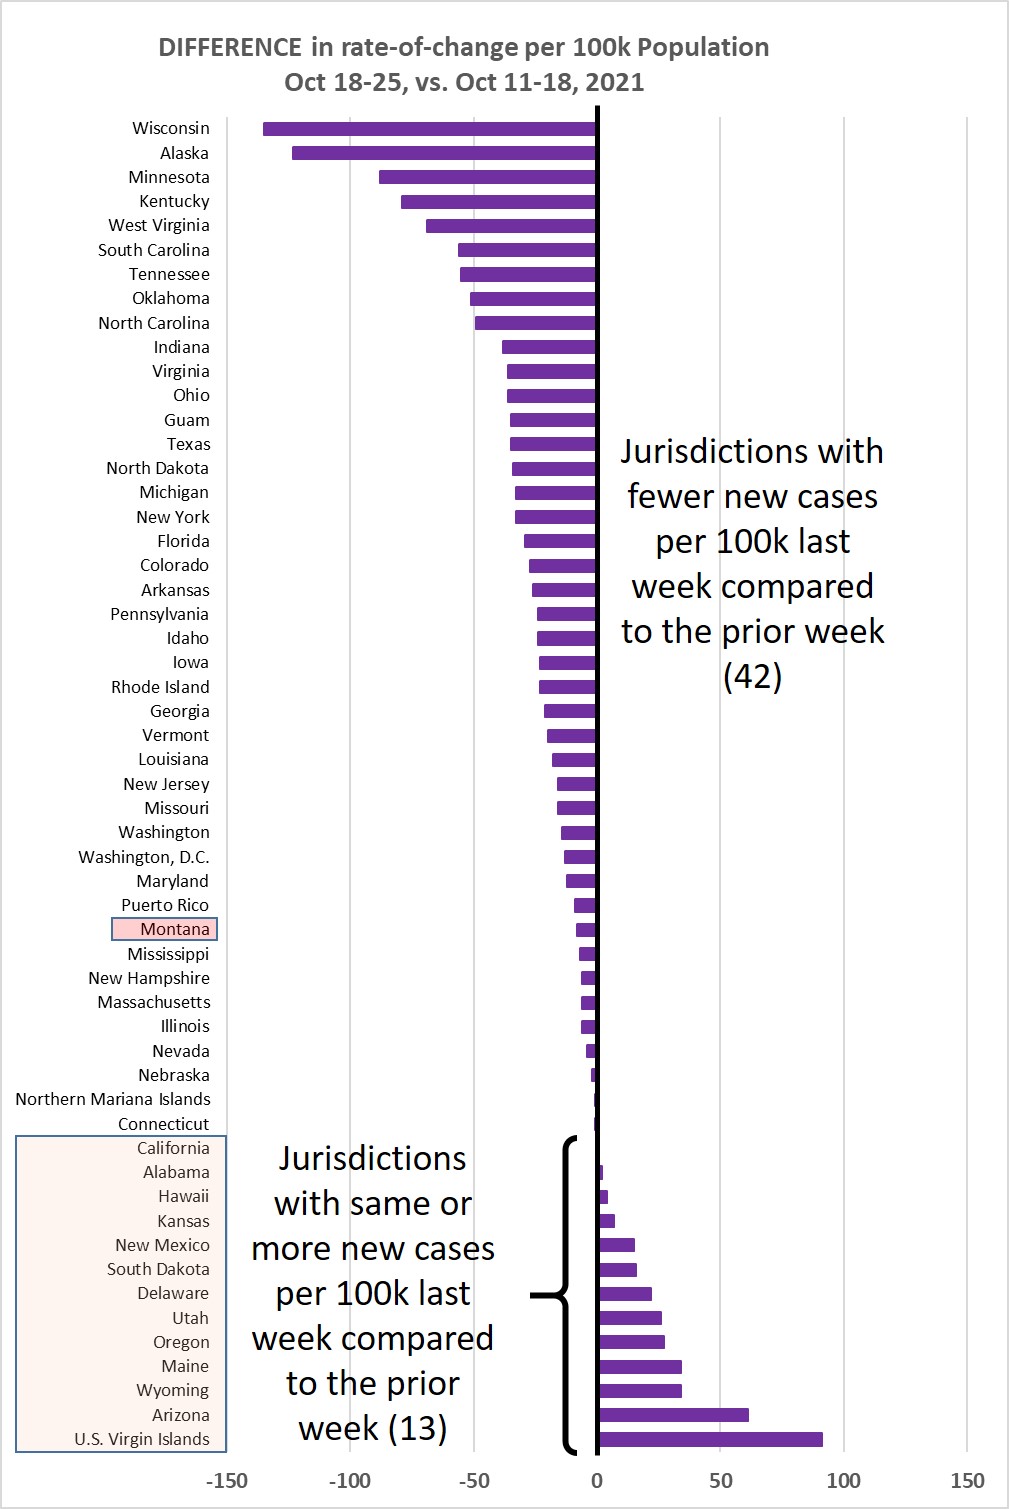
Chart 3 shows the difference in weekly new cases per 100k population for Oct 18-25,
vs. Oct 11-18, 2021. This past week 42/55 jurisdictions (76%) showed a lower rate
of new cases, so despite Alaska, Montana, Wyoming, Idaho, North Dakota, etc., nationally
we continue on a declining trend. Good.
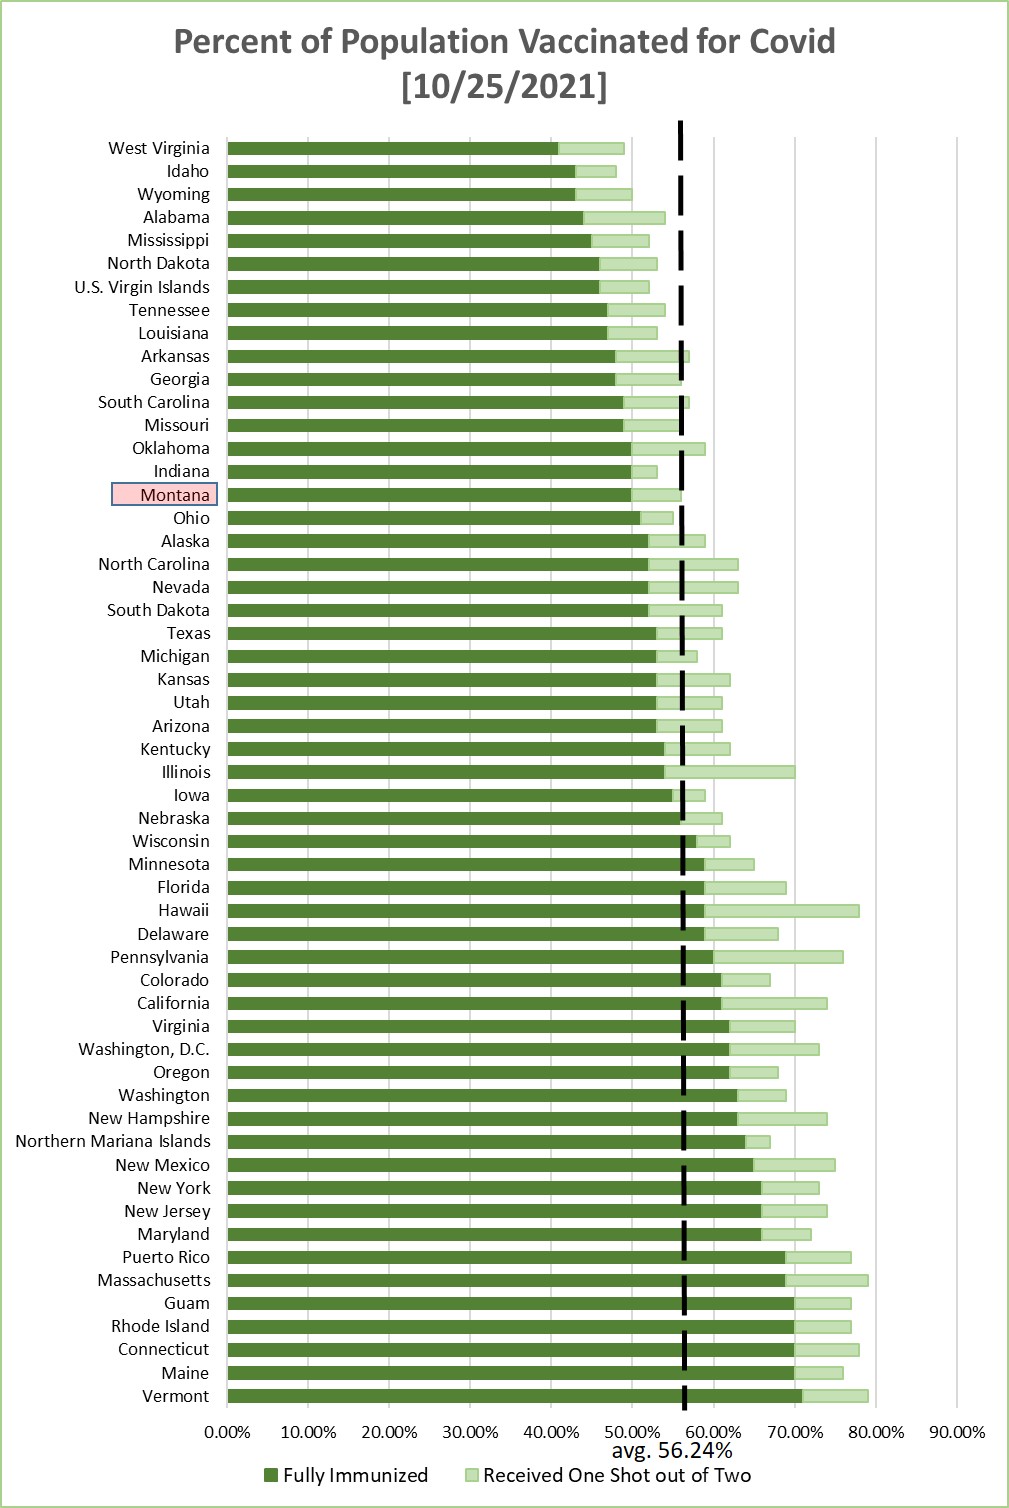
Chart 4 shows the percentage of the population in each jurisdiction having received
1 or 2 Covid-19 vaccination shots. This is sorted by the fraction that have received
2 shots--or one shot of the J&J vaccine. Average across the 55 jurisdictions is 56.24%
being fully immunized--a weekly increase of about 0.42% (weekly increase the prior
week was 0.53%).
Monday, October 18, 2021
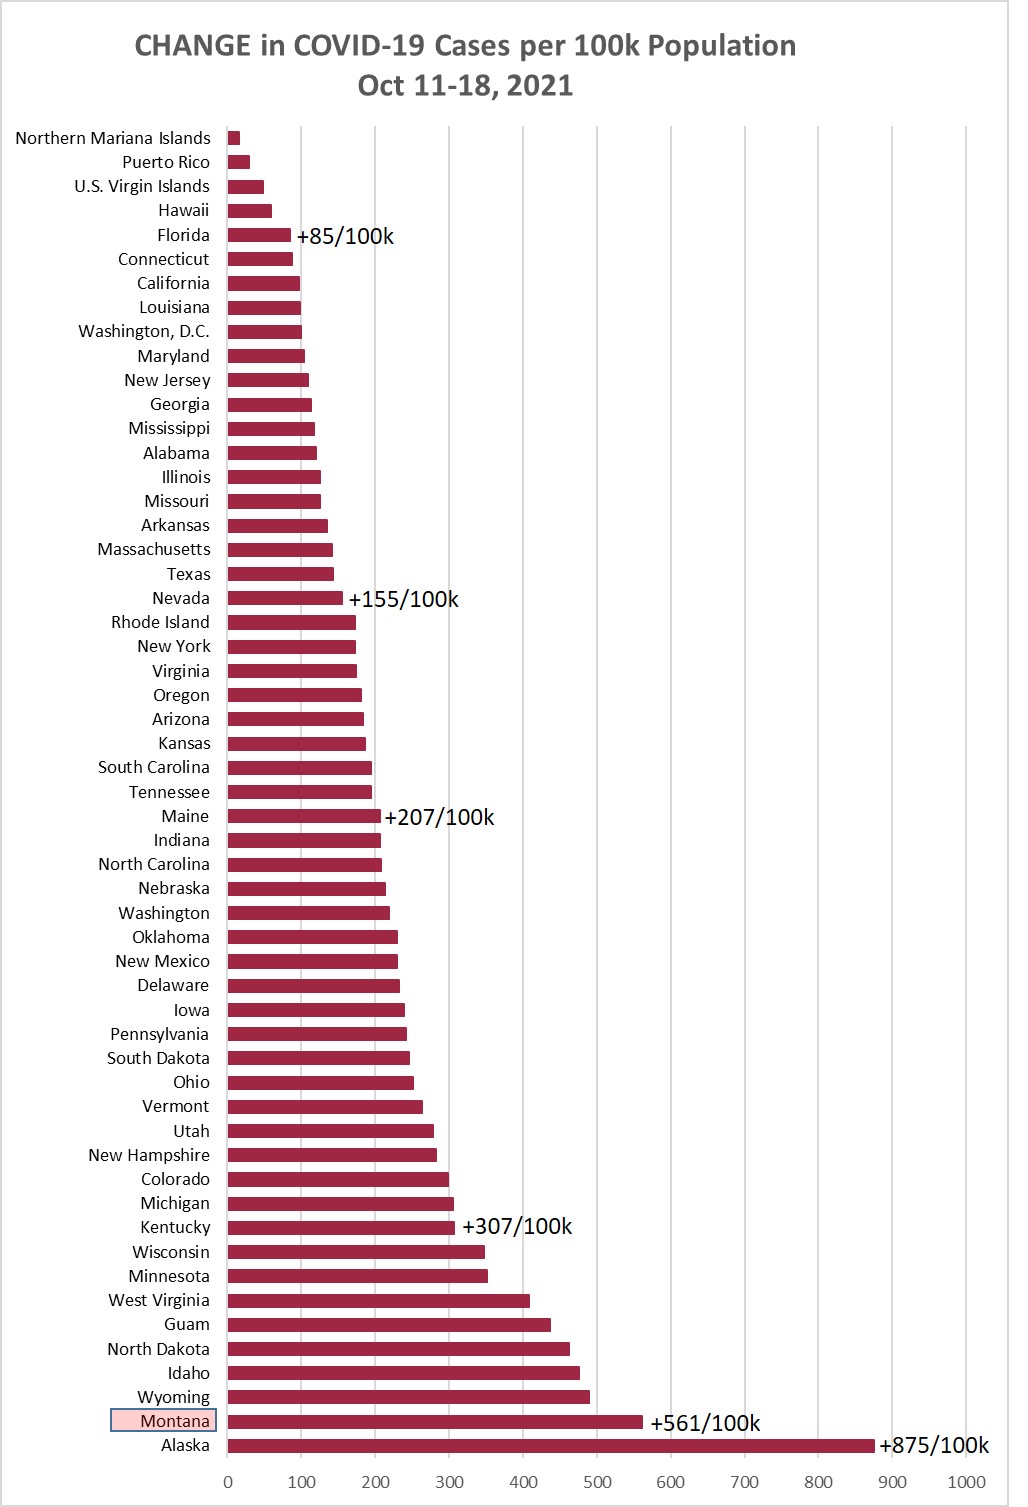
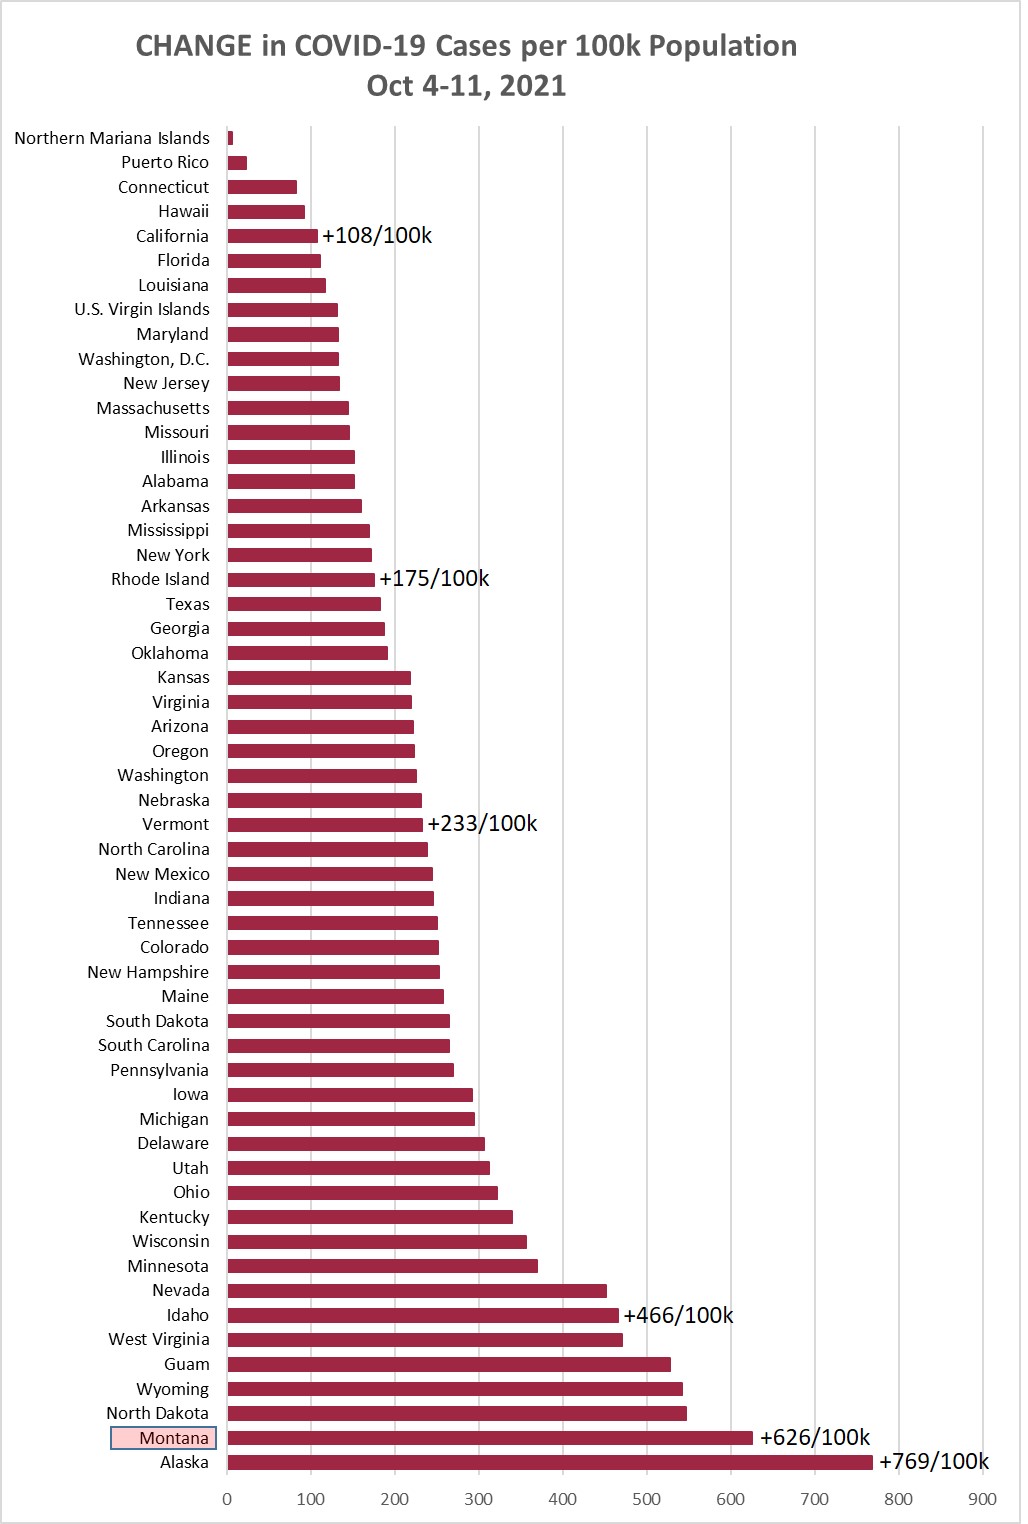
Chart 1 shows the change in cases per 100,000 population as of this morning (October
18, 2021) compared to the cases per 100,000 on October 11, 2021. Montana was up +561/100k
this week, compared to +626/100k the prior week, and +559/100k the week before that.
Montana again had the second highest rate of increase in cases in the country this
week.
But at least it is a bit lower than last week.
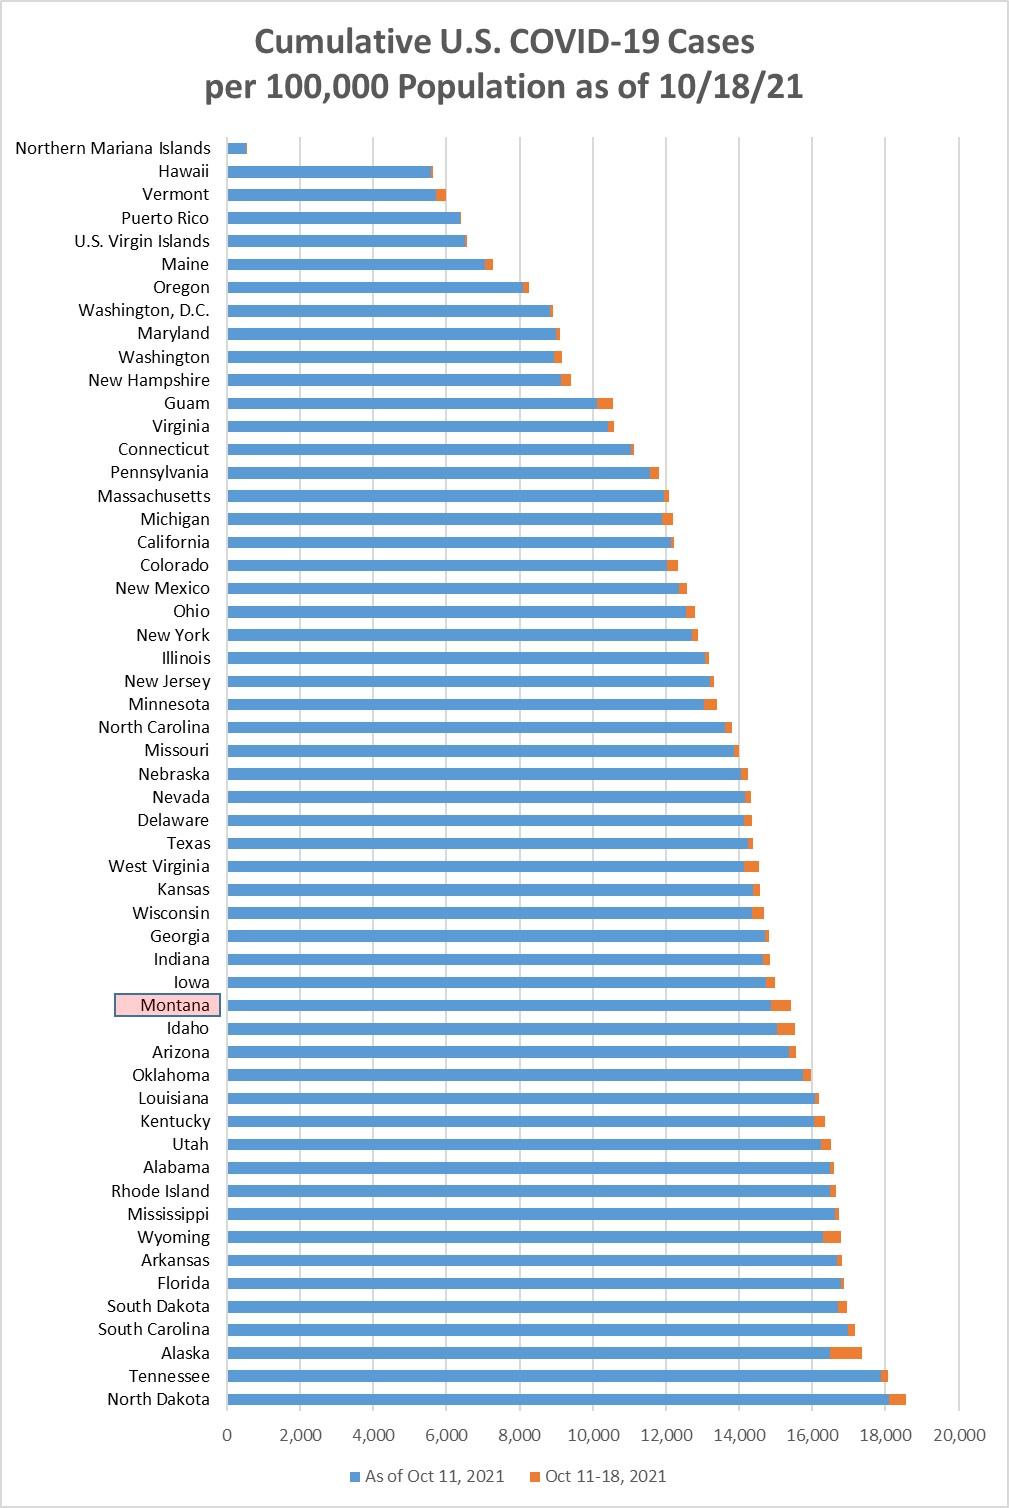
Chart 2 shows the same information as Chart 1, but with the overall cumulative cases
per 100k in each state to October 18. Montana remained in position 18 this week, and
has now had 15.4% of the population with a positive Covid test at some point during
the pandemic. At the end of September, Montana was at 13.6%.
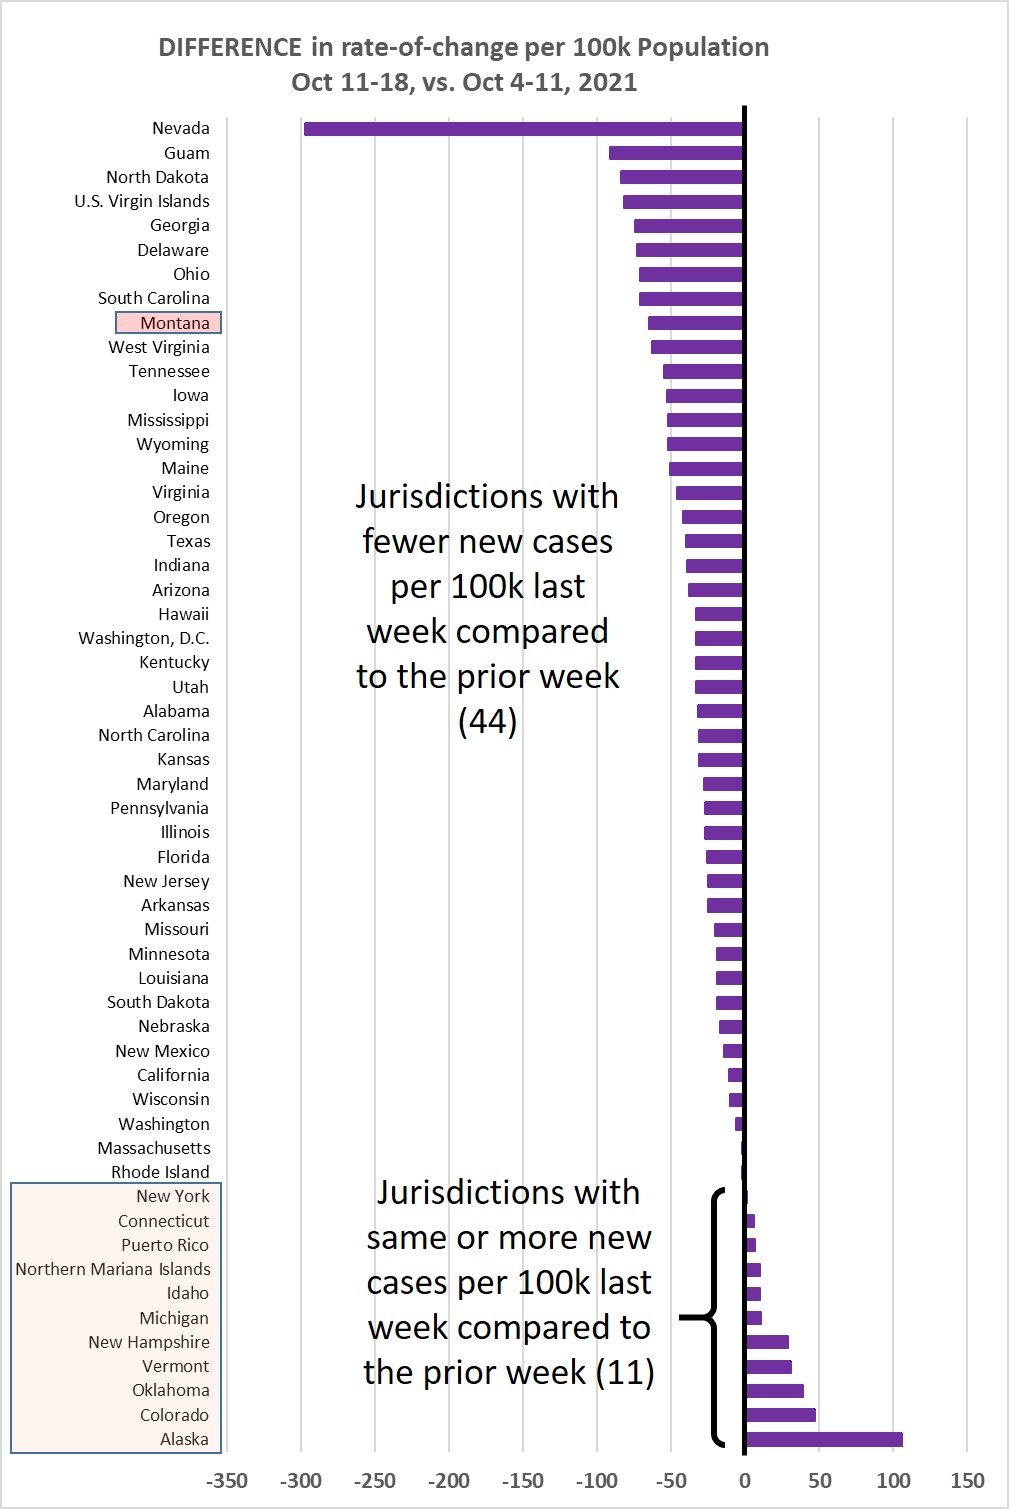
Chart 3 shows the difference in weekly new cases per 100k population for Oct 11-18,
vs. Oct 4-11, 2021. This past week 44/55 jurisdictions (80%) showed a lower rate of
new cases, so despite Alaska, Montana, Wyoming, Idaho, North Dakota, etc., nationally
we continue on a declining trend. That is good to see.
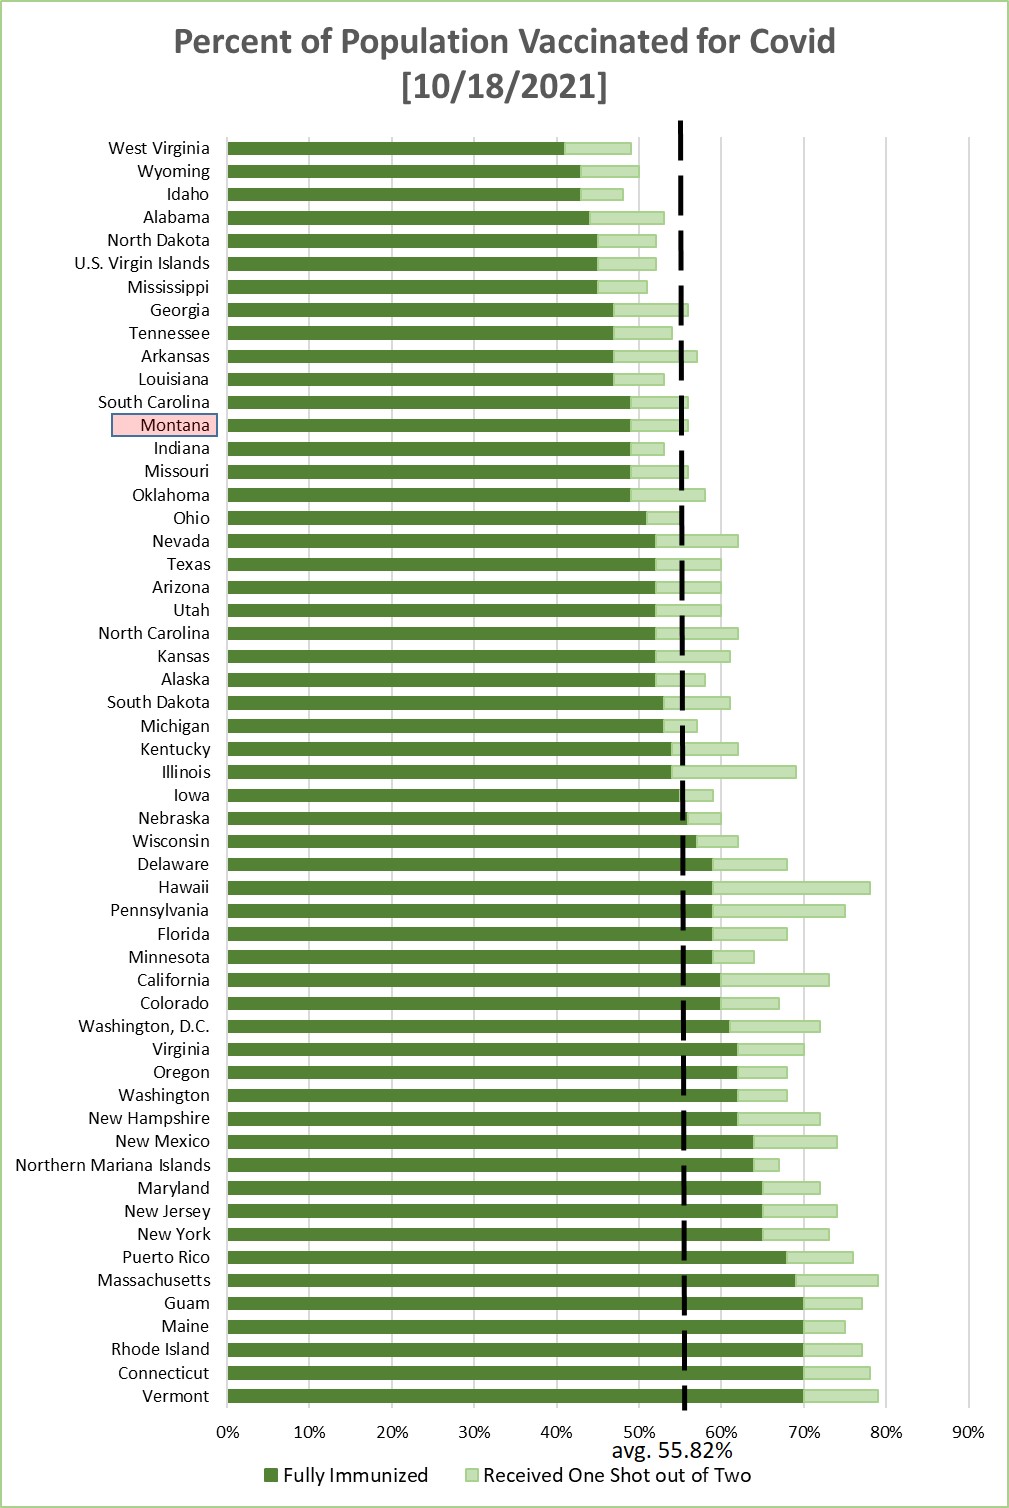
Chart 4 shows the percentage of the population in each jurisdiction having received
1 or 2 Covid-19 vaccination shots. This is sorted by the fraction that have received
2 shots--or one shot of the J&J vaccine. Average across the 55 jurisdictions is 55.82%
being fully immunized--a weekly increase of about 0.53% (weekly increase the prior
week was 0.51%).
Monday, October 11, 2021
Chart 1 shows the change in cases per 100,000 population as of this morning (October
11, 2021) compared to the cases per 100,000 on October 4, 2021. Montana was up +626/100k
this week, compared to +559/100k the prior week, and +594/100k the week before that.
Montana had the second highest rate of increase in cases in the country this week.
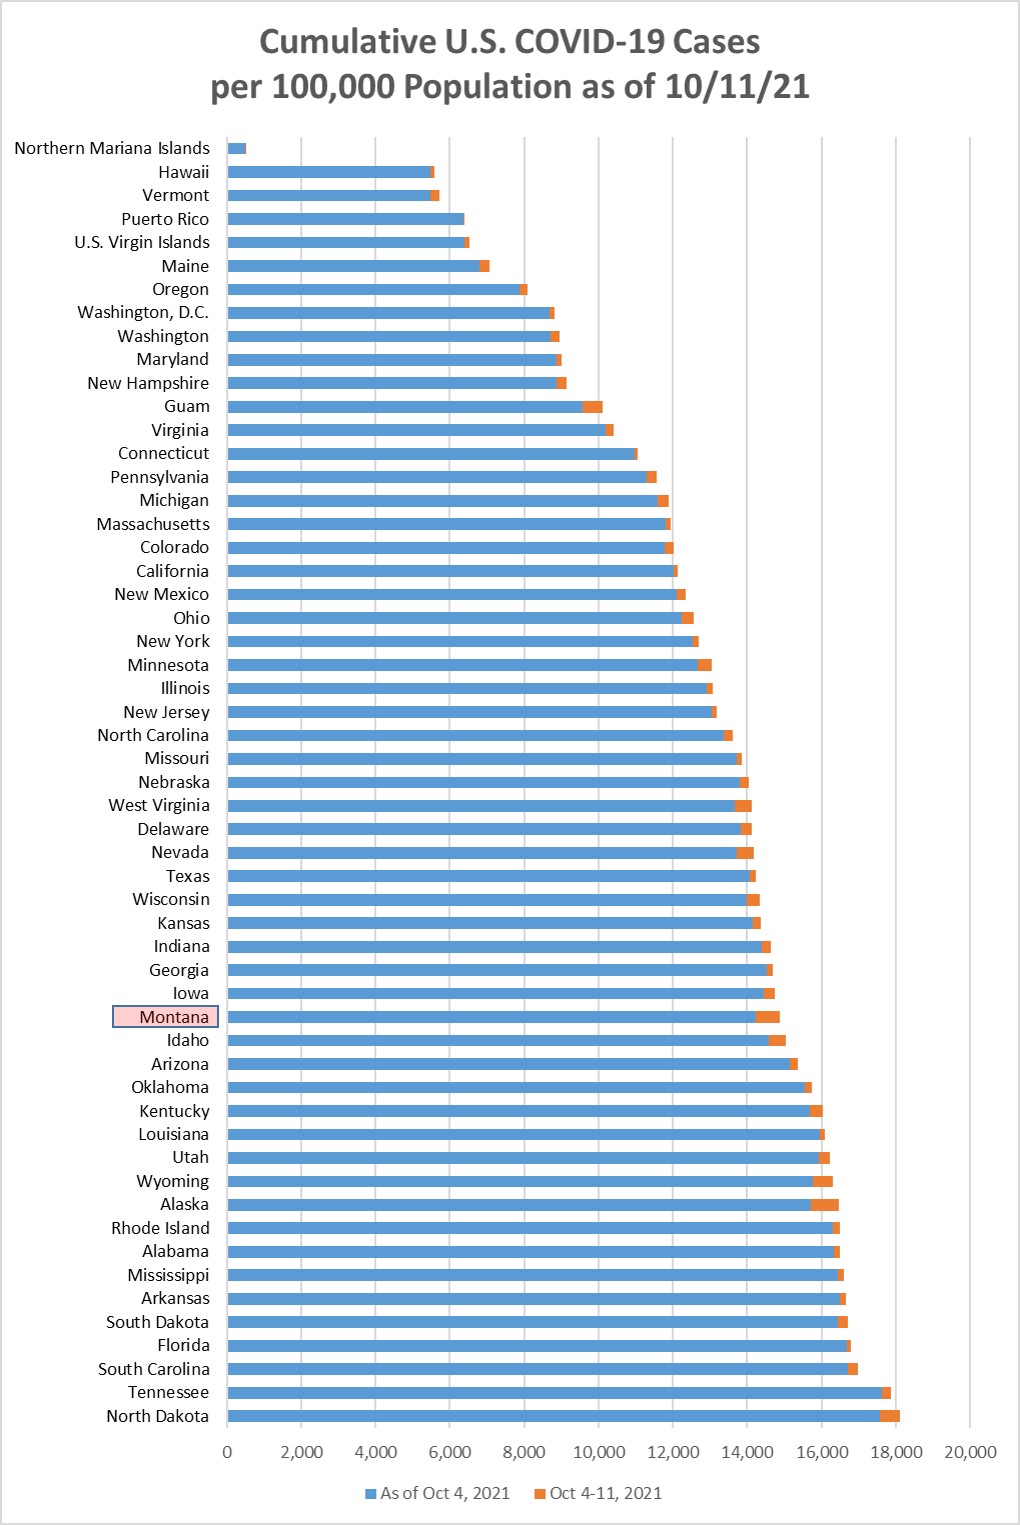
Chart 2 shows the same information as Chart 1, but with the overall cumulative cases
per 100k in each state to October 11. North Dakota regained the top position, with
18.1% of its population (more than 1 out of 6) having a positive Covid test at some
point during the pandemic. Montana moved up to position 18 this week, and has now
had 14.9% of the population with a positive Covid test at some point during the pandemic.
At the end of September, Montana was at 13.6%.
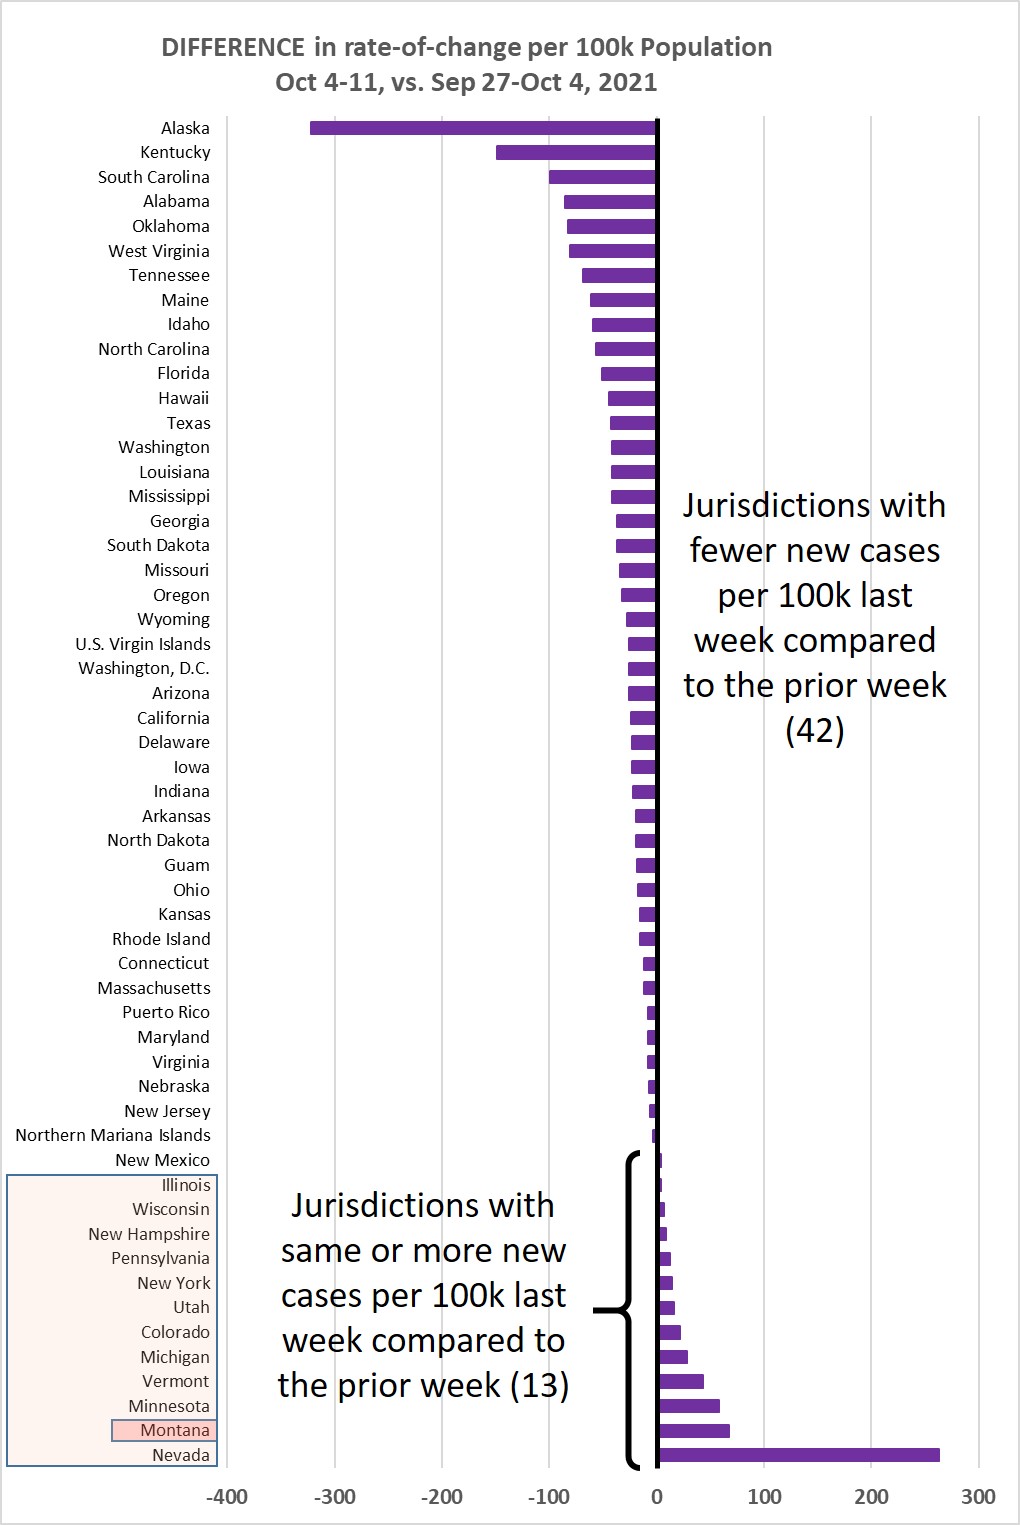
Chart 3 shows the difference in weekly new cases per 100k population for Oct 4-11,
vs. Sep 27 - Oct 4, 2021. This past week 42/55 jurisdictions (76%) showed a lower
rate of new cases, so despite Alaska, Montana, North Dakota, Wyoming, etc., nationally
we continue on a declining trend. That's good. Now c'mon, Montana!
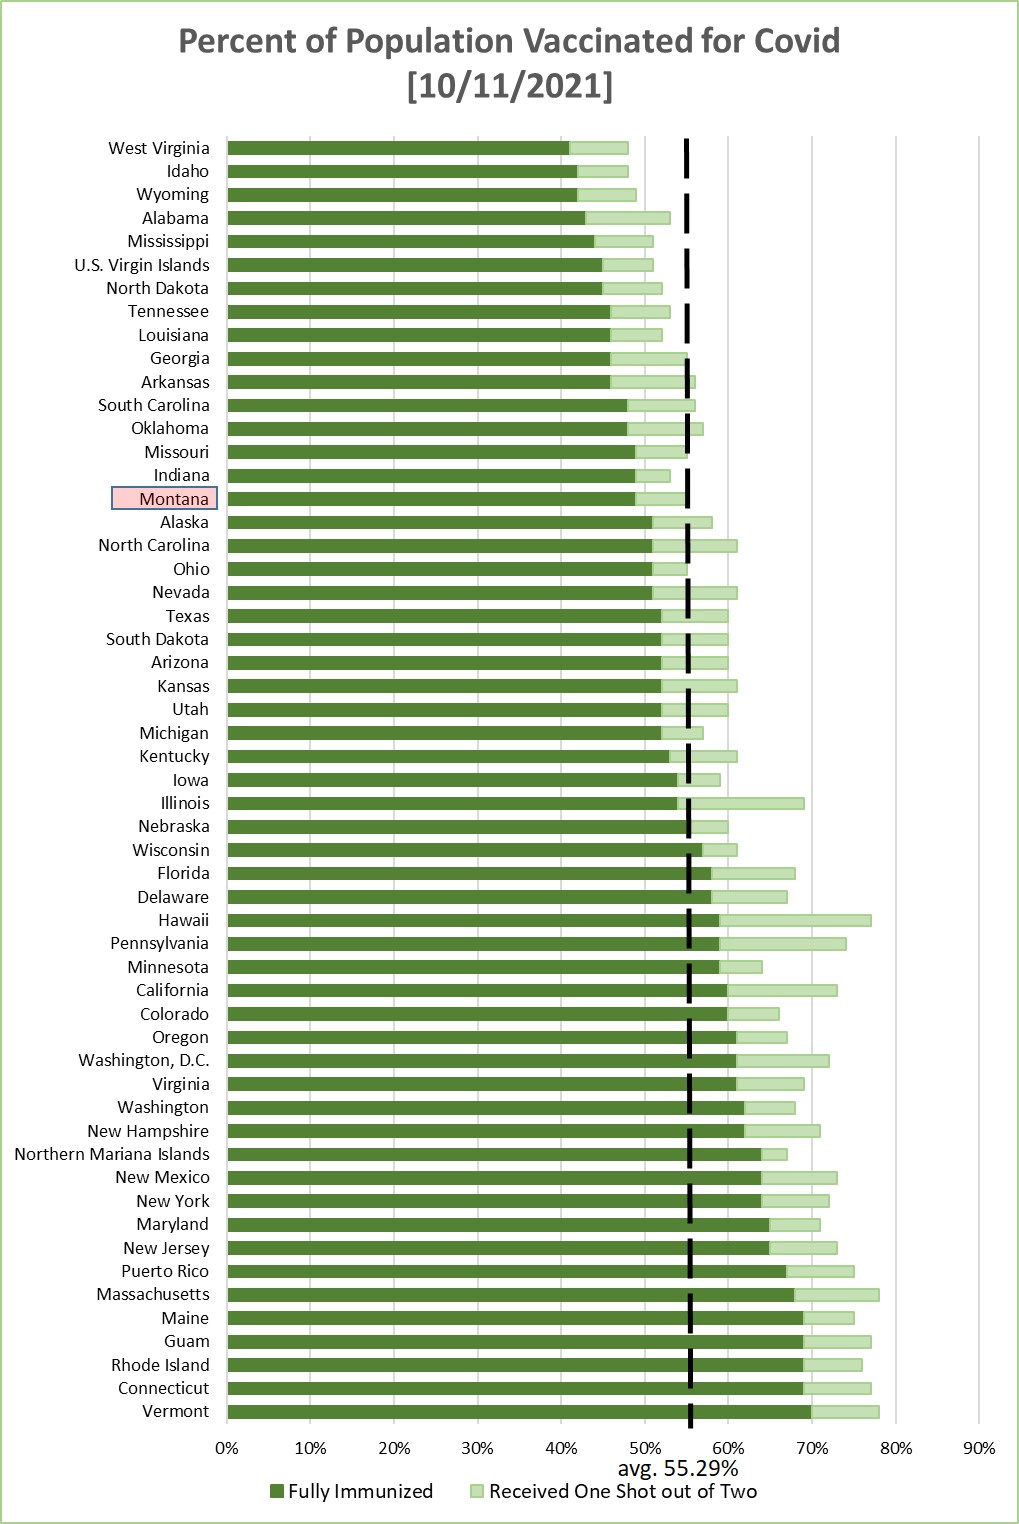
Chart 4 shows the percentage of the population in each jurisdiction having received
1 or 2 Covid-19 vaccination shots. This is sorted by the fraction that have received
2 shots--or one shot of the J&J vaccine. Average across the 55 jurisdictions is 55.29%
being fully immunized--a weekly increase of about 0.51% (weekly increase the prior
week was 0.60%).
Monday, October 4, 2021
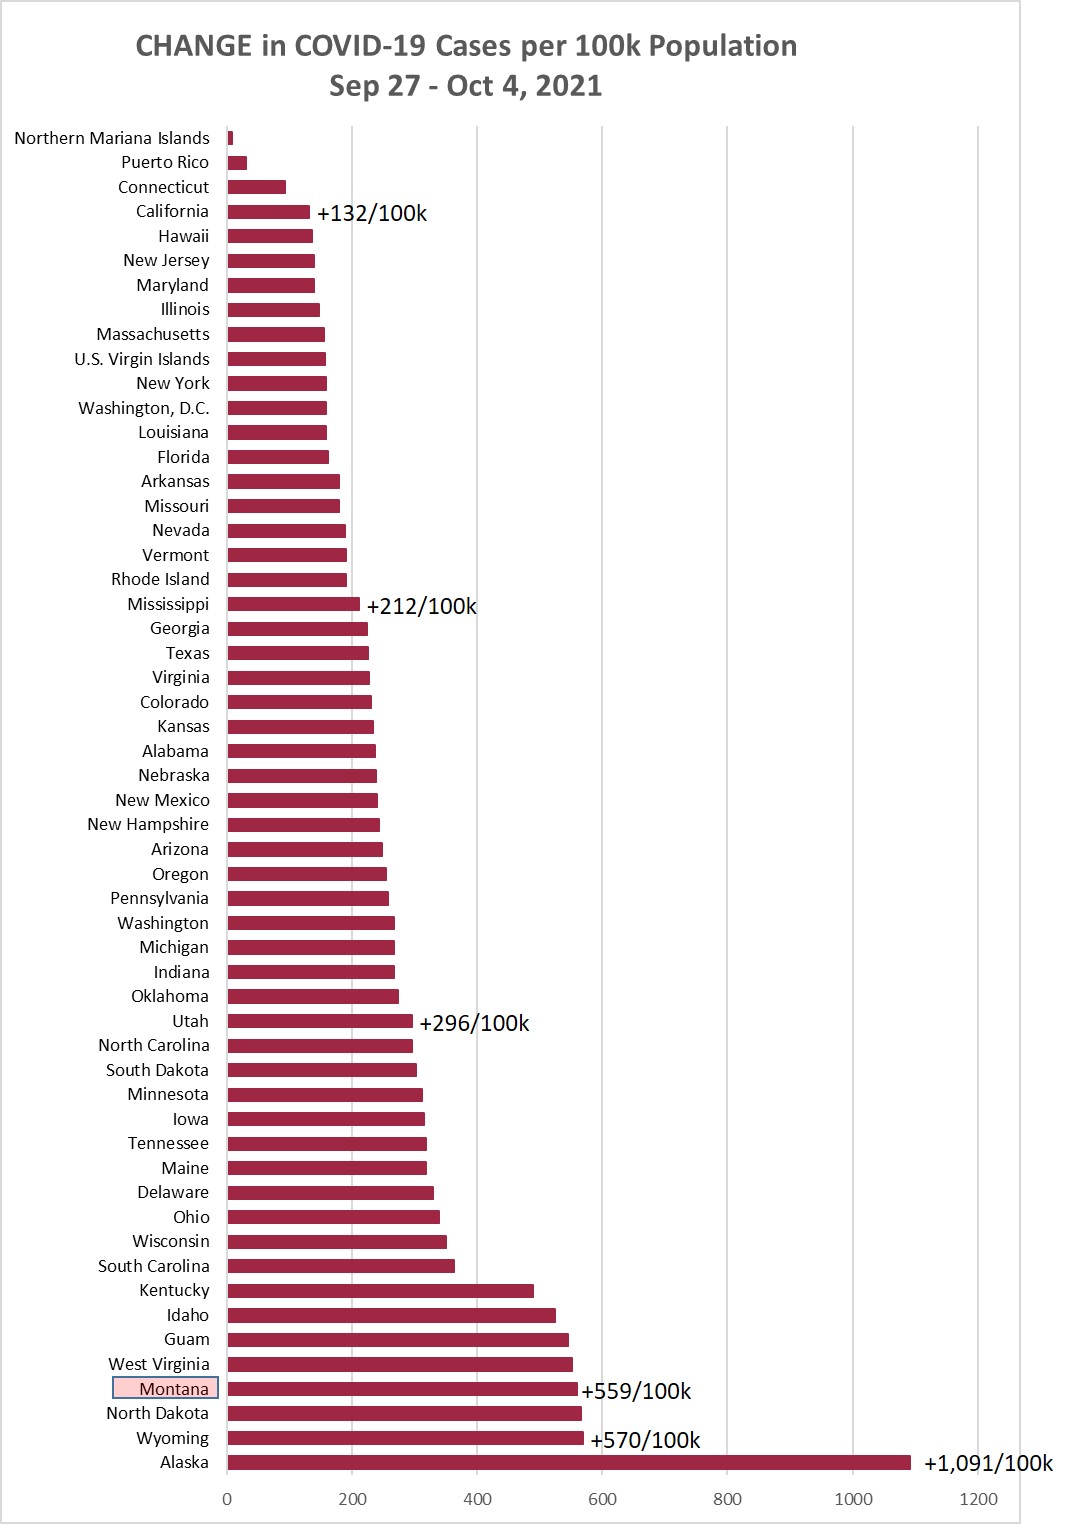
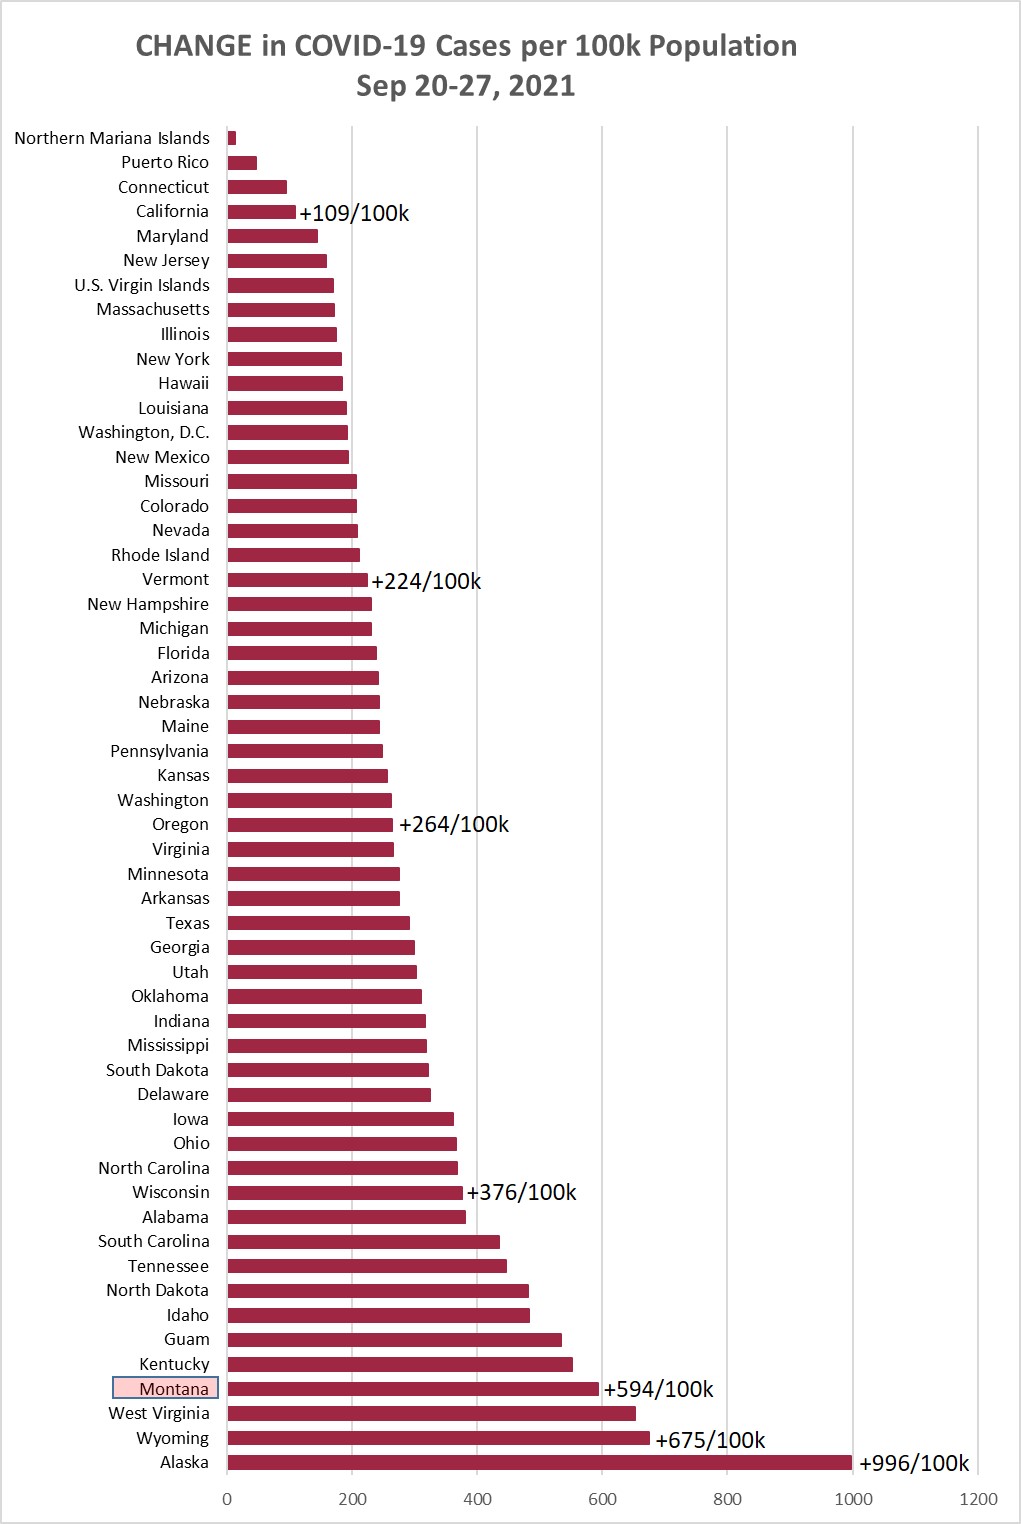
Chart 1 shows the change in cases per 100,000 population as of this morning (October
4, 2021) compared to the cases per 100,000 on September 27, 2021. Montana was up +559/100k
this week, compared to +594/100k the prior week, and +561/100k the week before that.
(A year ago this week Montana had +244/100k.)
Alaska was up +1,091/100k: just over 1% of Alaskans turned up positive for Covid in
one week.

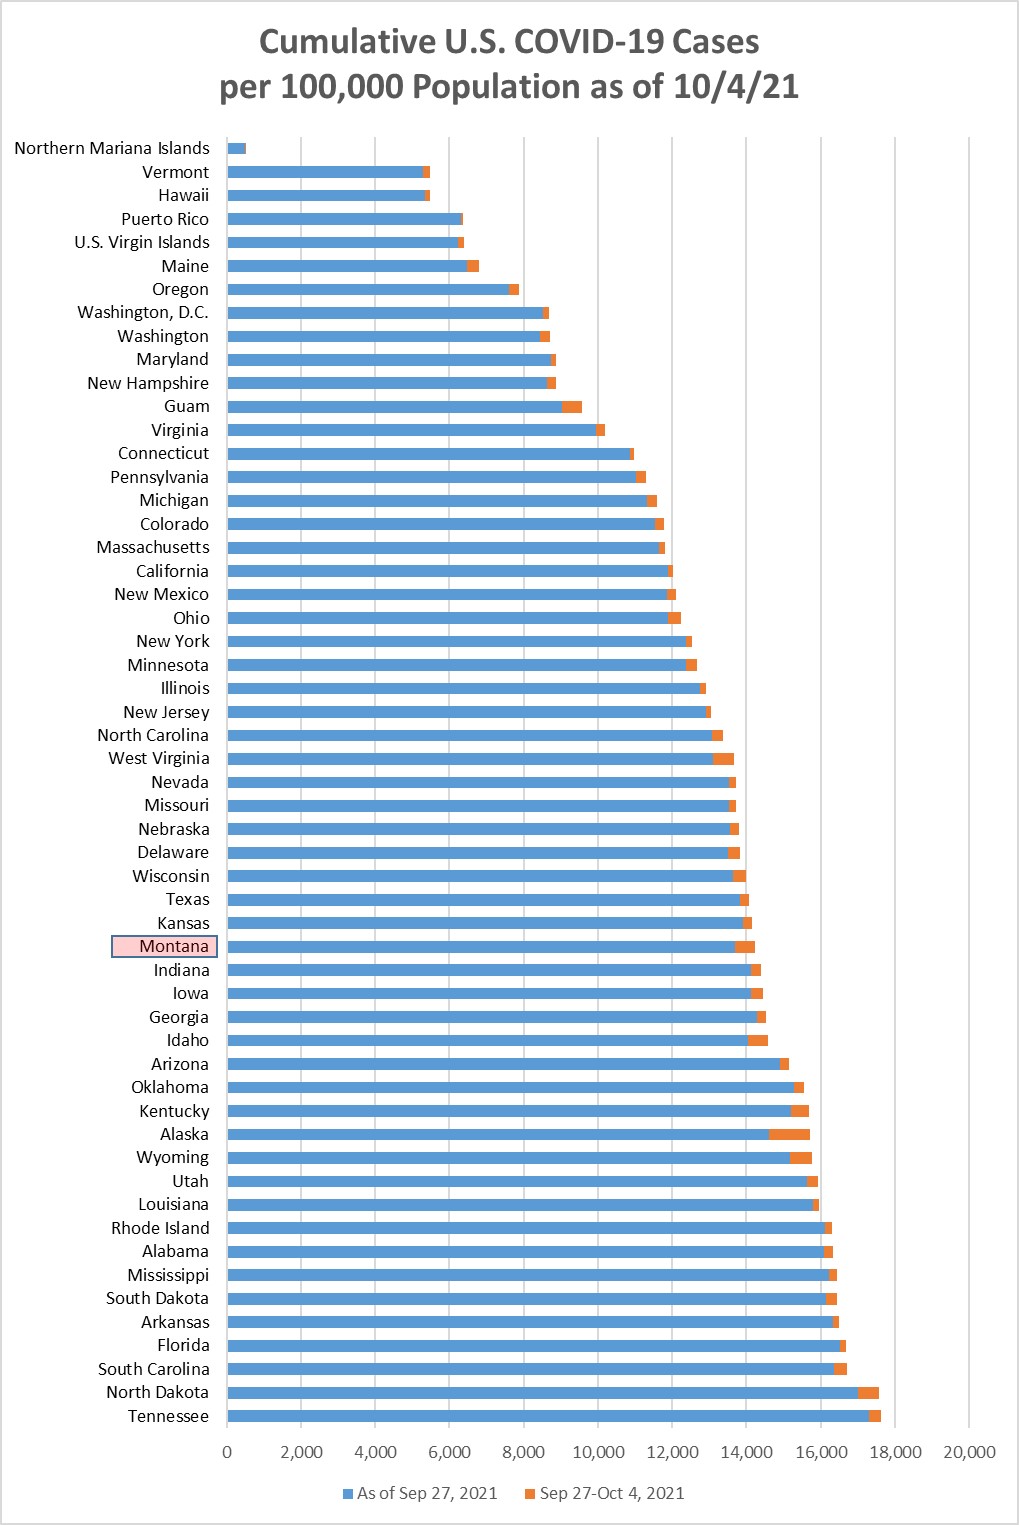
Chart 2 shows the same information as Chart 1, but with the overall cumulative cases
per 100k in each state to October 4. Tennessee remains in the top position, with 17.6%
of its population having a positive Covid test at some point during the pandemic.
Montana has now had 14.2% of the population with a positive Covid test at some point
during the pandemic, which is up 0.5% from last week.
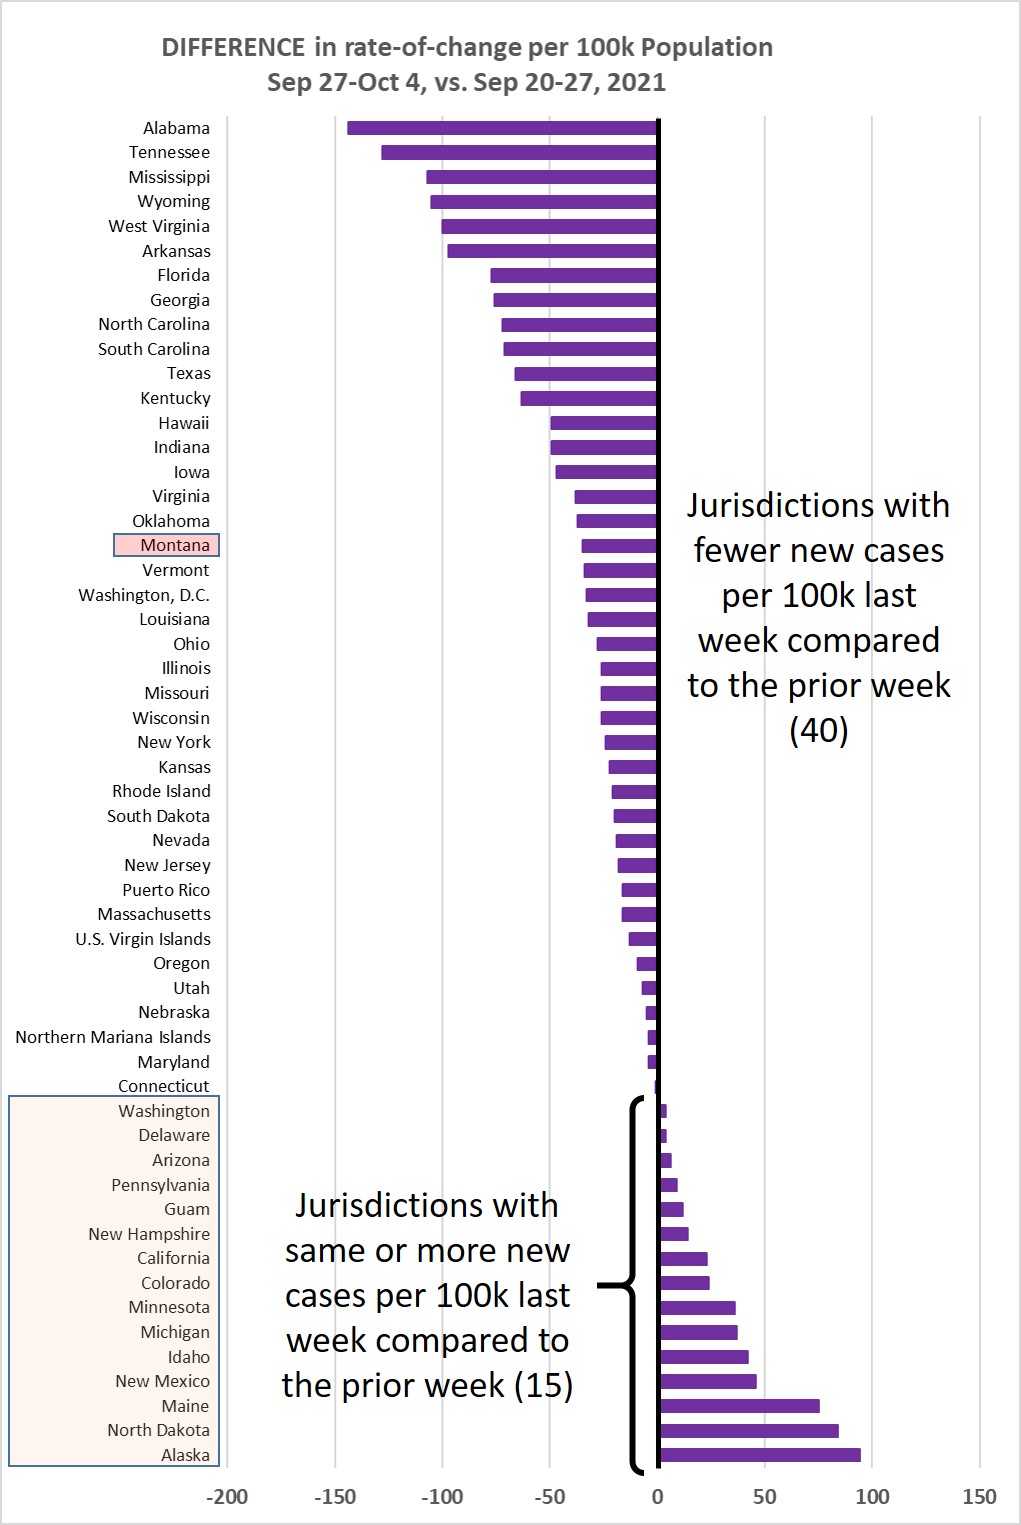
Chart 3 shows the difference in weekly new cases per 100k population for Sep 27 -
Oct 4, vs. Sep 20-27, 2021. This past week 40/55 jurisdictions (73%) showed a lower
rate of new cases, so despite Alaska, North Dakota, Idaho, etc., nationally we continue
on a declining trend. That's very good.
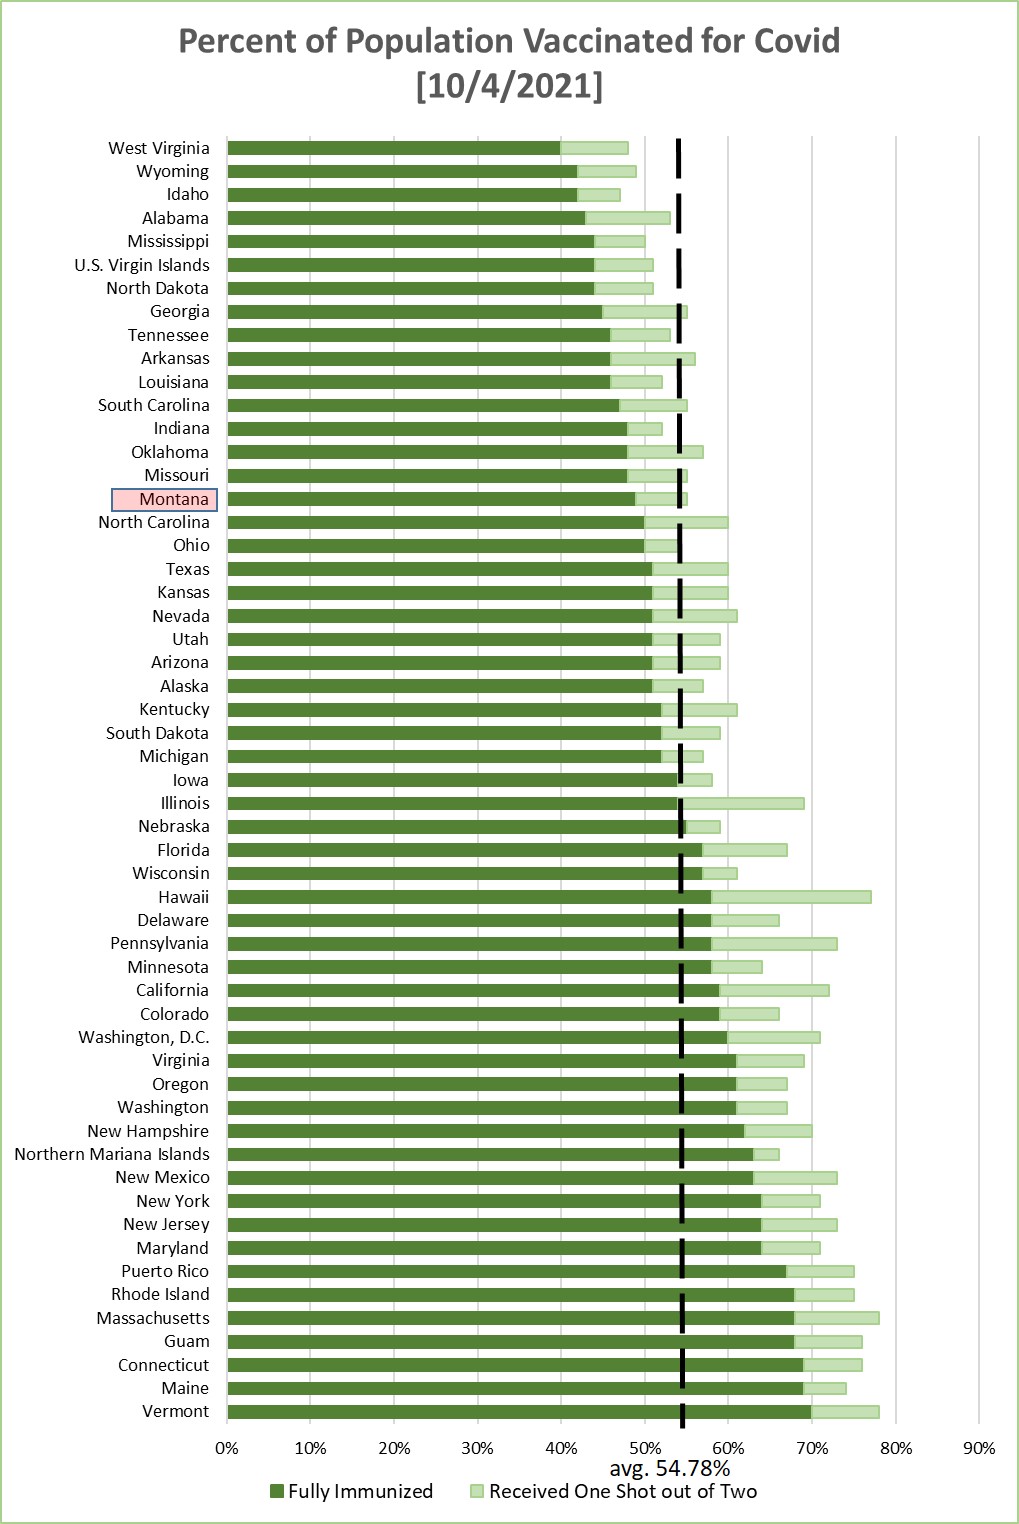
Chart 4 shows the percentage of the population in each jurisdiction having received
1 or 2 Covid-19 vaccination shots. This is sorted by the fraction that have received
2 shots--or one shot of the J&J vaccine. Average across the 55 jurisdictions is 54.78%
being fully immunized--a weekly increase of about 0.60% (weekly increase the prior
week was 0.69%).
Monday, September 27, 2021
Chart 1 shows the change in cases per 100,000 population as of this morning (September
27, 2021) compared to the cases per 100,000 on September 20, 2021. Montana was up
+594/100k this week, compared to +561/100k the prior week, and +396/100k the week
before that. (A year ago this week Montana had +169/100k.)
Alaska was up +997/100k, which means nearly 1% of Alaskans turned up positive for
Covid this past week alone!!
Chart 2 shows the same information as Chart 1, but with the overall cumulative cases
per 100k in each state to September 27. Tennessee remains in the top position, with
17.3% of its population having a positive Covid test at some point during the pandemic.
Montana has now had 13.7% of the population with a positive Covid test at some point
during the pandemic.
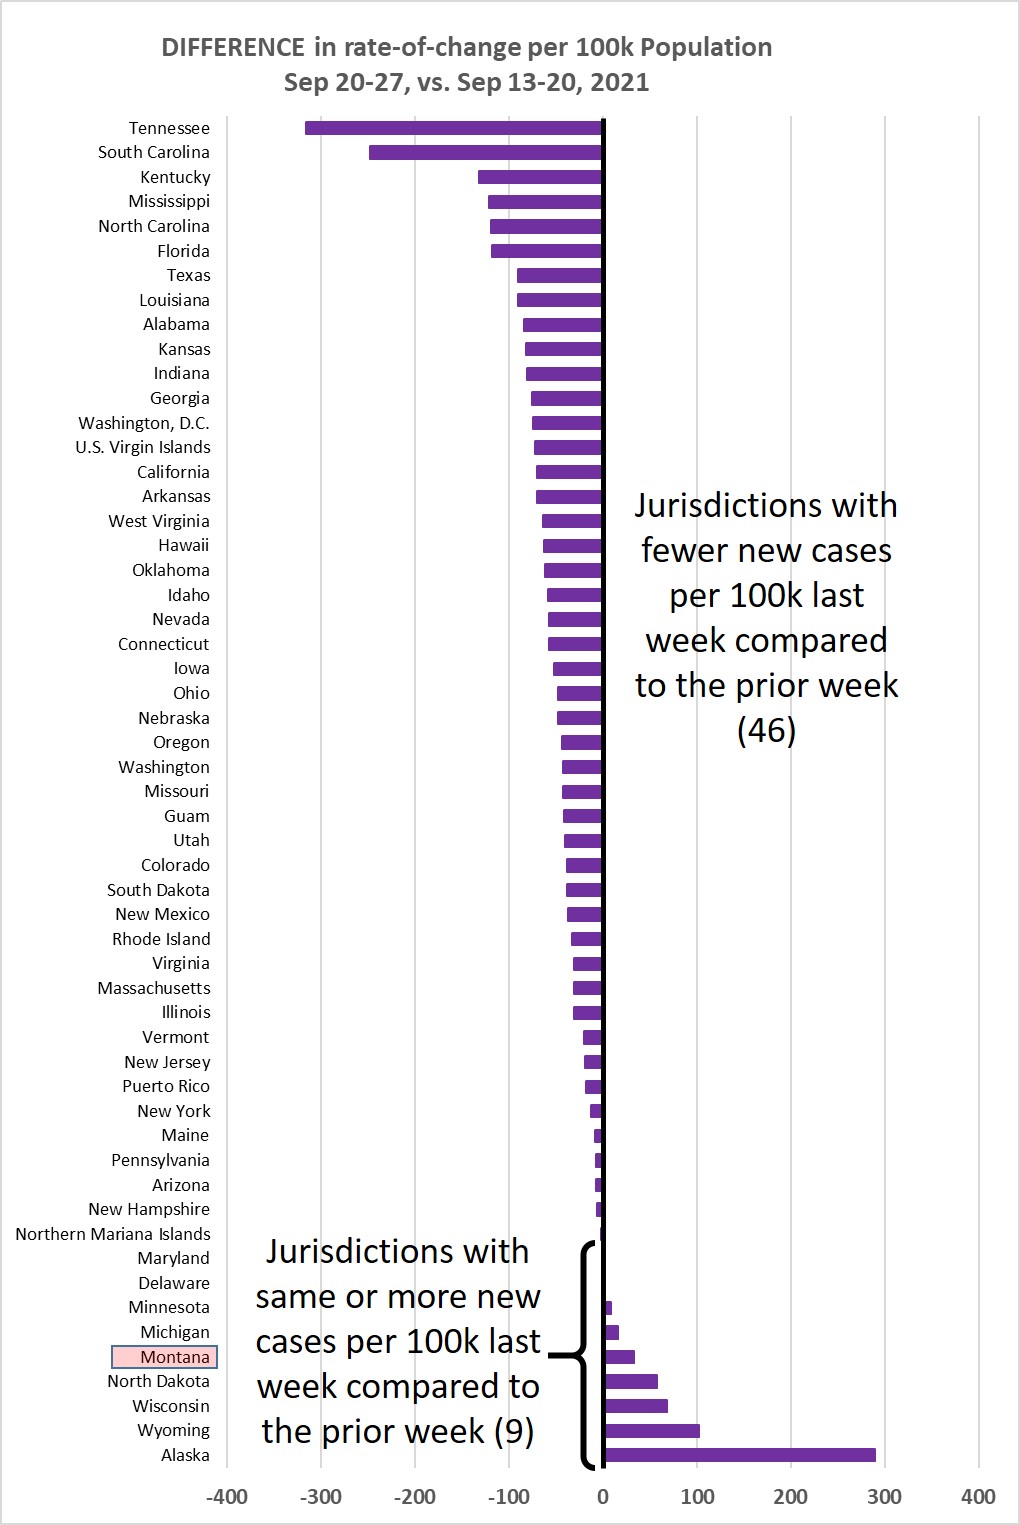
Chart 3 shows the difference in weekly new cases per 100k population for Sep 20-27,
vs. Sep 13-20, 2021. This past week 46/55 jurisdictions (84%) showed a lower rate
of new cases, so let's hope this indicates that the U.S. is back on a declining trend!
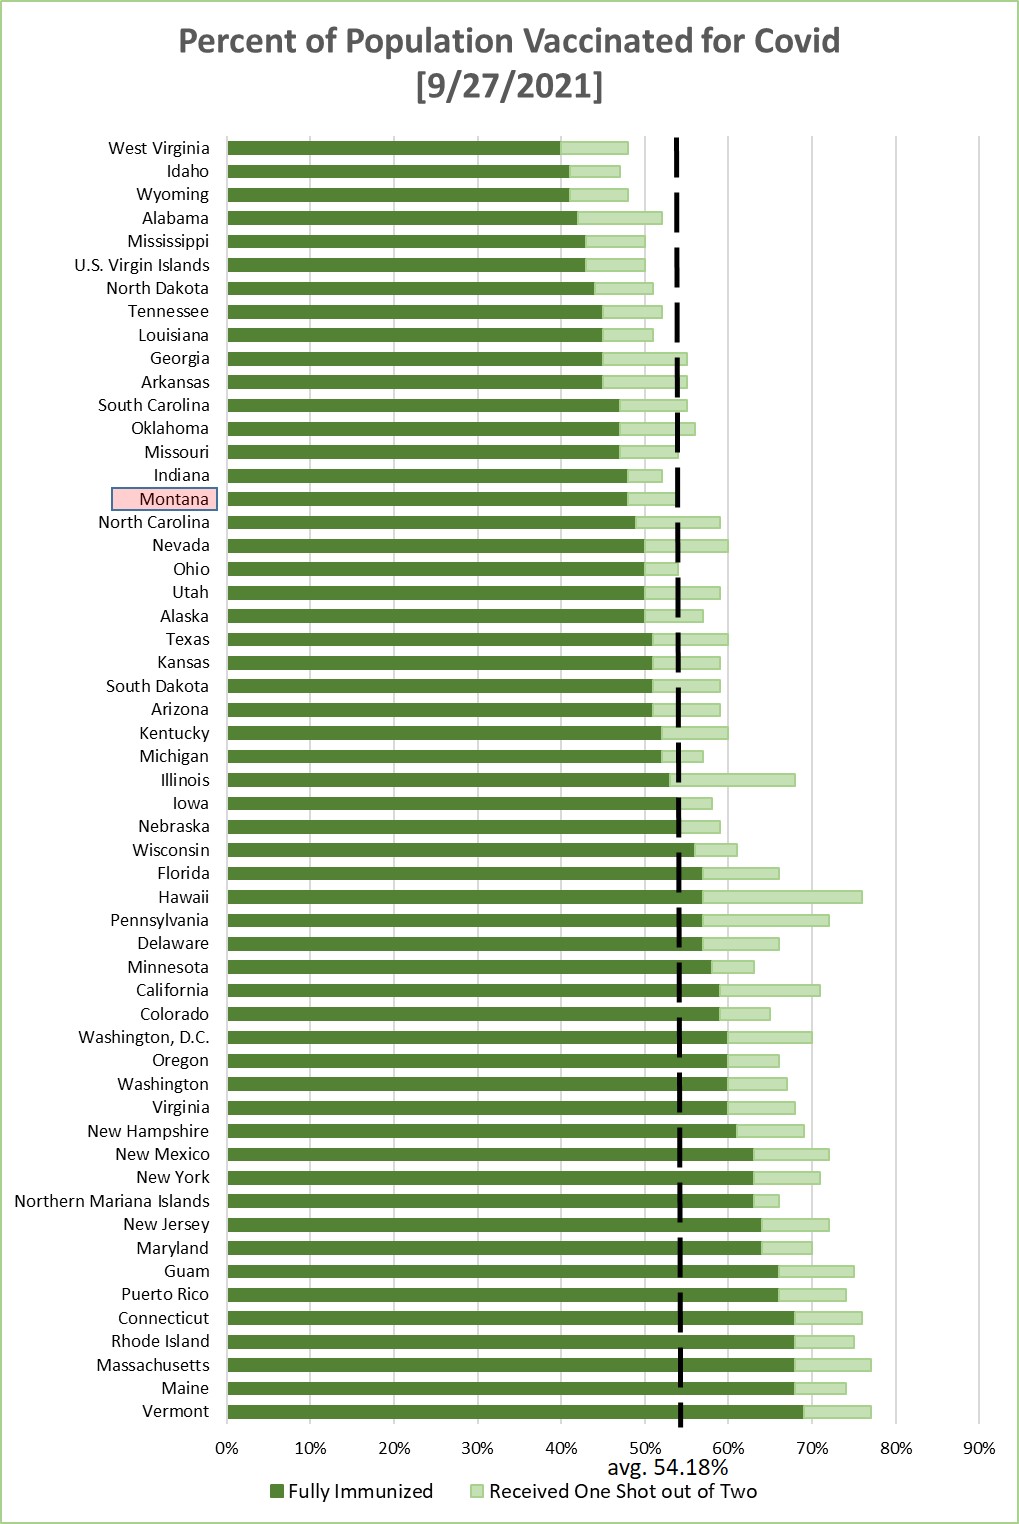
Chart 4 shows the percentage of the population in each jurisdiction having received
1 or 2 Covid-19 vaccination shots. This is sorted by the fraction that have received
2 shots--or one shot of the J&J vaccine. Average across the 55 jurisdictions is 54.18%
being fully immunized--a weekly increase of about 0.69% (weekly increase the prior
week was 0.76%).

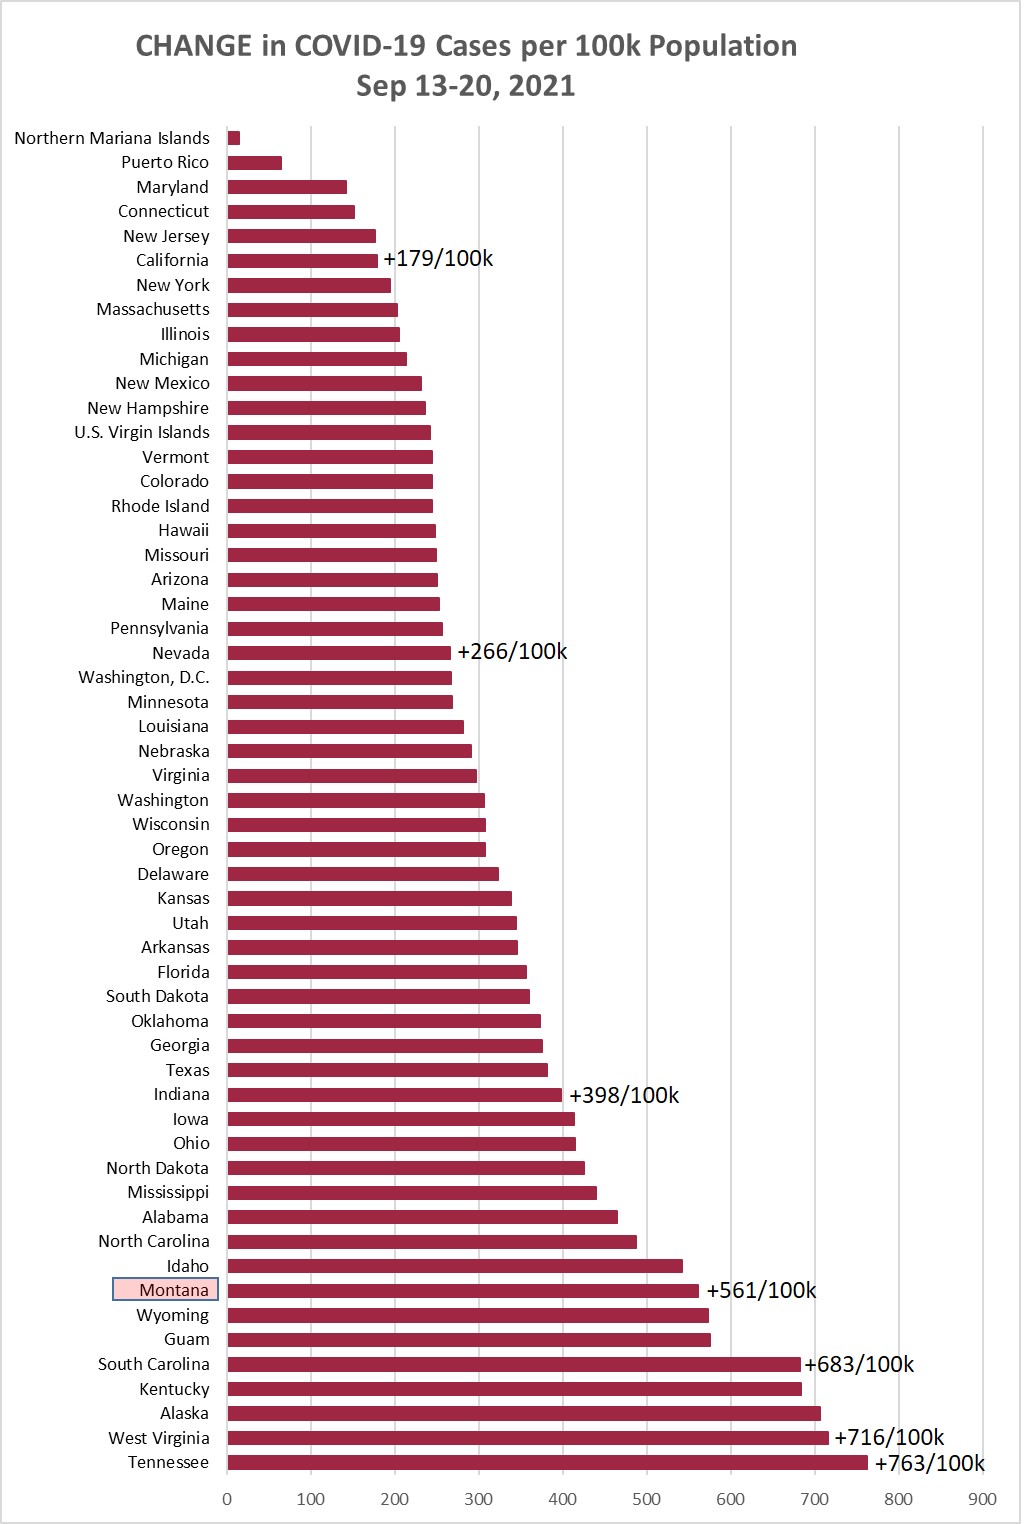
Monday, September 20, 2021
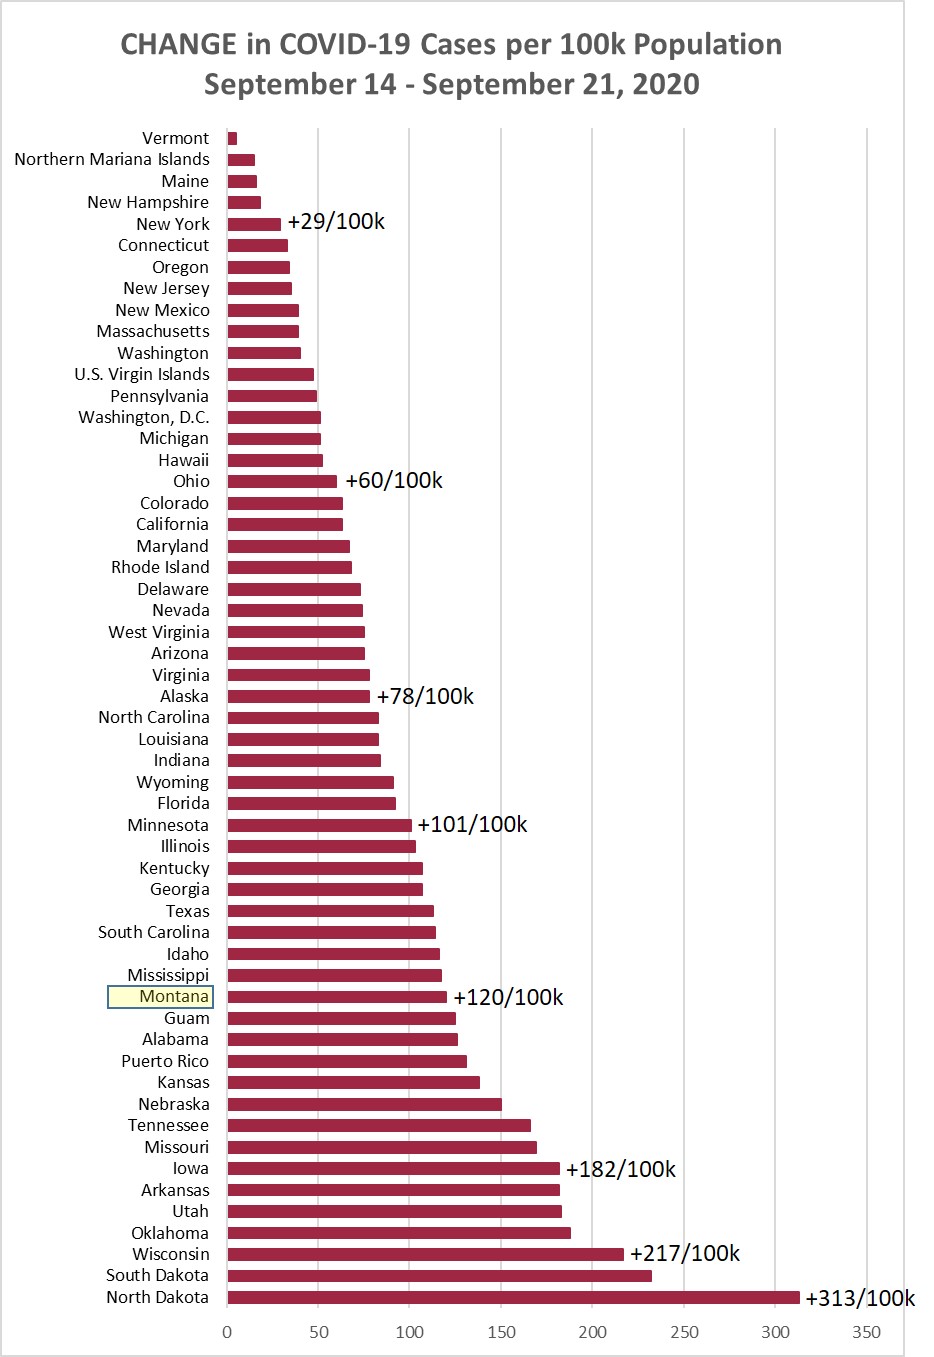
Chart 1 shows the change in cases per 100,000 population as of this morning (September
20, 2021) compared to the cases per 100,000 on September 13, 2021. Montana was up
+561/100k this week, compared to +396/100k the prior week, and +363/100k the week
before that. (A year ago this week Montana had +120/100k.)
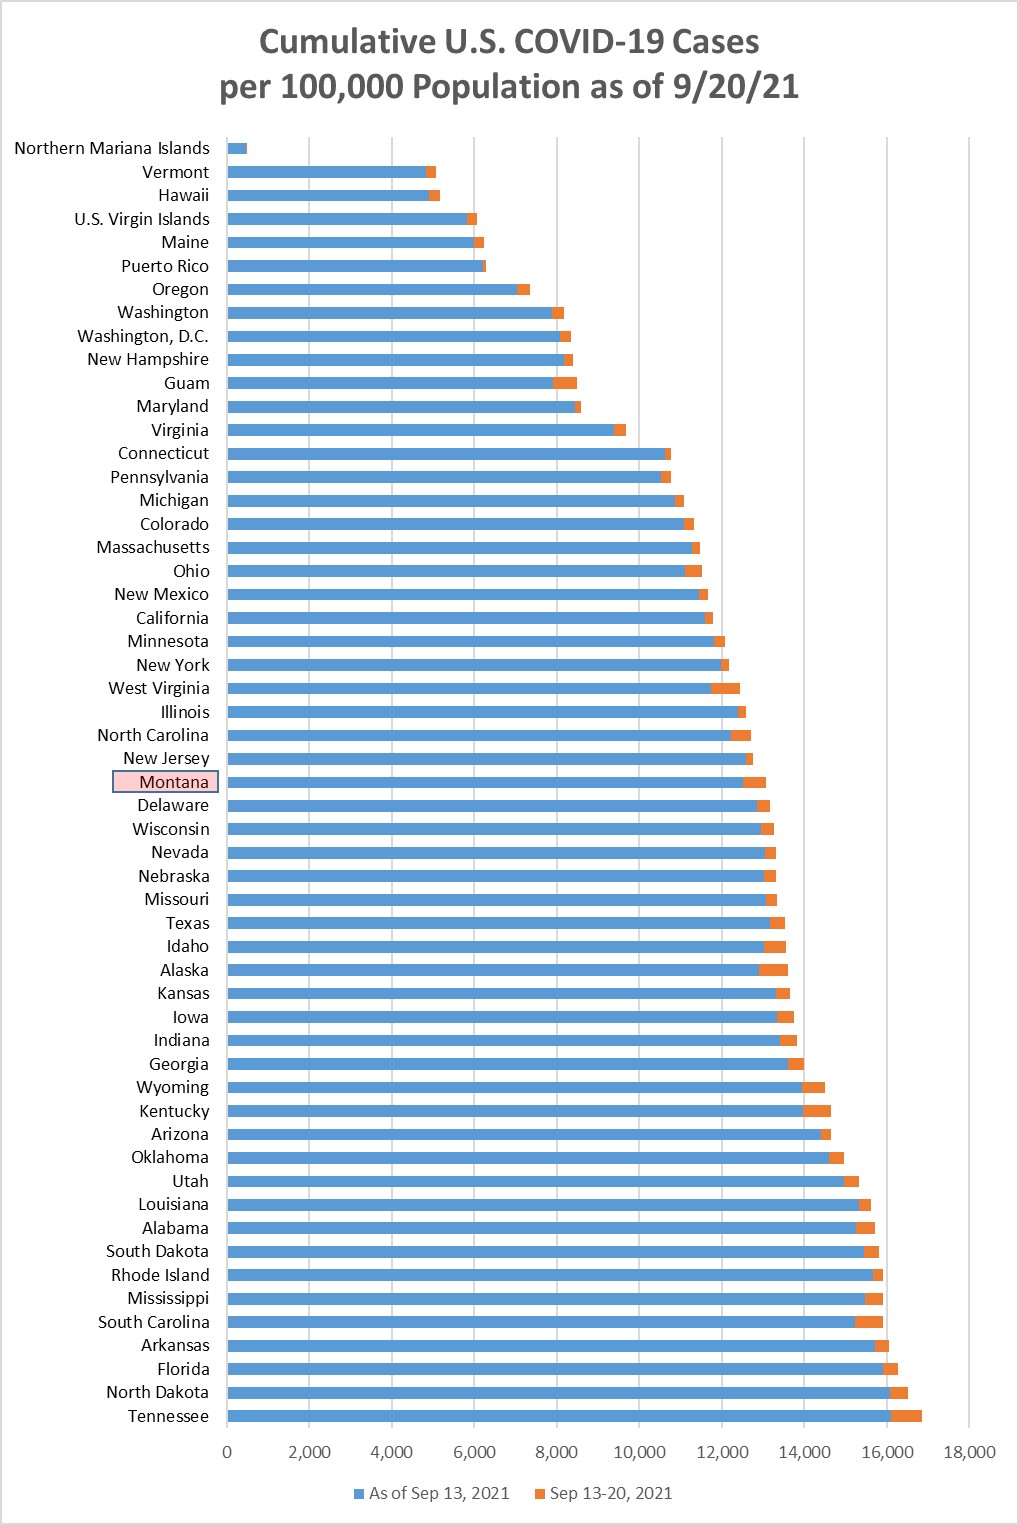
Chart 2 shows the same information as Chart 1, but with the overall cumulative cases
per 100k in each state to September 20. Tennessee remains in the top position, with
16.9% of its population having a positive Covid test at some point during the pandemic.
Montana has now had over 13% of the population with a positive Covid test at some
point during the pandemic.
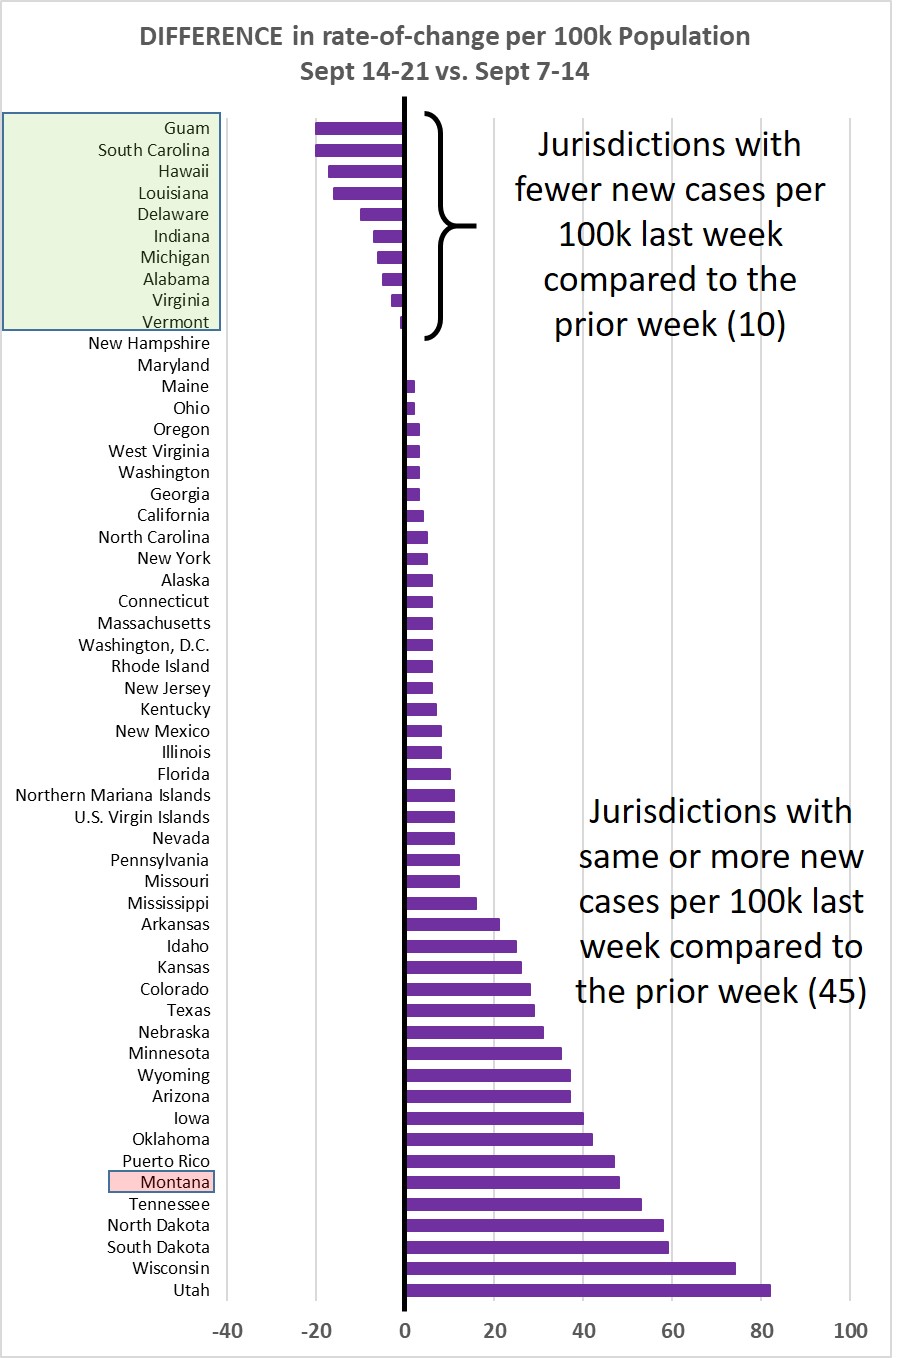
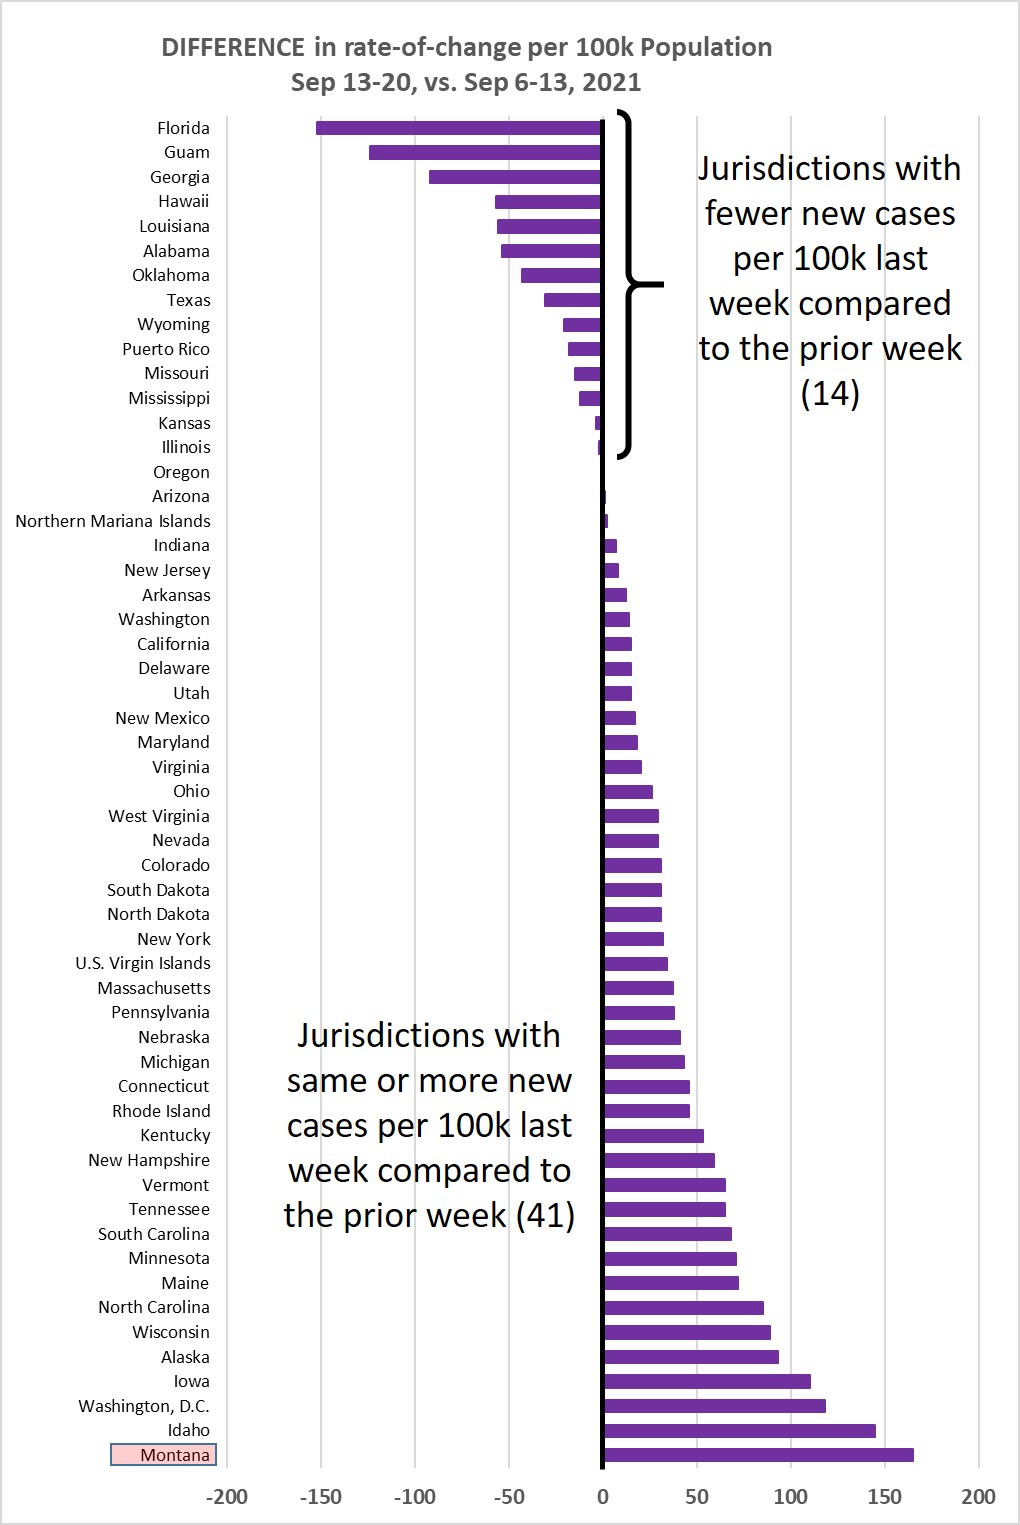
Chart 3 shows the difference in weekly new cases per 100k population for Sep 13-20,
vs. Sep 6-13, 2021. This past week 41/55 jurisdictions (75%) showed the same or higher
rate of new cases, so last week's slowing might have been due to Labor Day affecting
the reporting.
Chart 4 shows the percentage of the population in each jurisdiction having received
1 or 2 Covid-19 vaccination shots. This is sorted by the fraction that have received
2 shots--or one shot of the J&J vaccine. Average across the 55 jurisdictions is 53.5%
being fully immunized--a weekly increase of about 0.76% (weekly increase the prior
week was 0.71%).

Monday, September 13, 2021
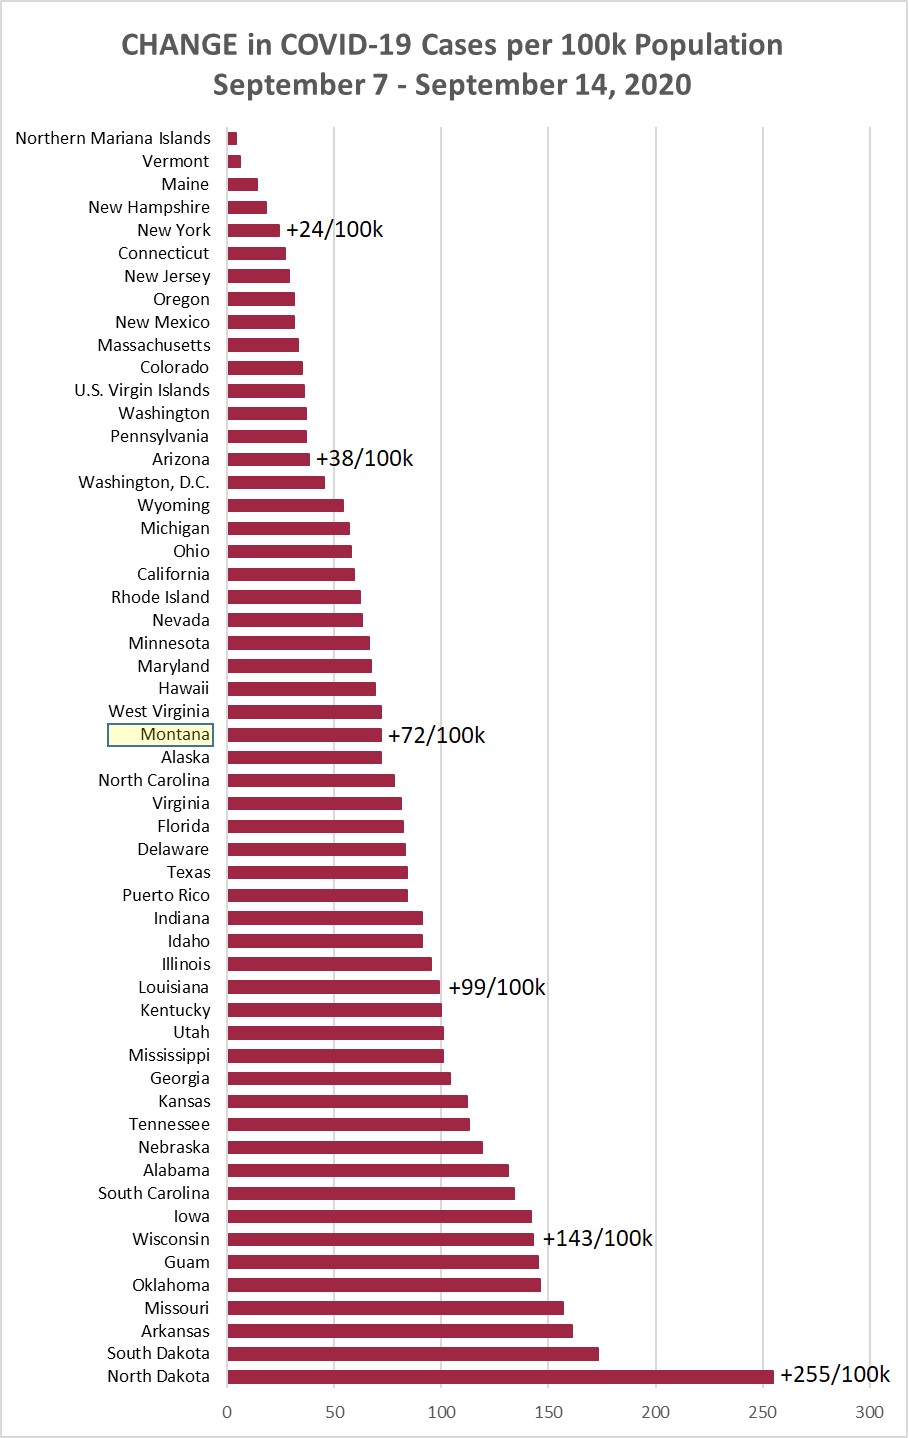
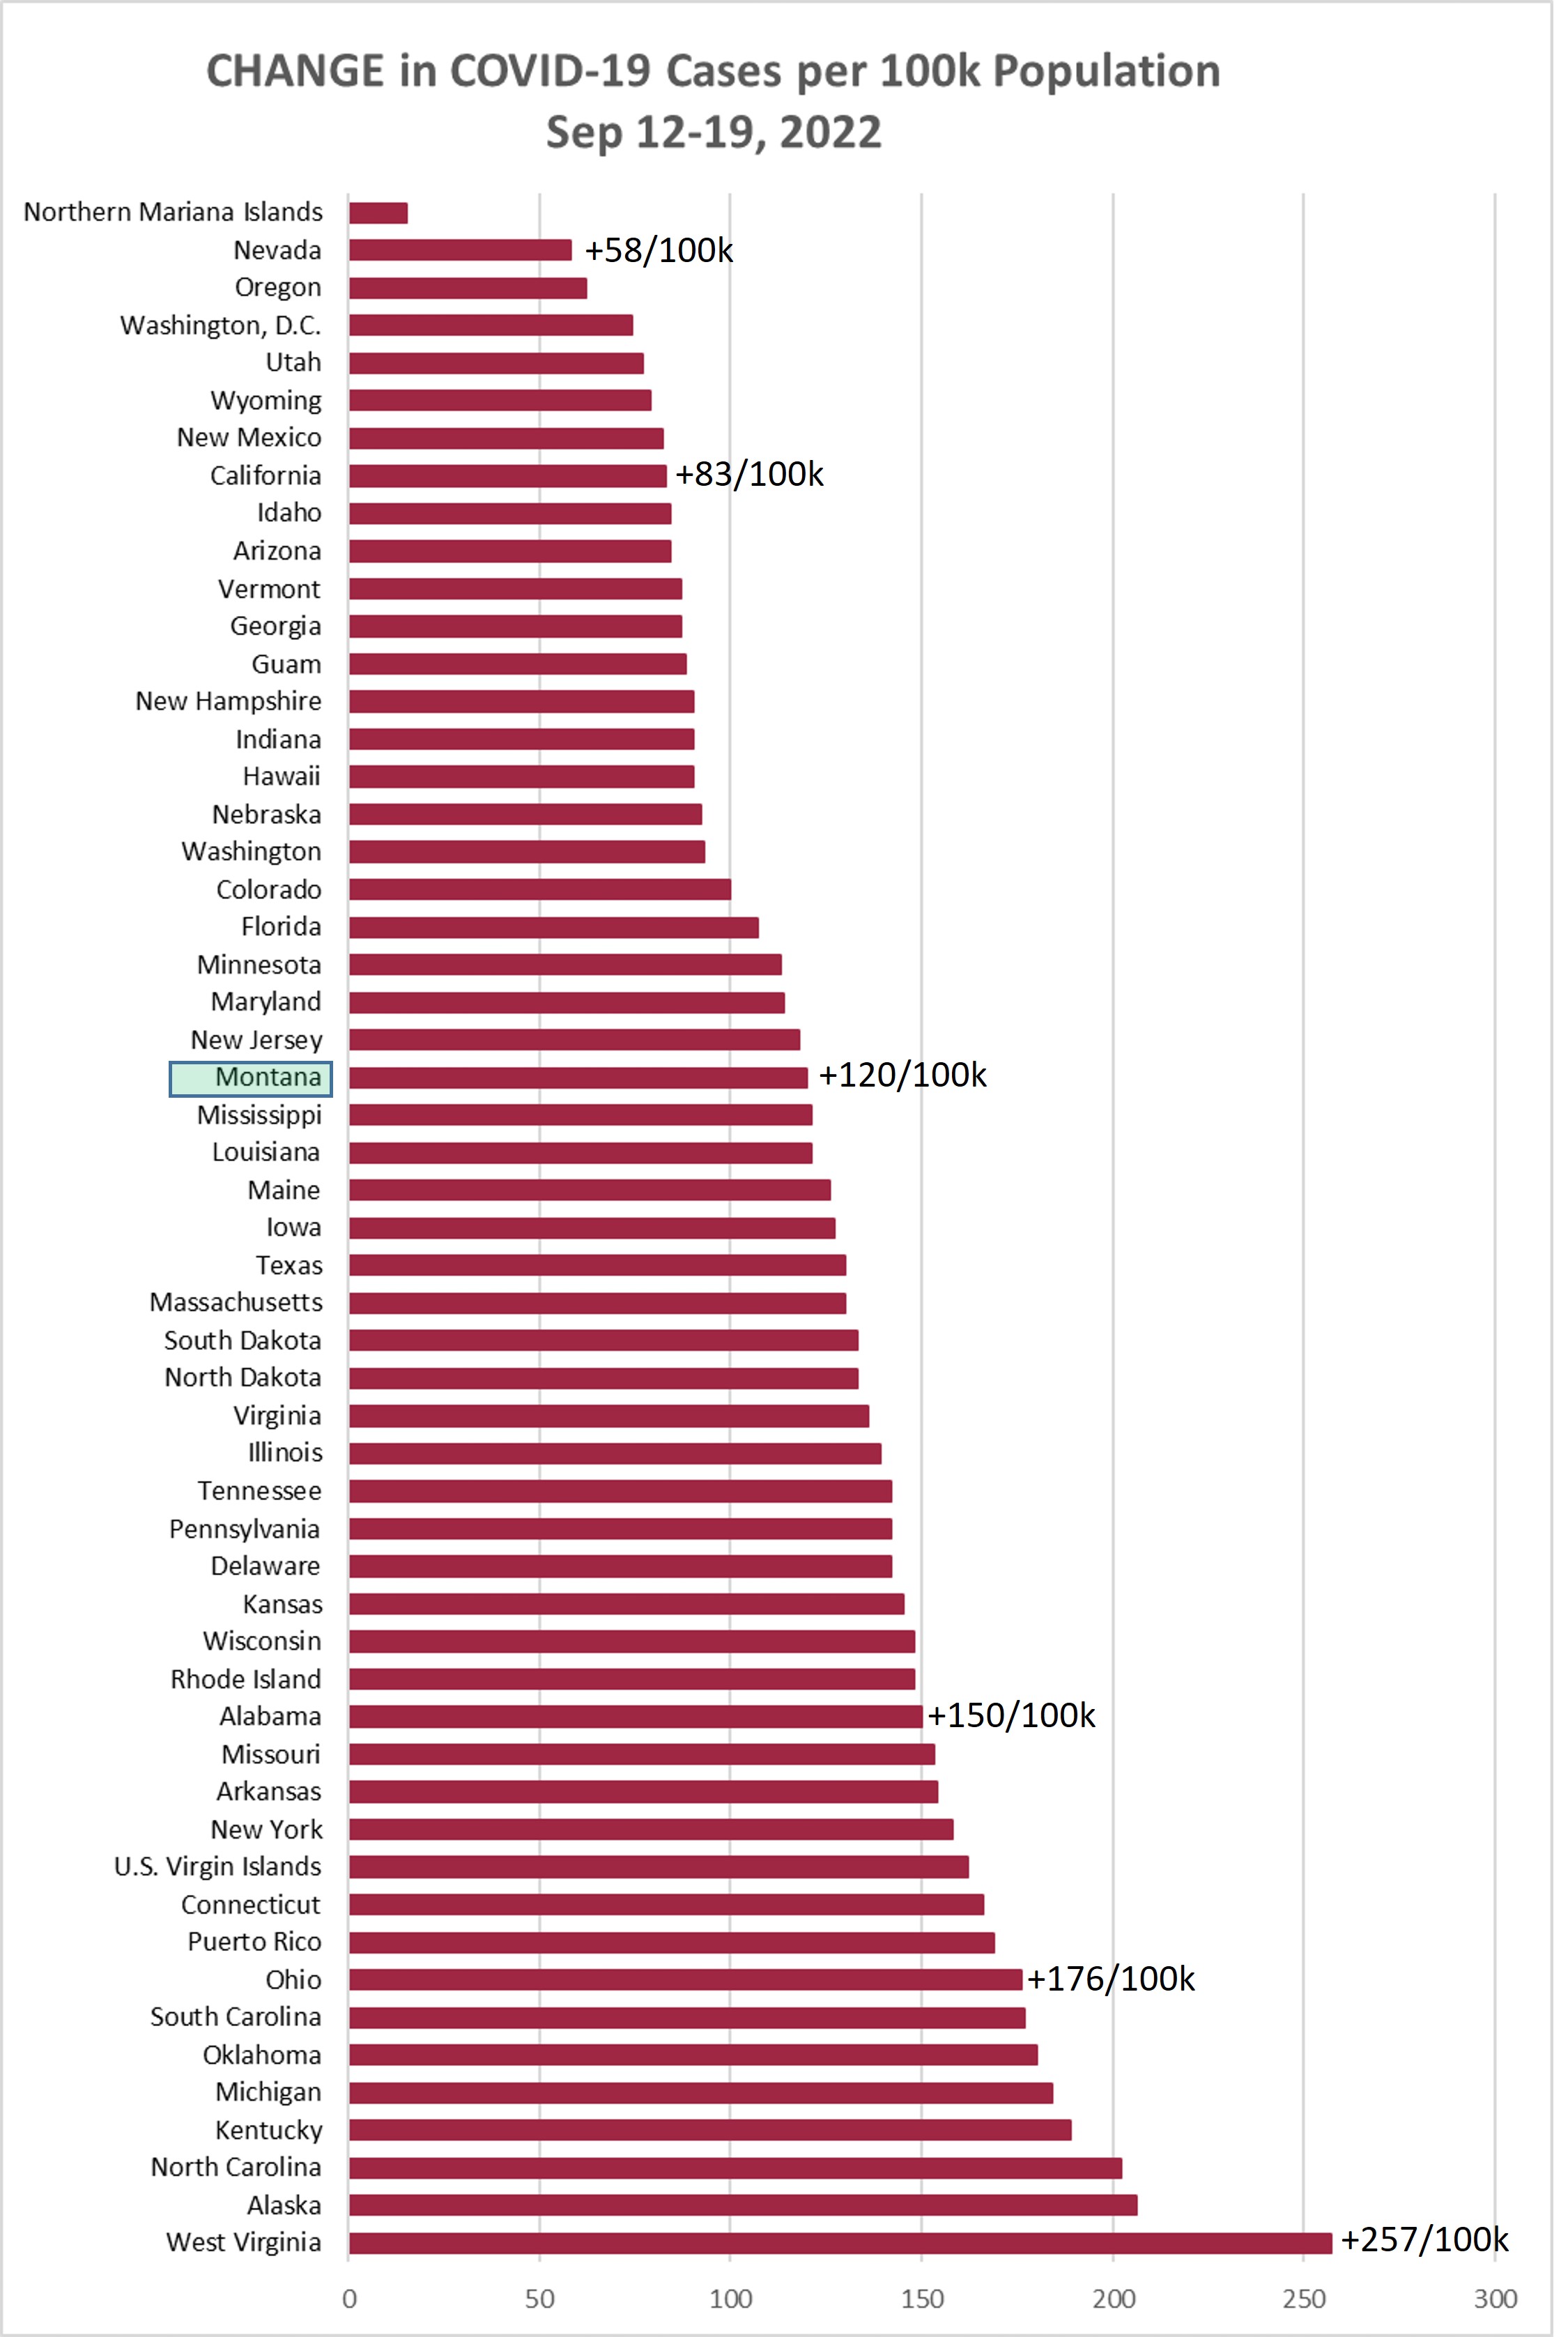
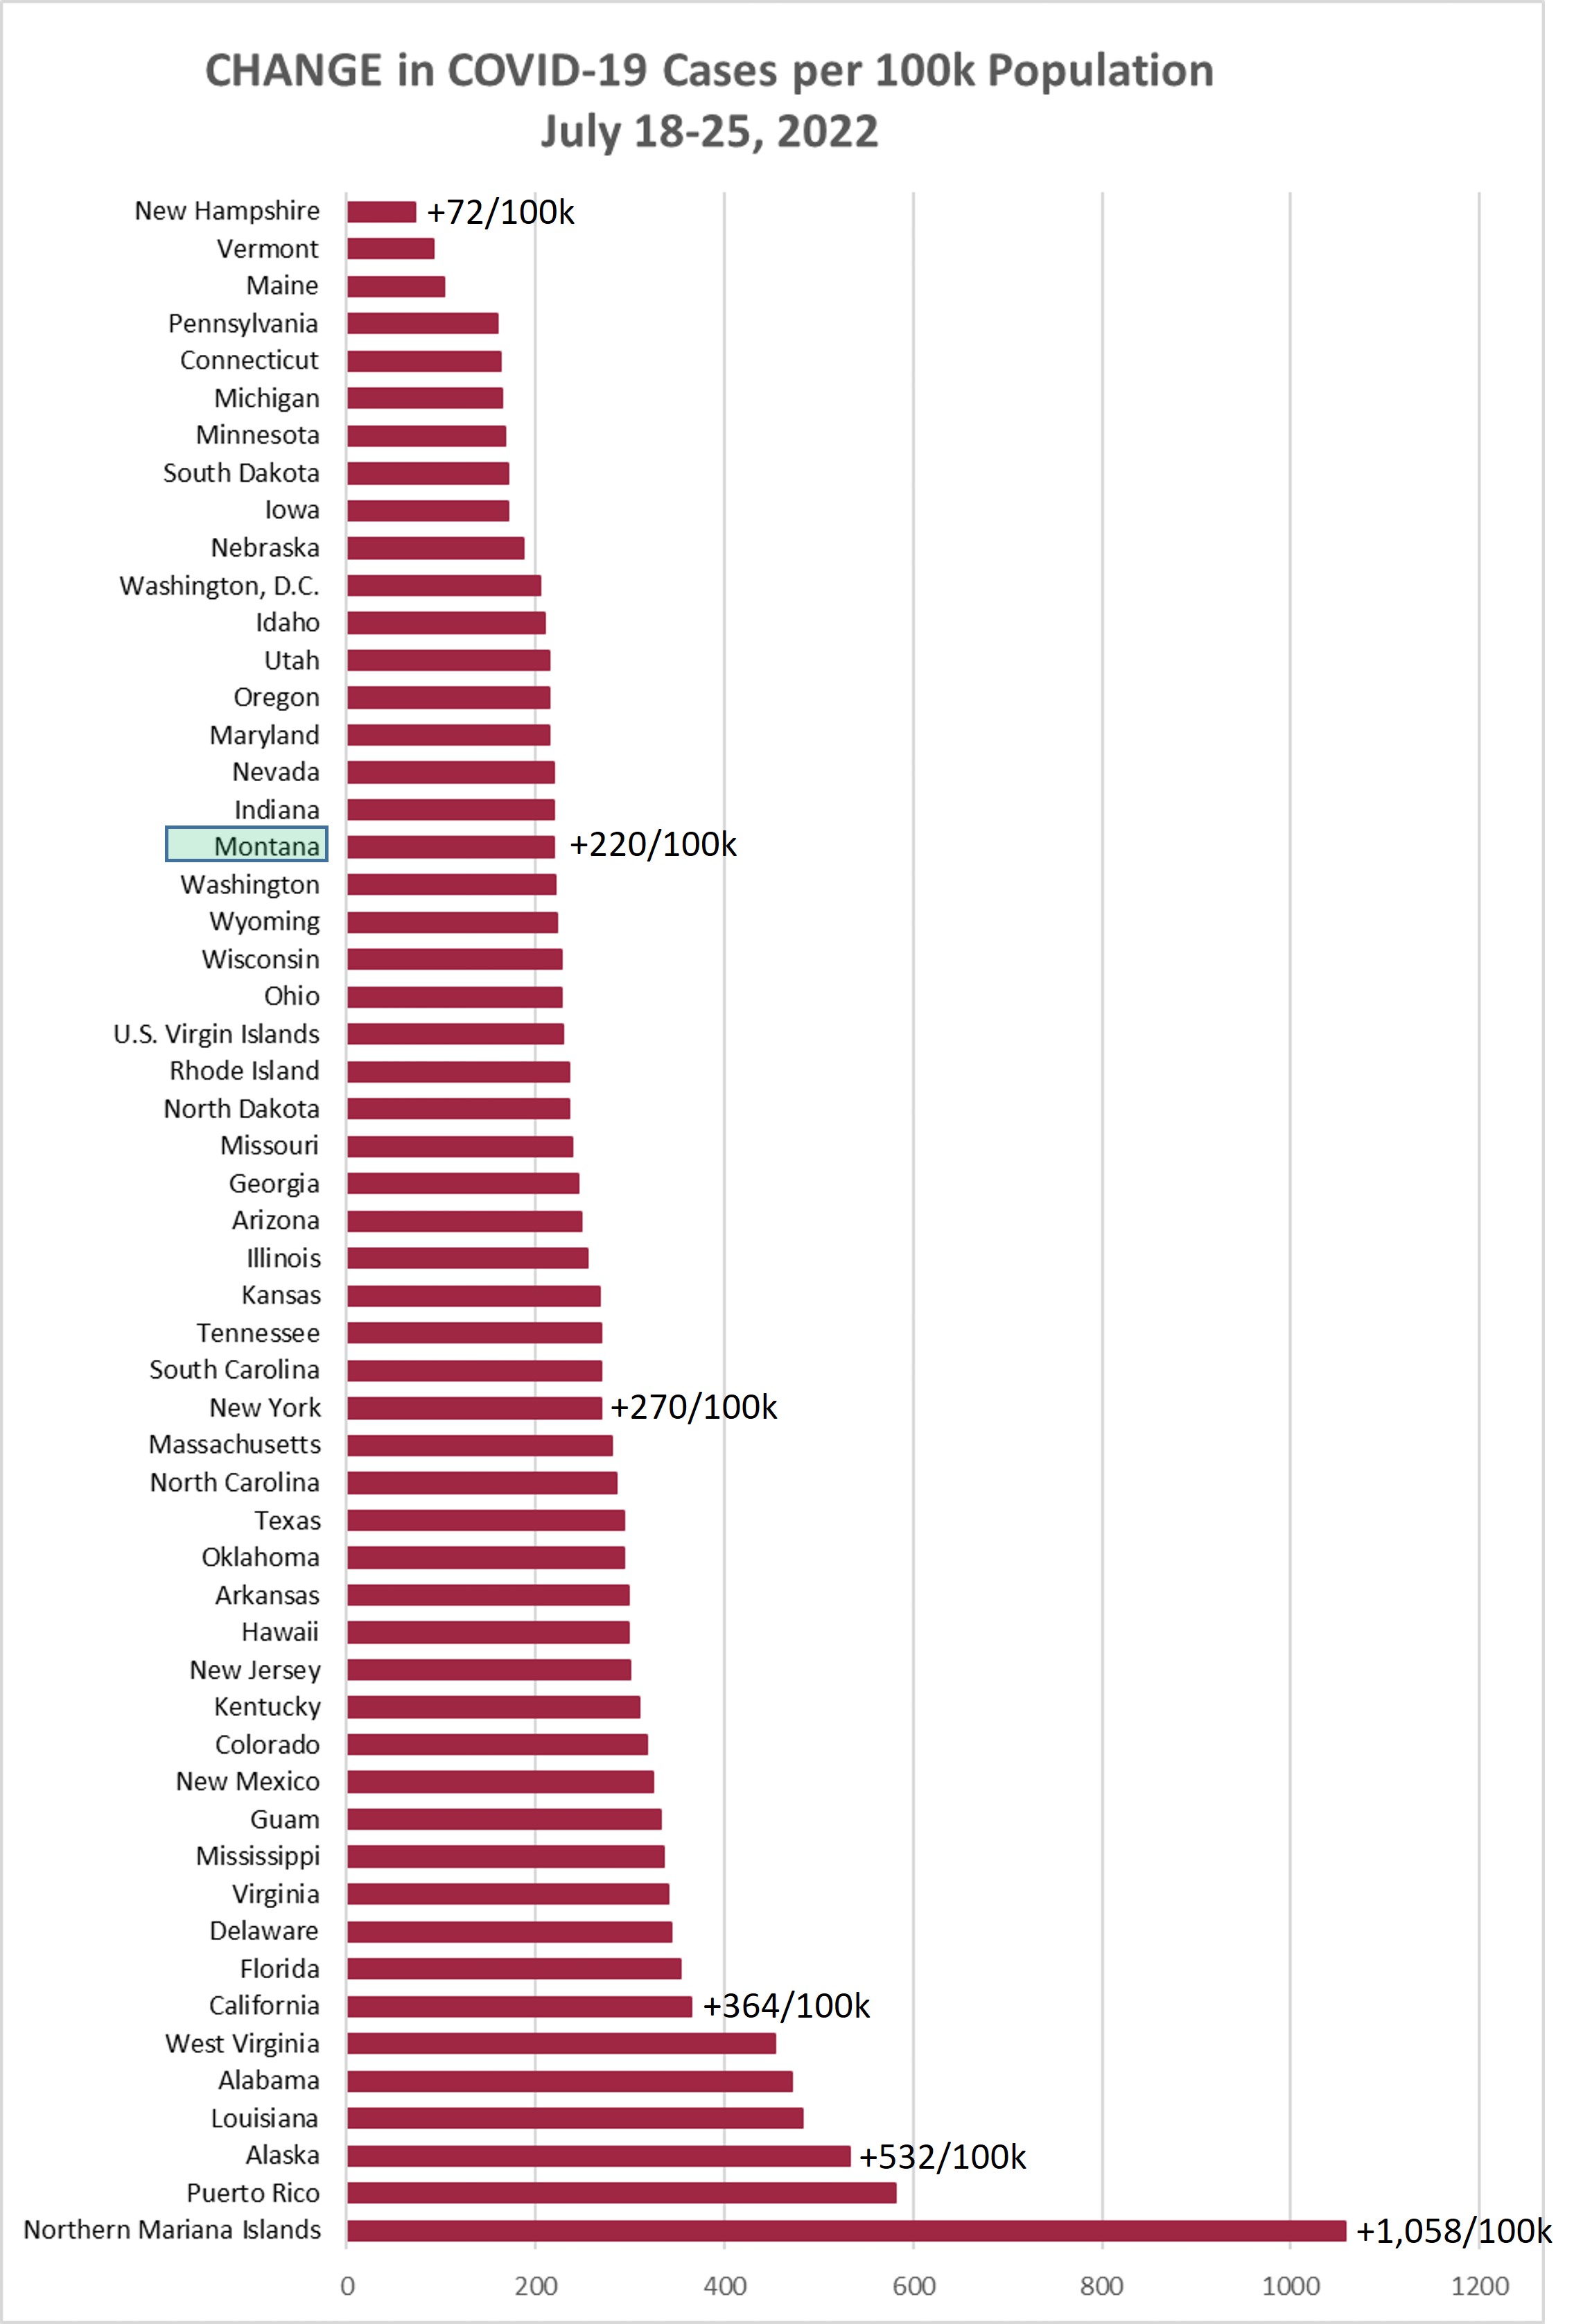
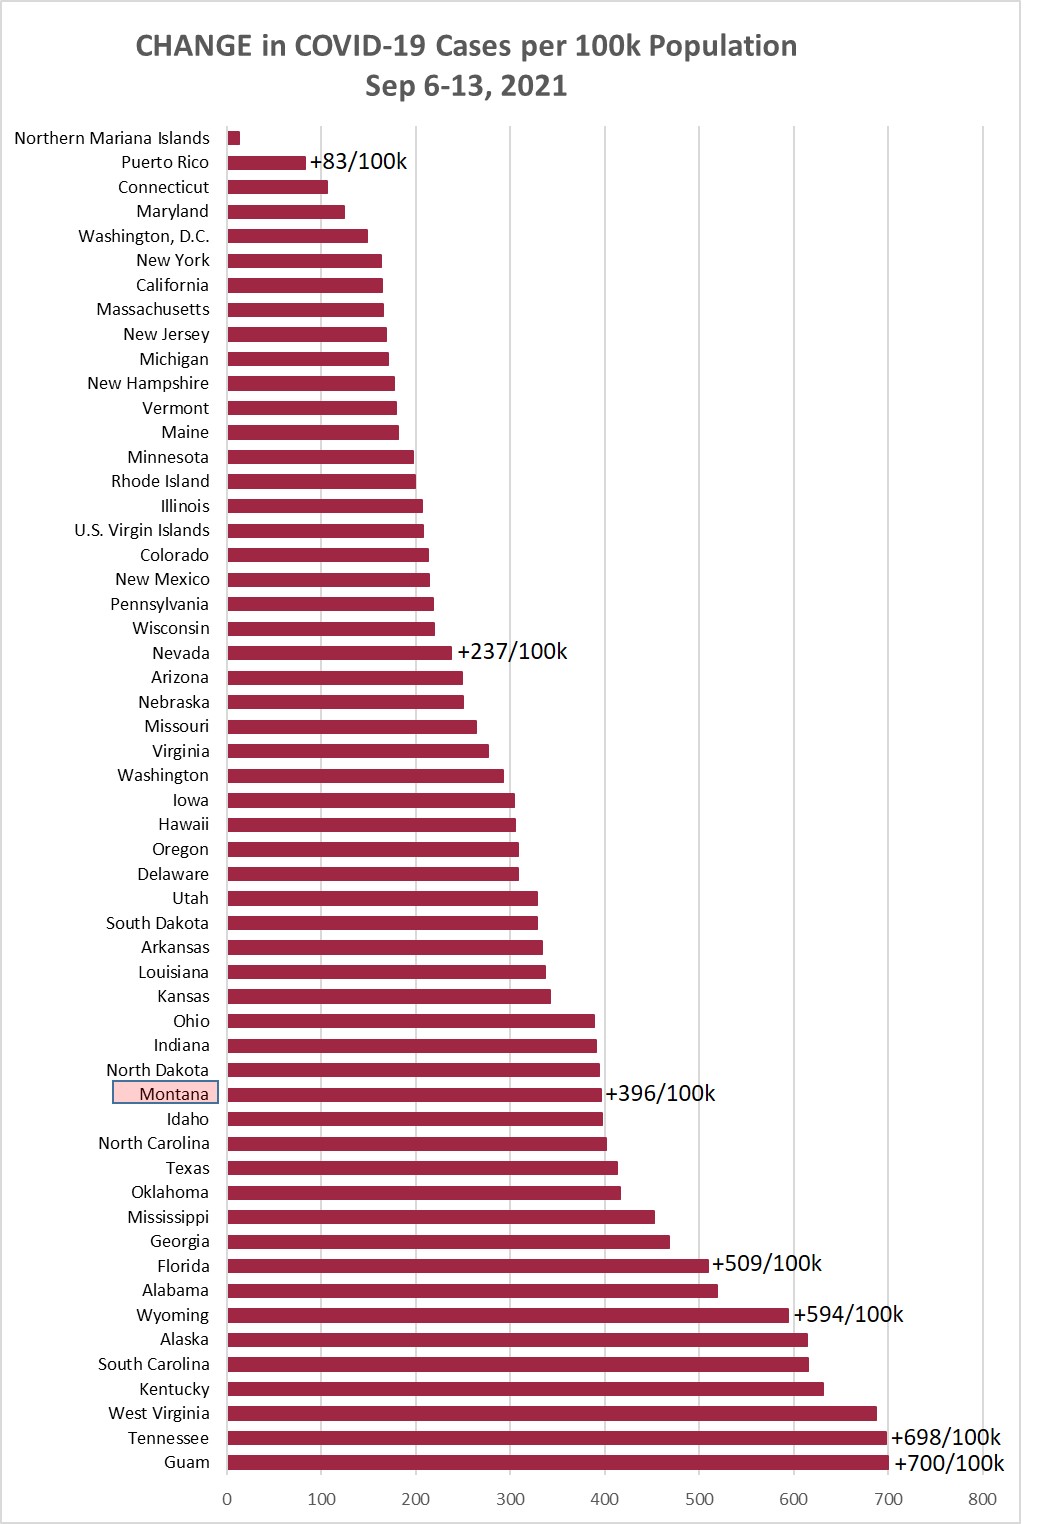
Chart 1 shows the change in cases per 100,000 population as of this morning (September
13, 2021) compared to the cases per 100,000 on September 6, 2021. Montana was up +396/100k
this week, compared to +363/100k the prior week, and +309/100k the week before that.
(A year ago this week Montana had +72/100k.)
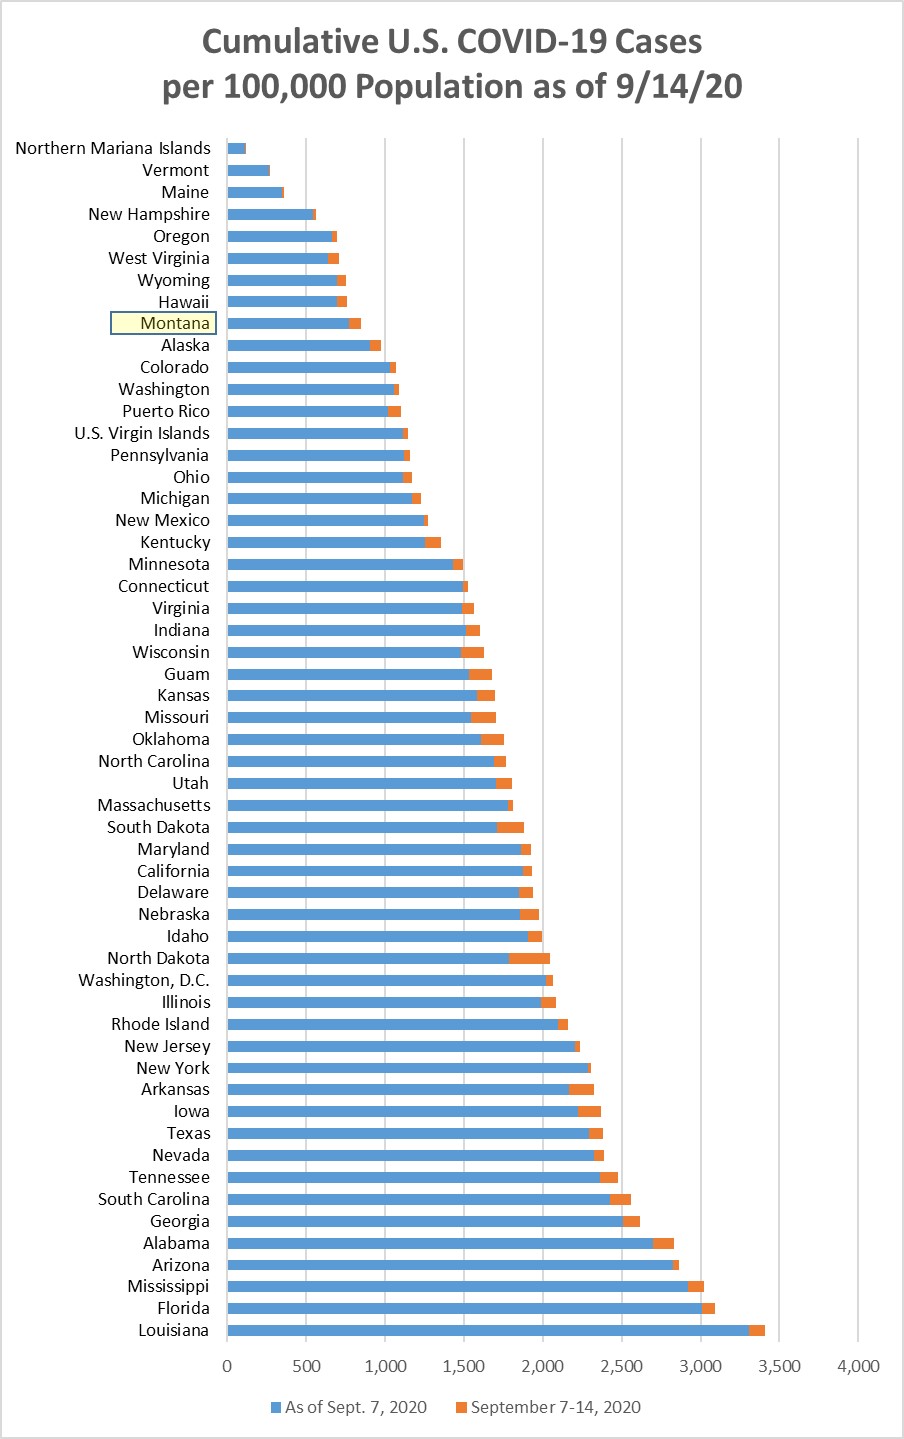
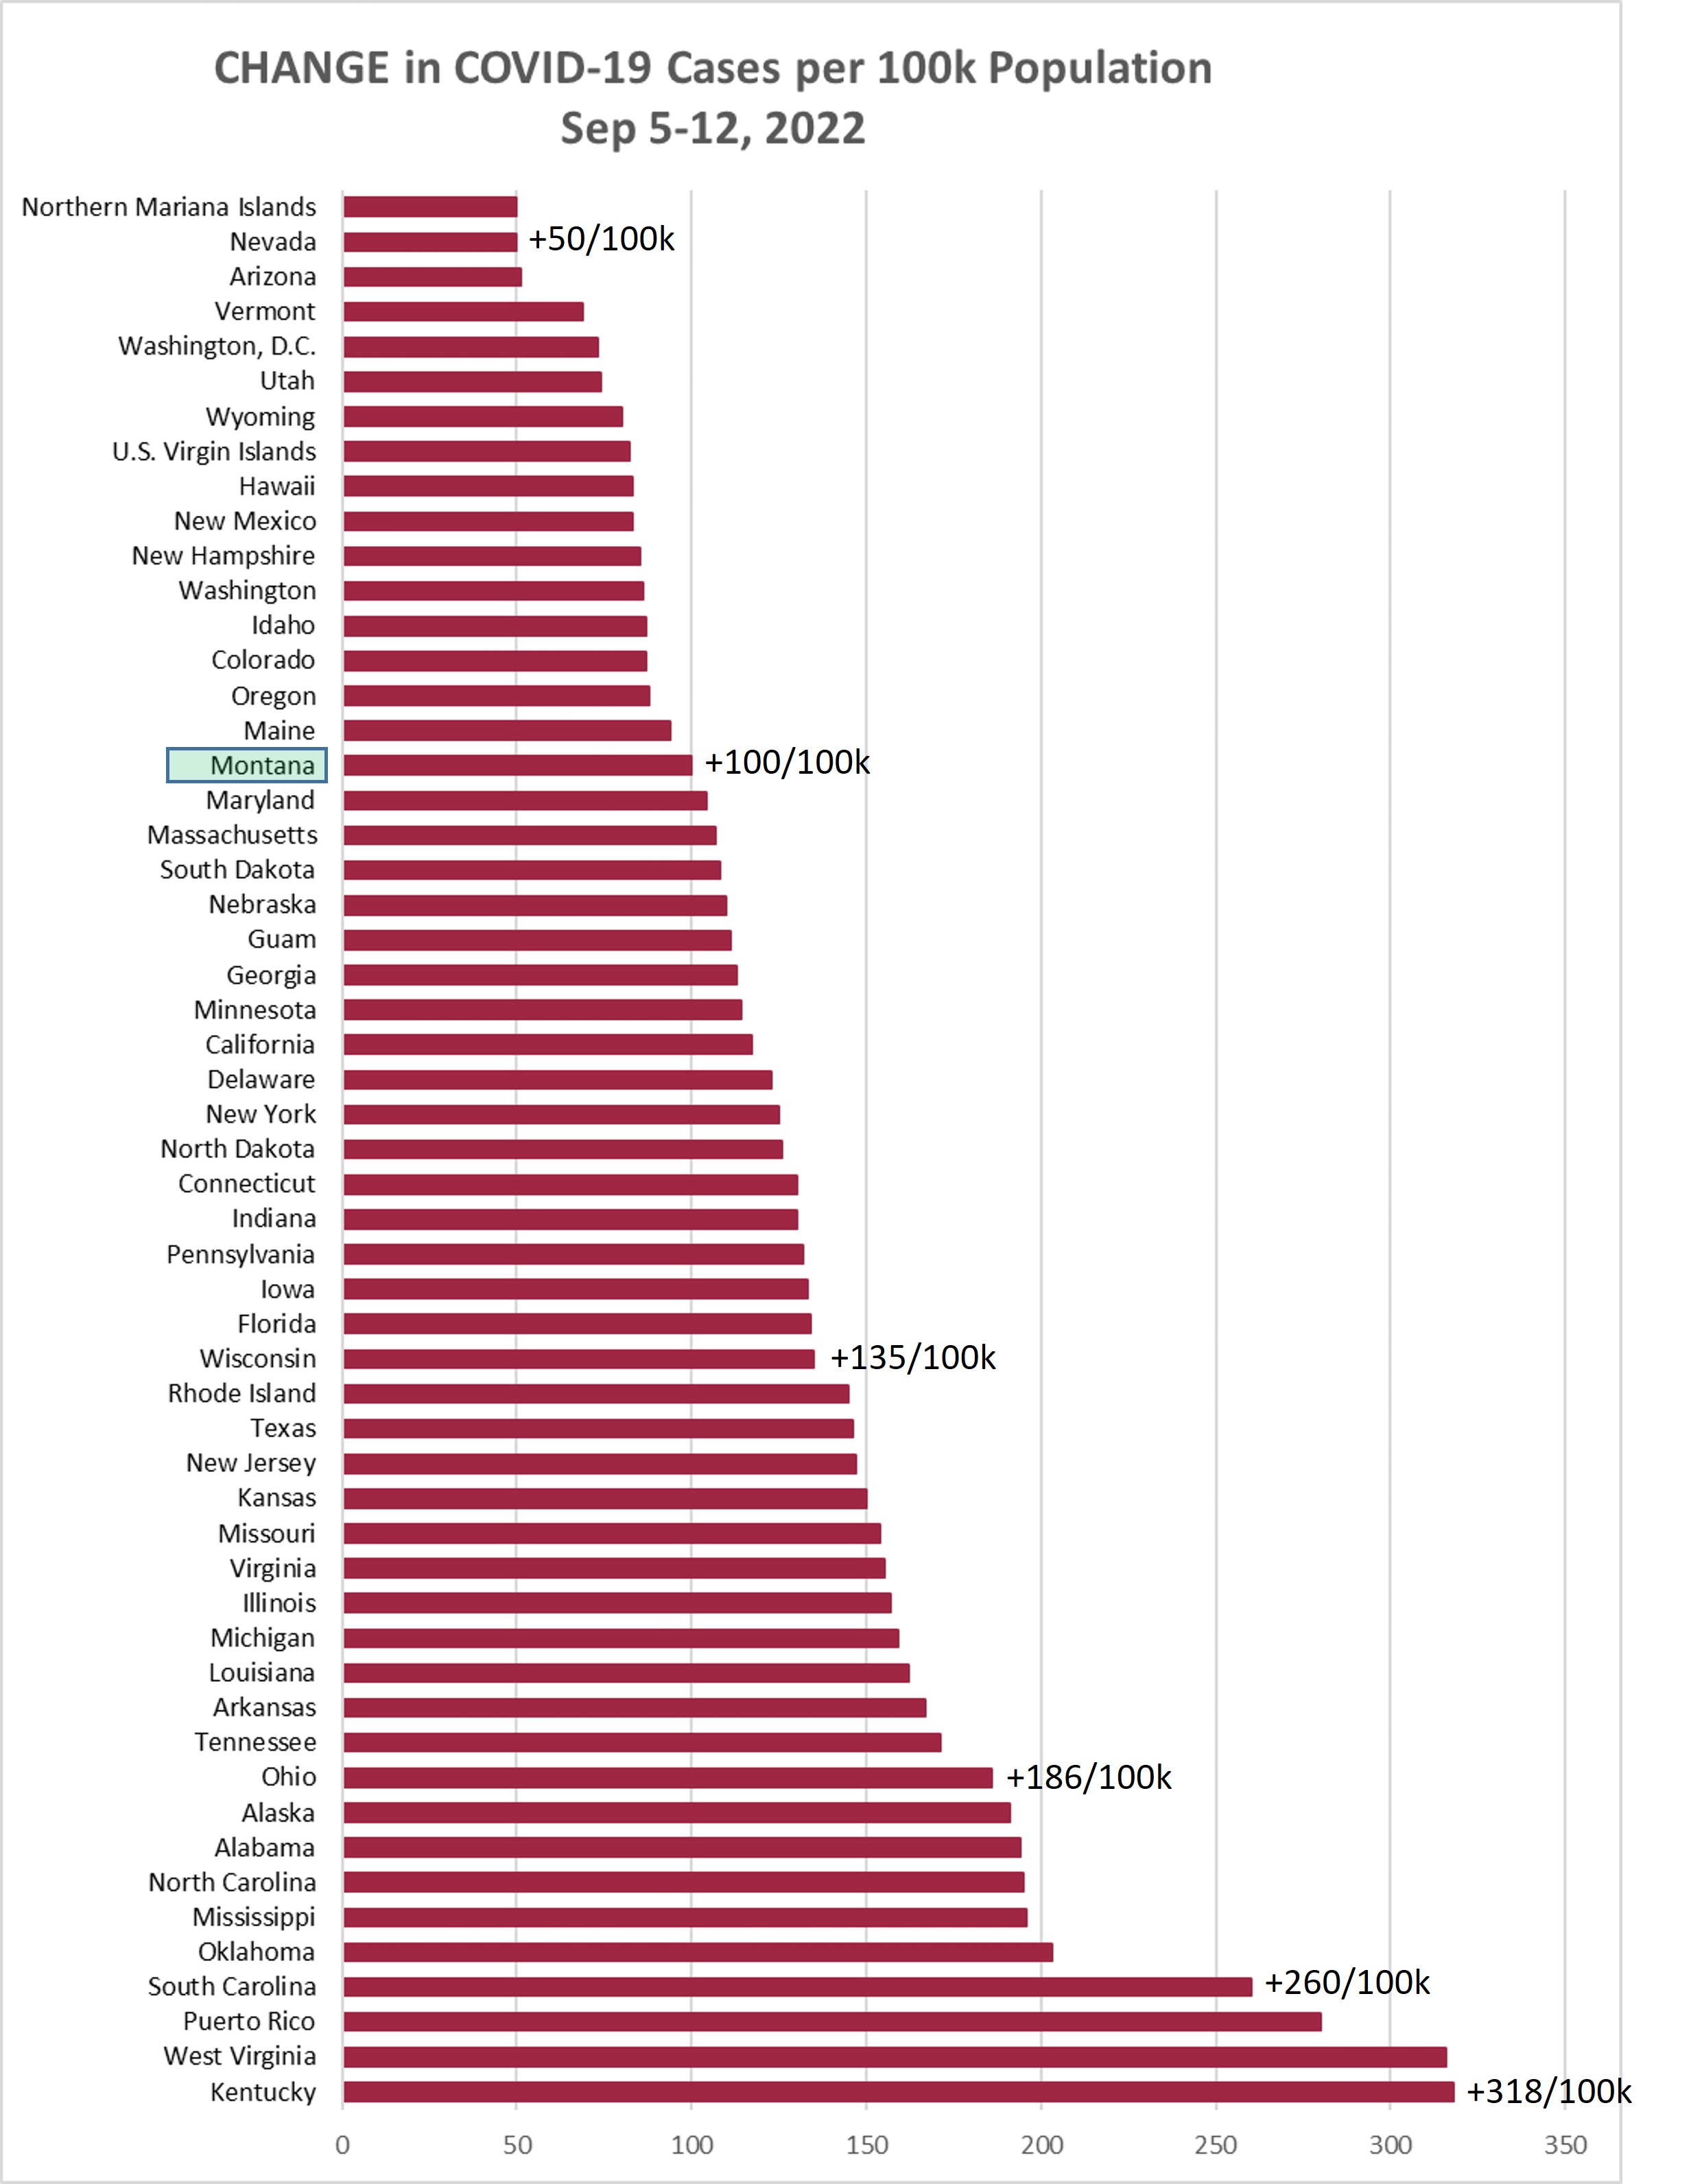
Chart 2 shows the same information as Chart 1, but with the overall cumulative cases
per 100k in each state to September 13. Tennessee jumped into the top position, with
16.1% of its population having a positive Covid test at some point during the pandemic.
MT is 27/55 (29th highest), passing Illinois this week. Montana has had 12.5% of the
population with a positive Covid test at some point during the pandemic.
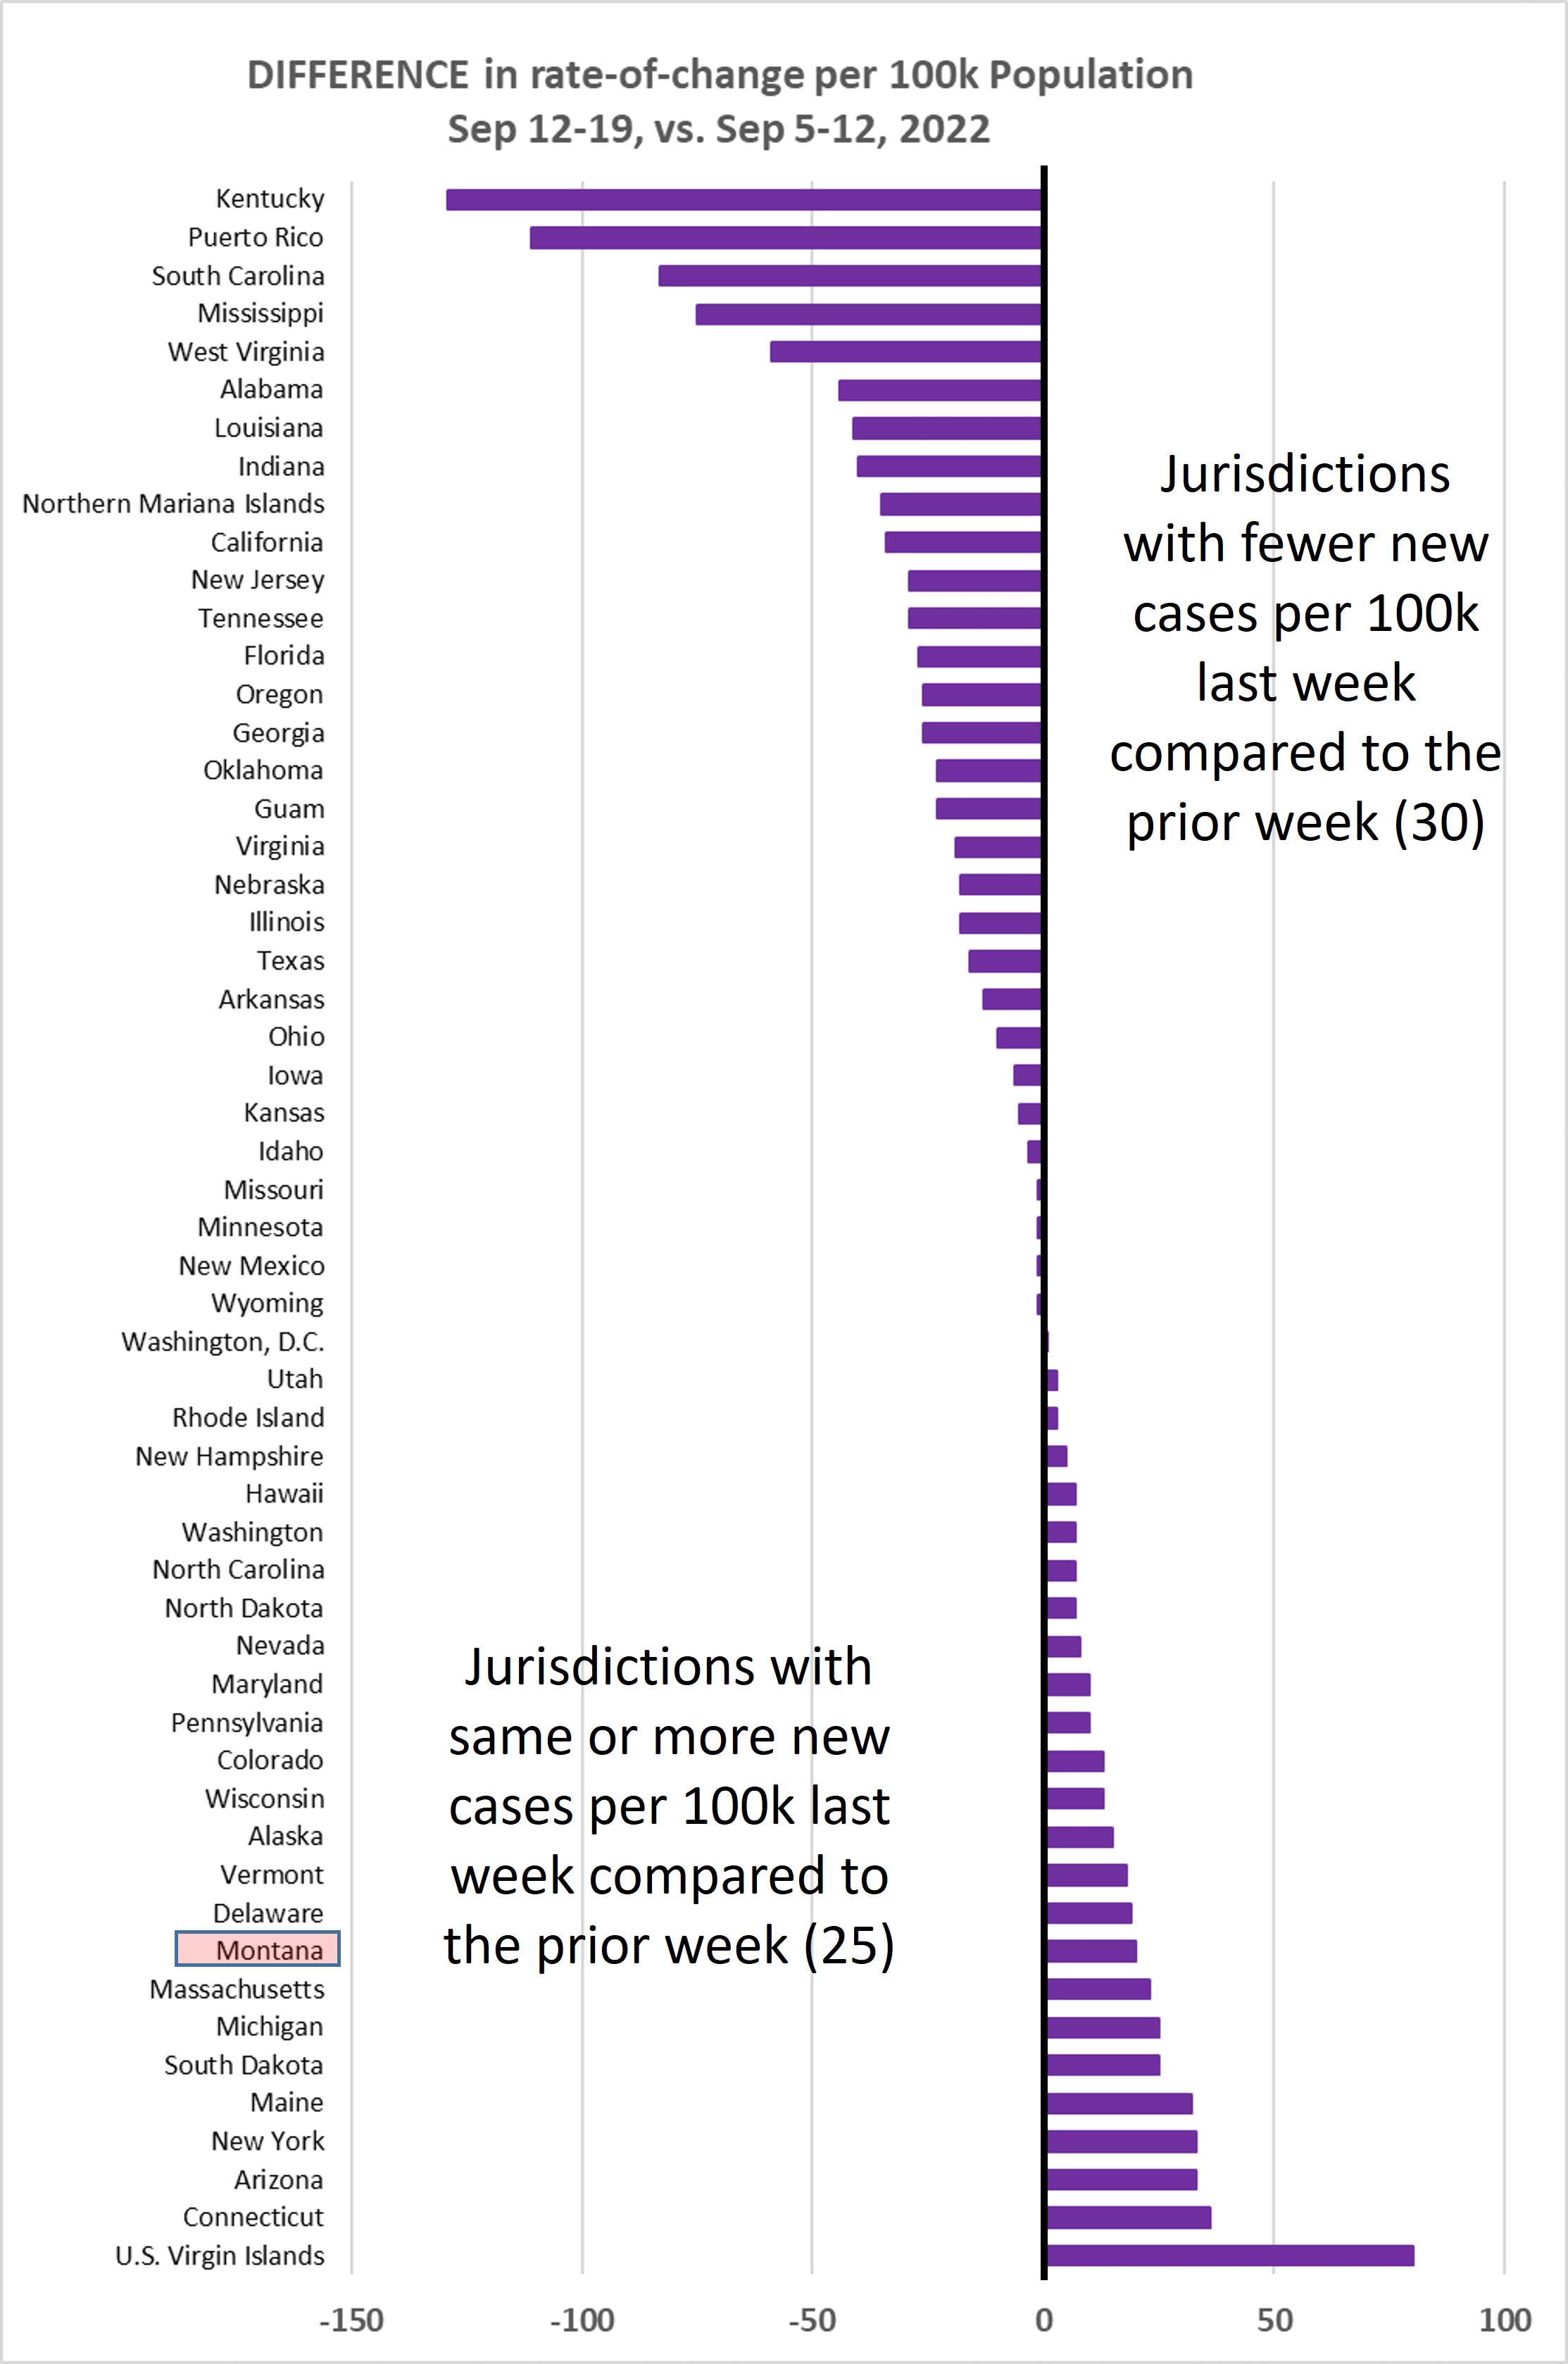
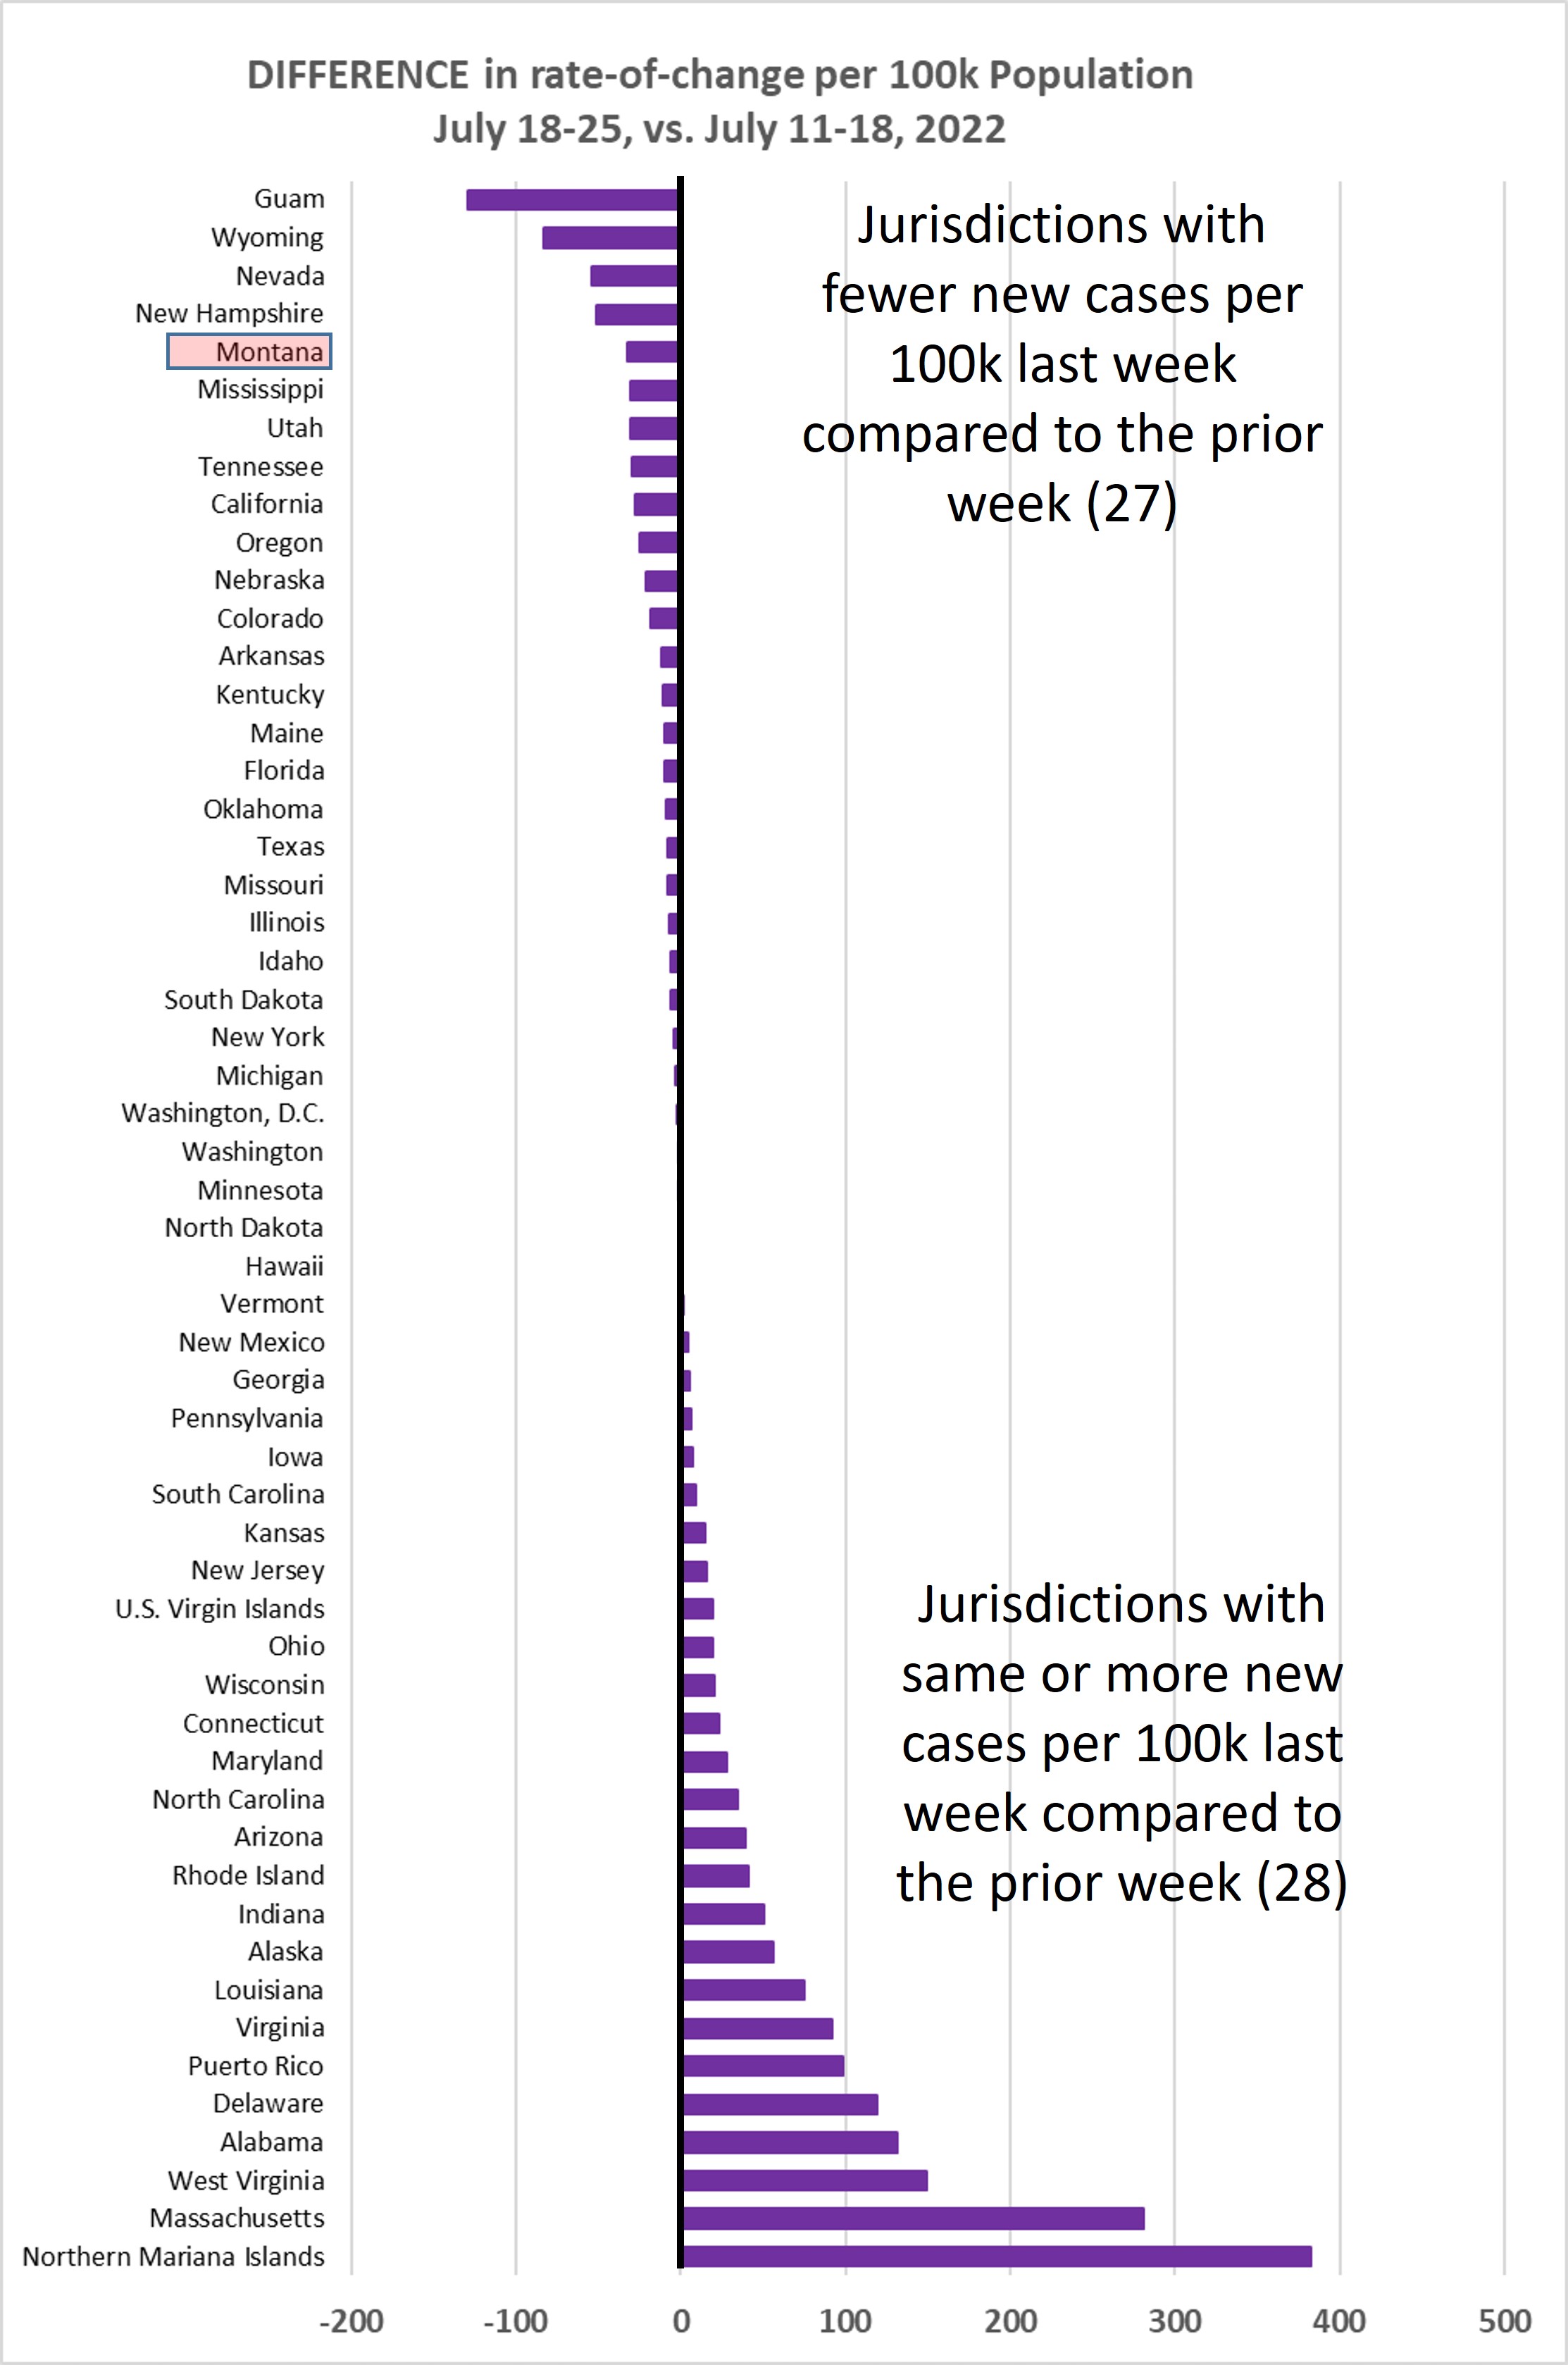
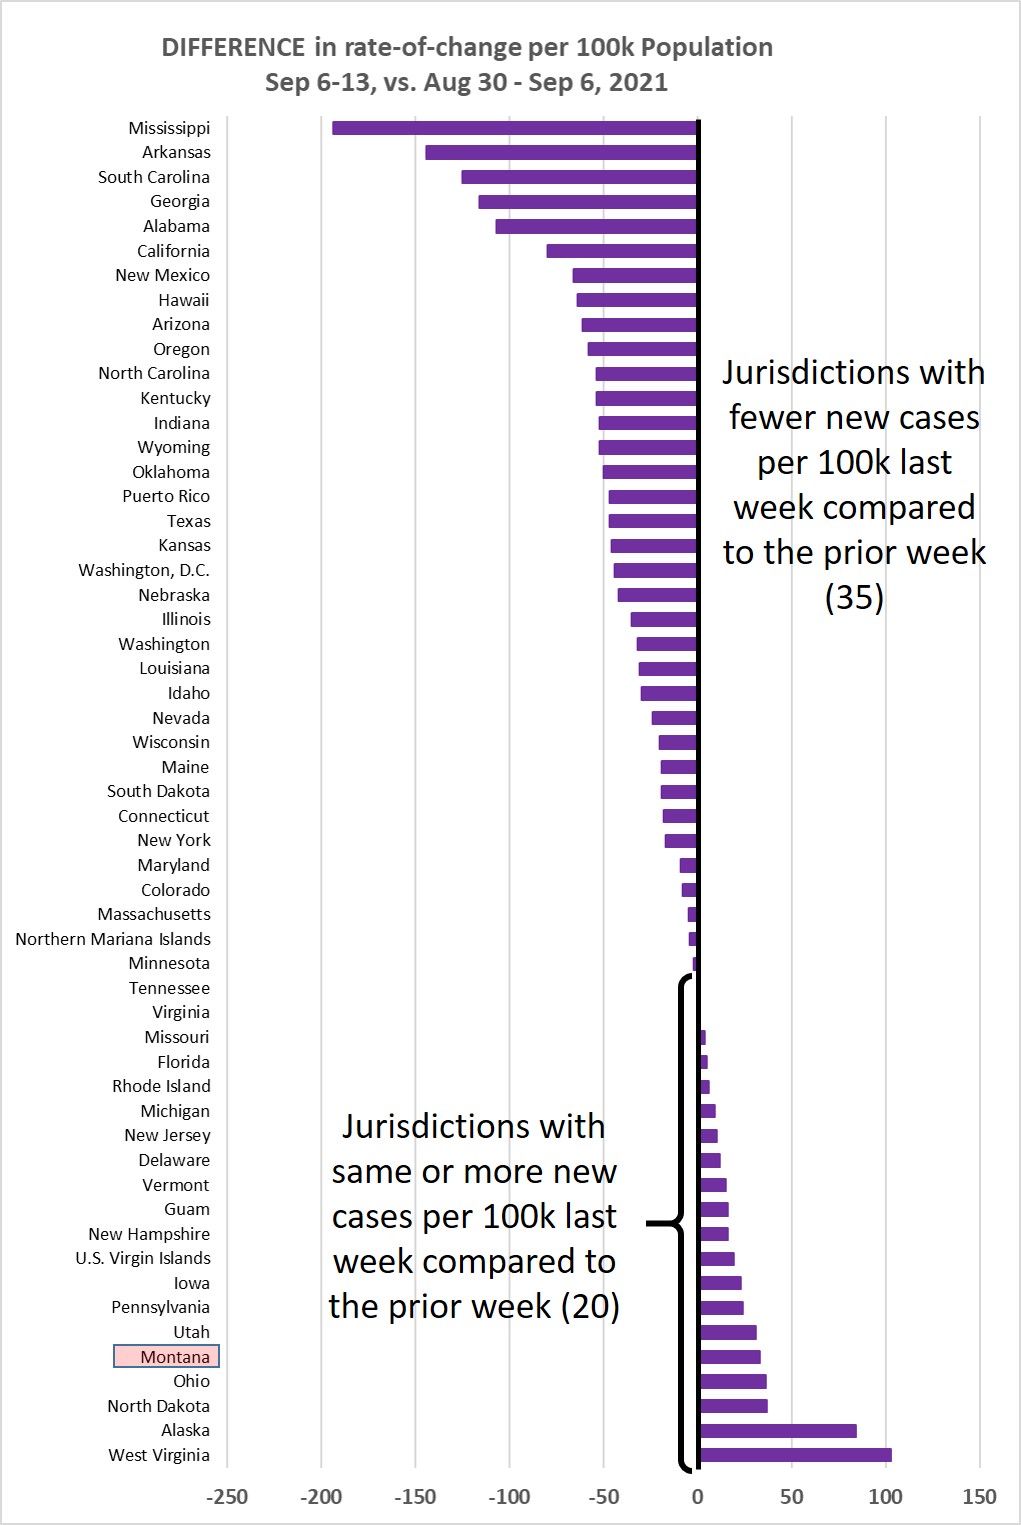
Chart 3 shows the difference in weekly new cases per 100k population for Sep 6-13,
vs. Aug 30-Sep 6, 2021. This past week 20/55 jurisdictions (36%) showed the same or
higher rate of new cases, so maybe we are starting to crest this wave...
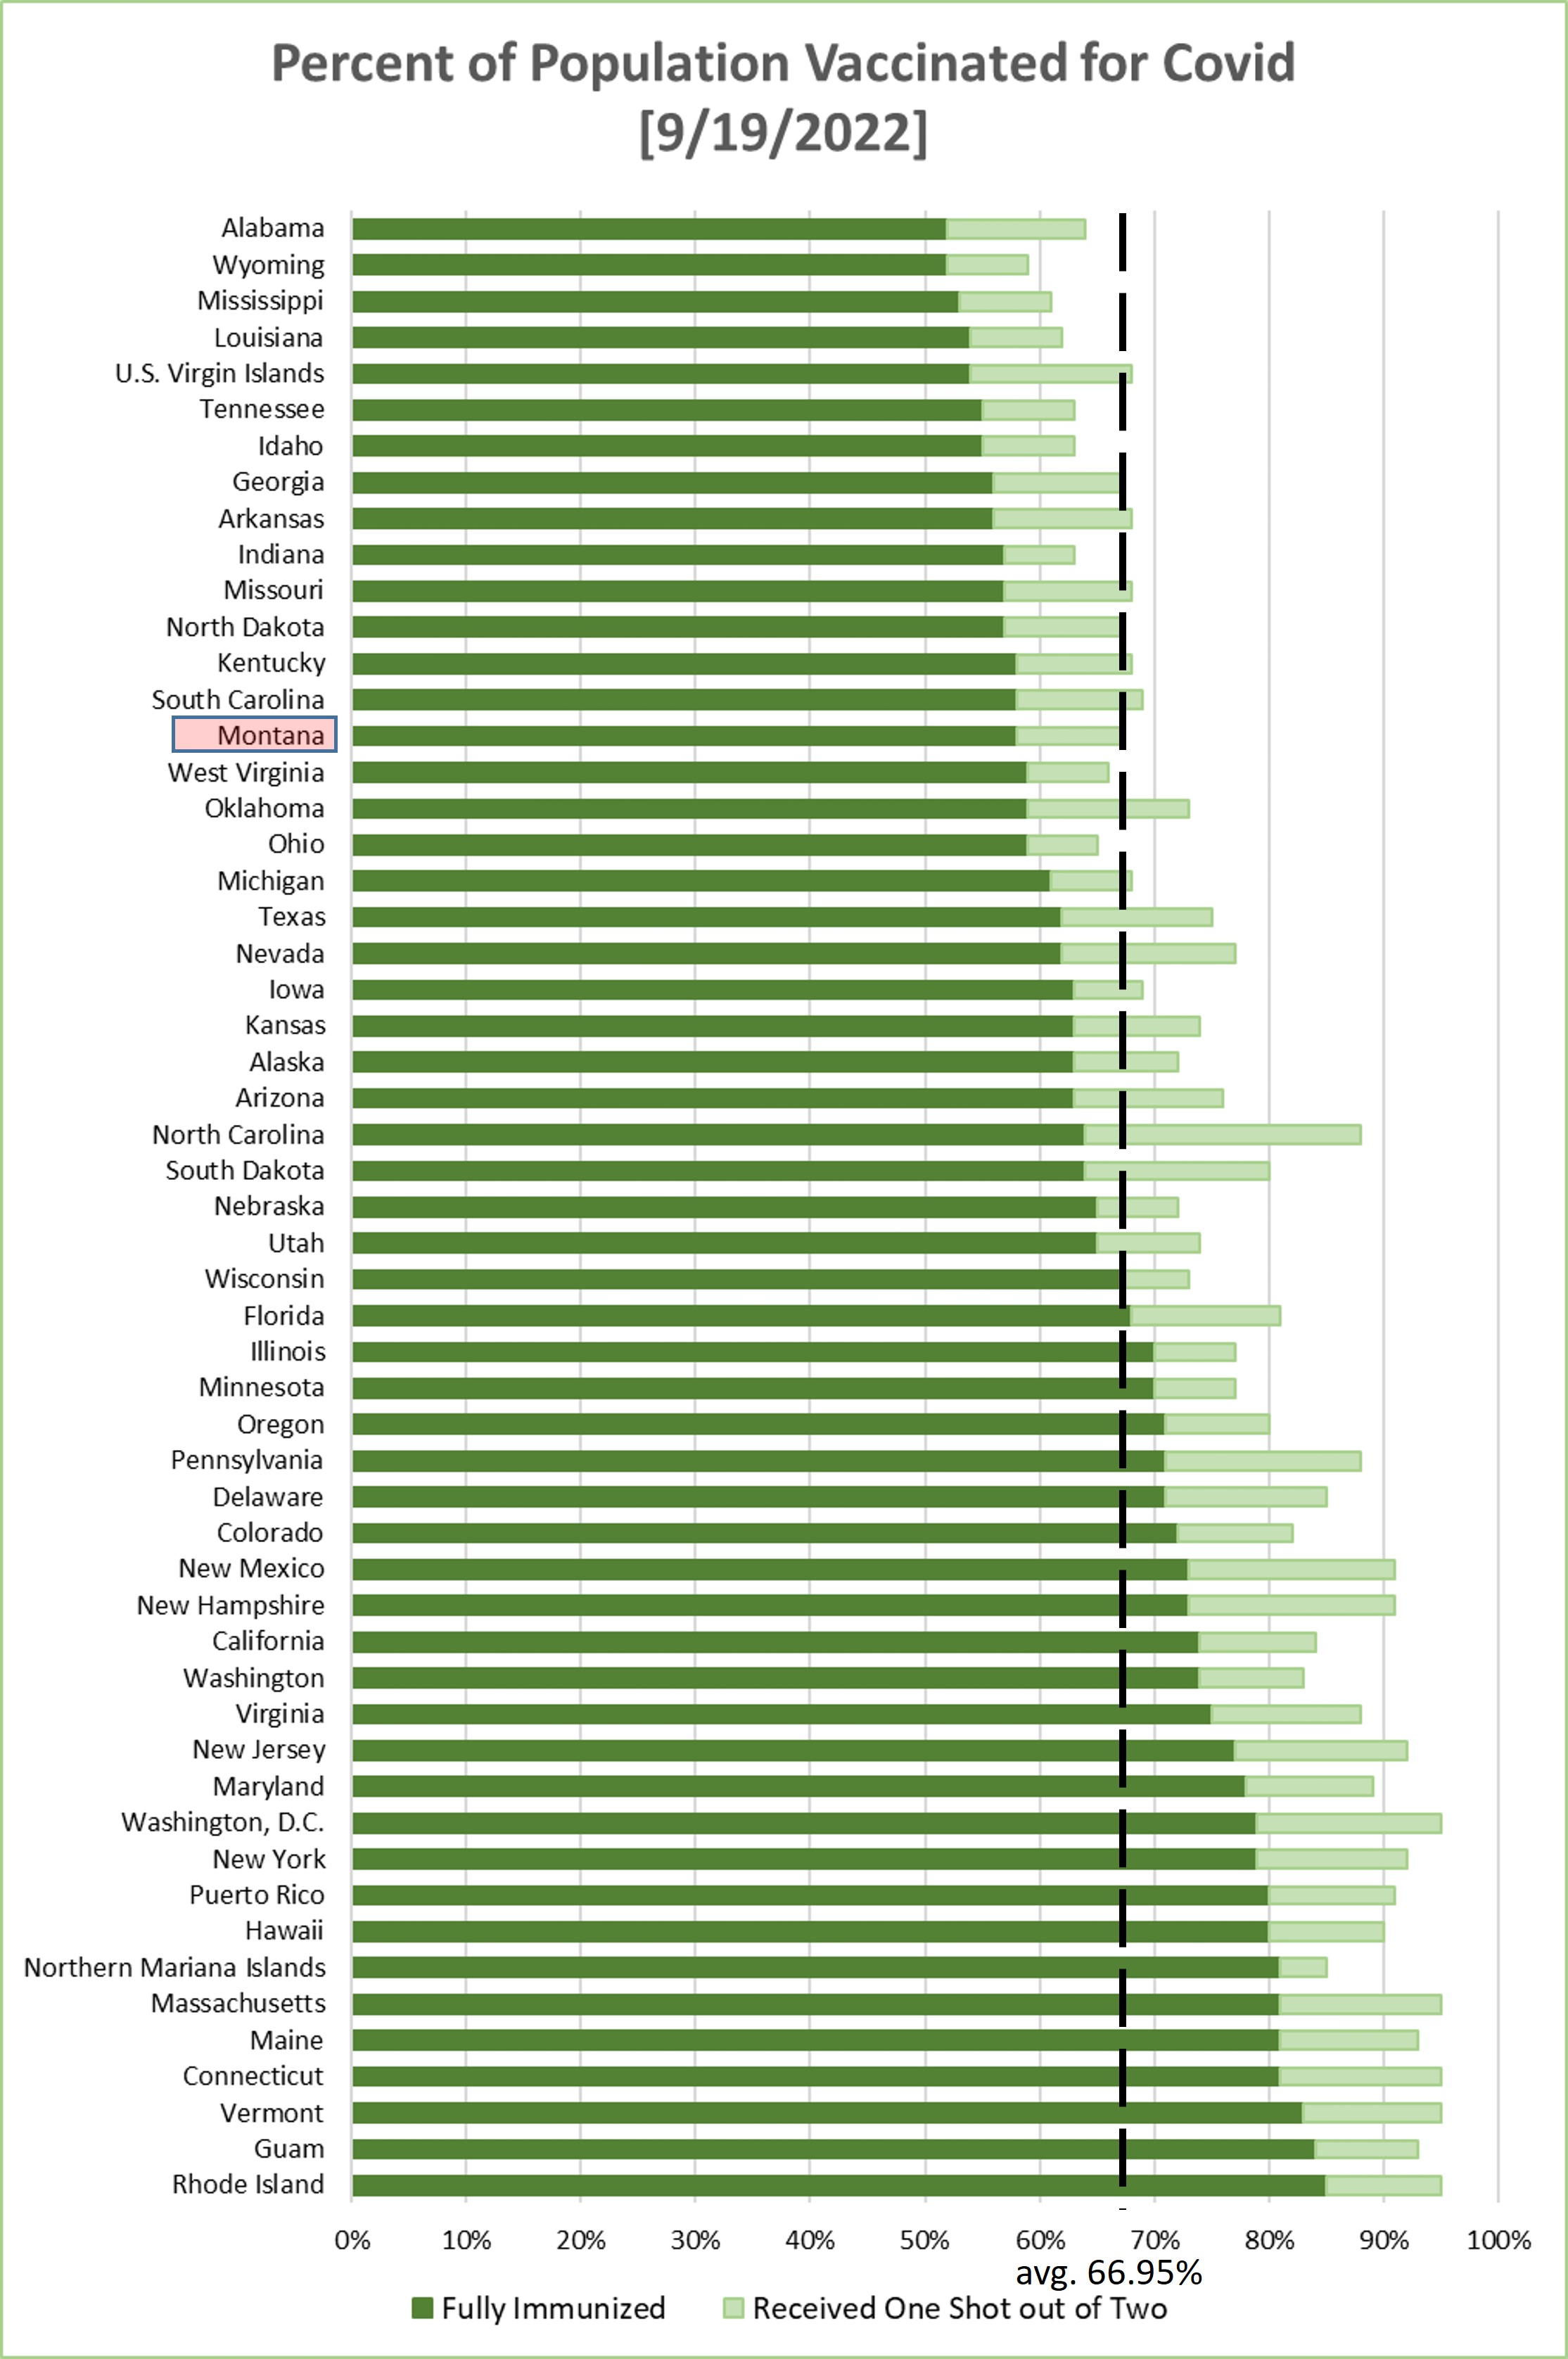
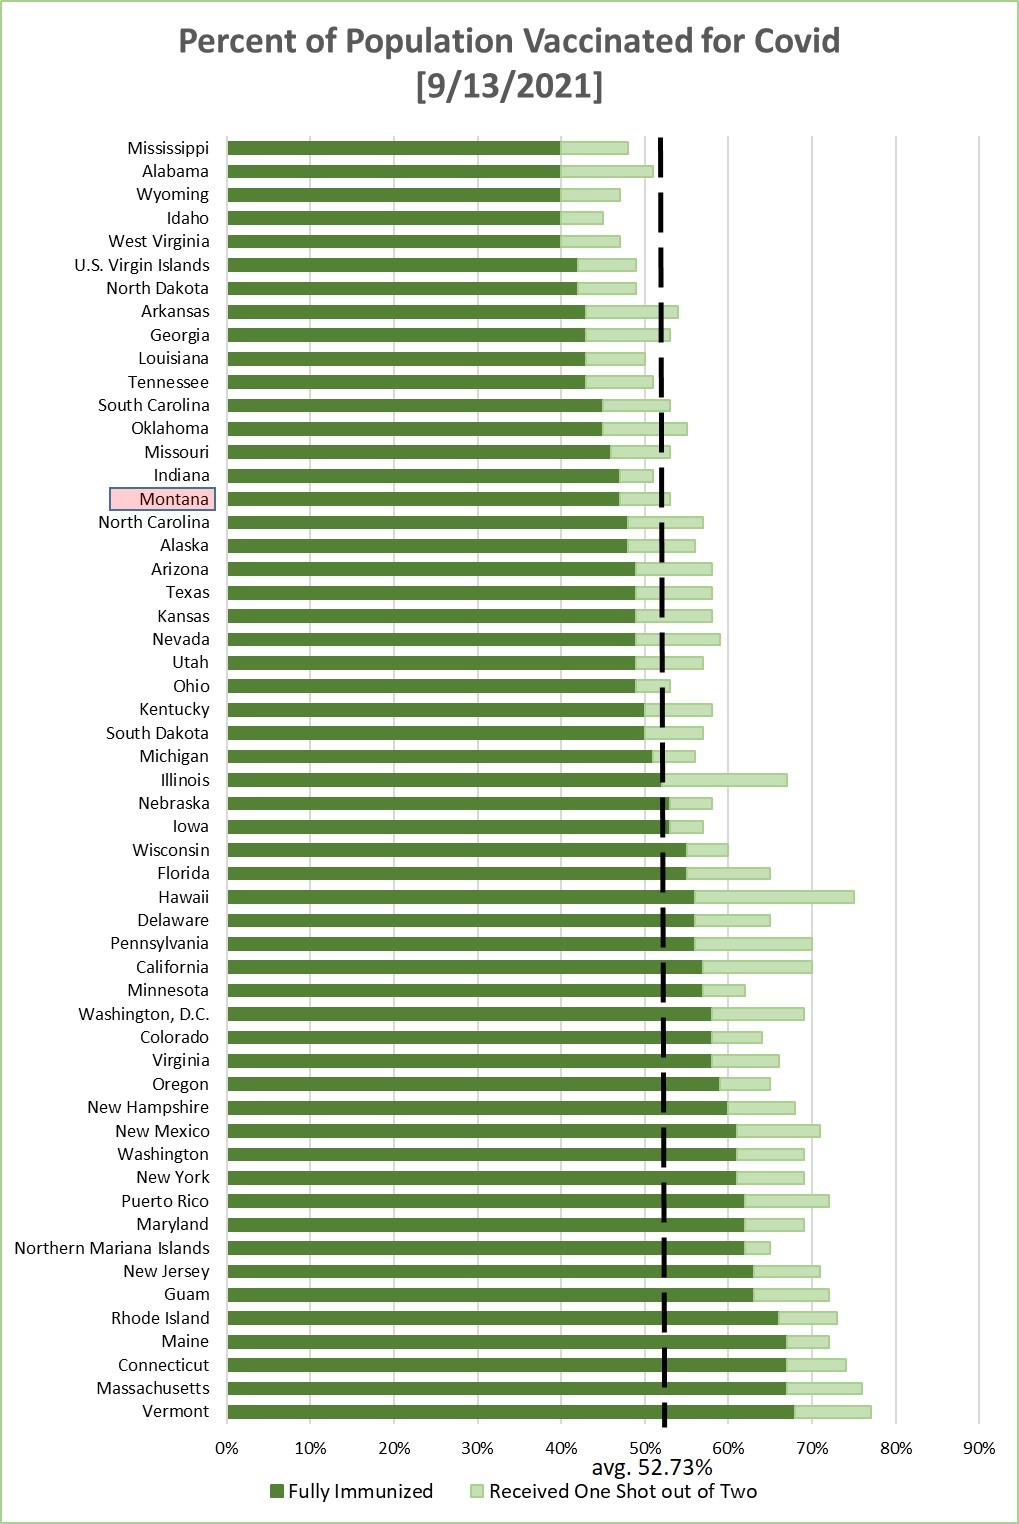
Chart 4 shows the percentage of the population in each jurisdiction having received
1 or 2 Covid-19 vaccination shots. This is sorted by the fraction that have received
2 shots--or one shot of the J&J vaccine. Average across the 55 jurisdictions is 52.7%
being fully immunized--a weekly increase of about 0.71% (weekly increase the prior
week was 0.73%).

Monday, September 6, 2021
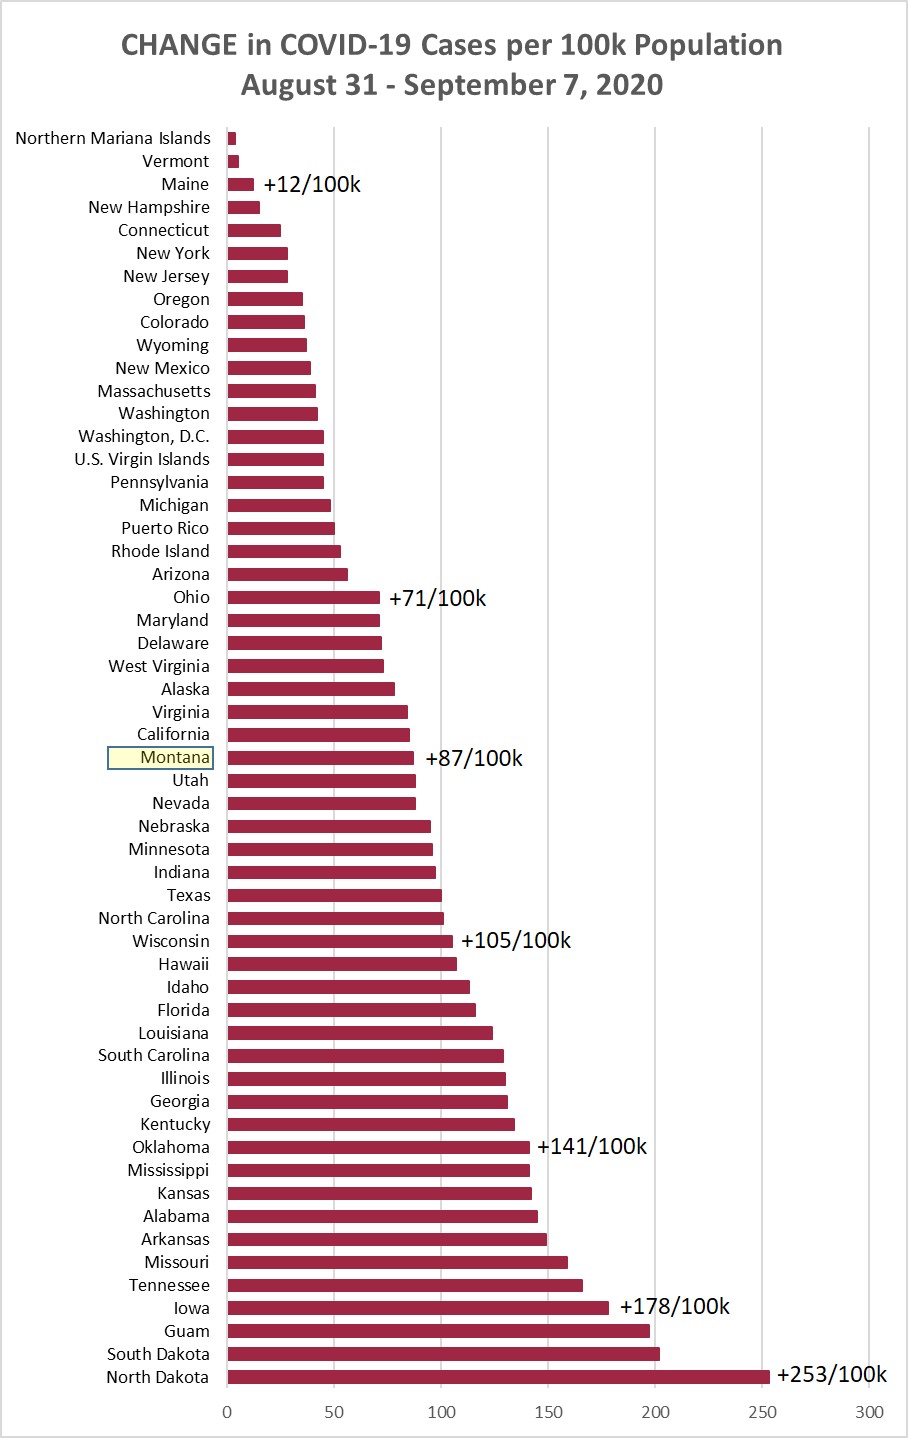
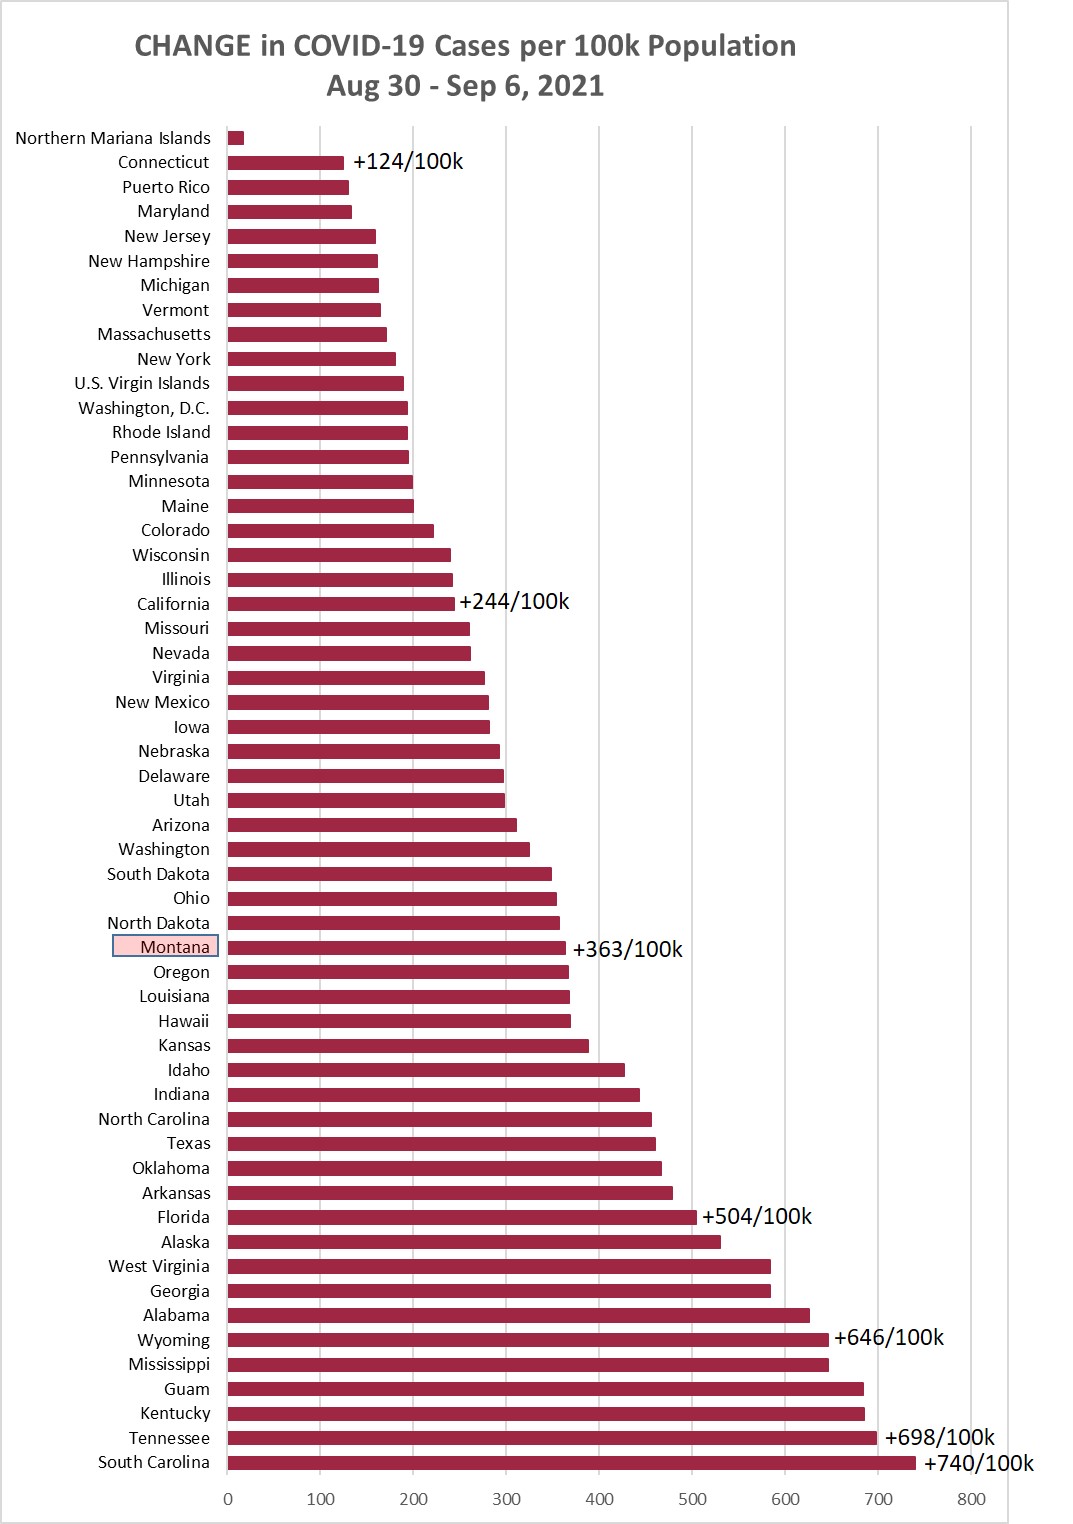
Chart 1 shows the change in cases per 100,000 population as of this morning (September
6, 2021) compared to the cases per 100,000 on August 30, 2021. Montana was up +363/100k
this week, compared to +309/100k the prior week, and +230/100k the week before that.
(A year ago this week Montana had +87/100k.)
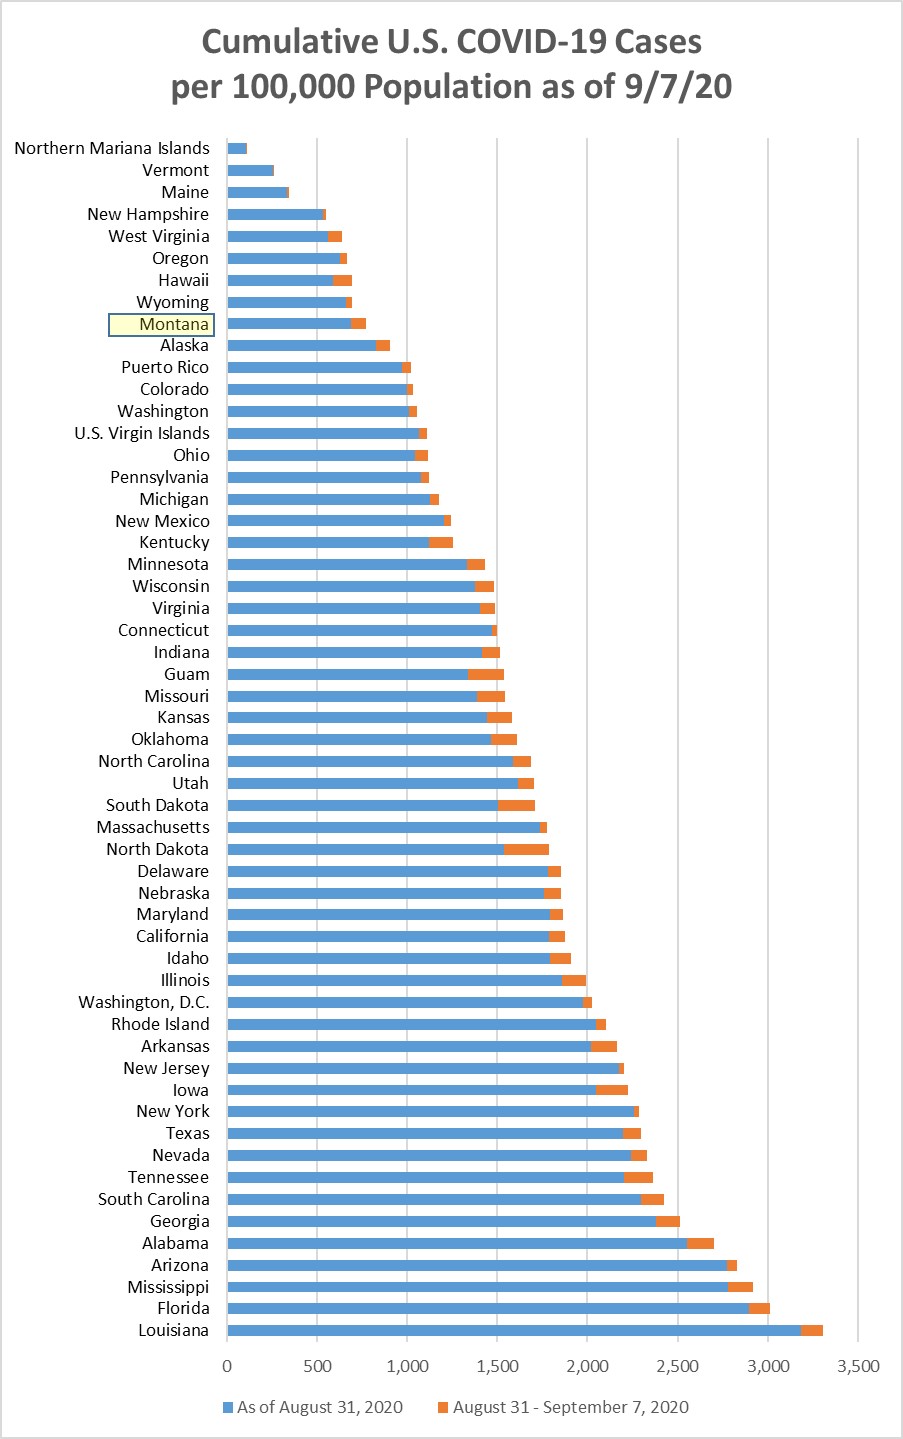
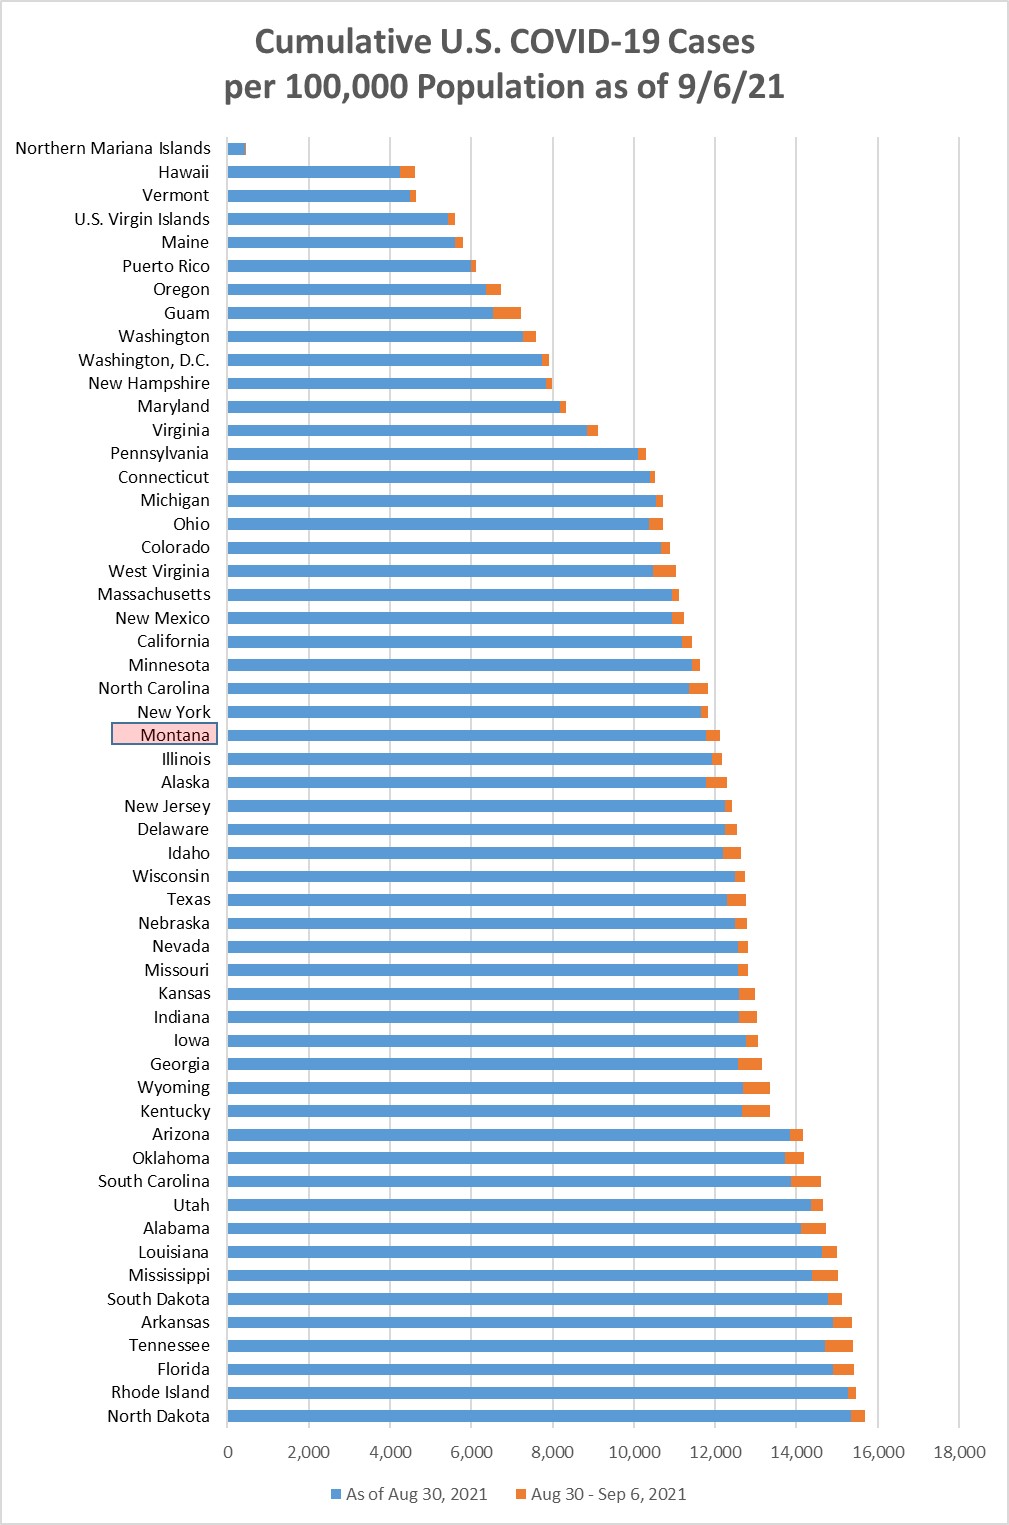
Chart 2 shows the same information as Chart 1, but with the overall cumulative cases
per 100k in each state to September 6. MT is 26/55 (30th highest), being passed by
Alaska this week. Montana has had 12.1% of the population with a positive Covid test
at some point during the pandemic.
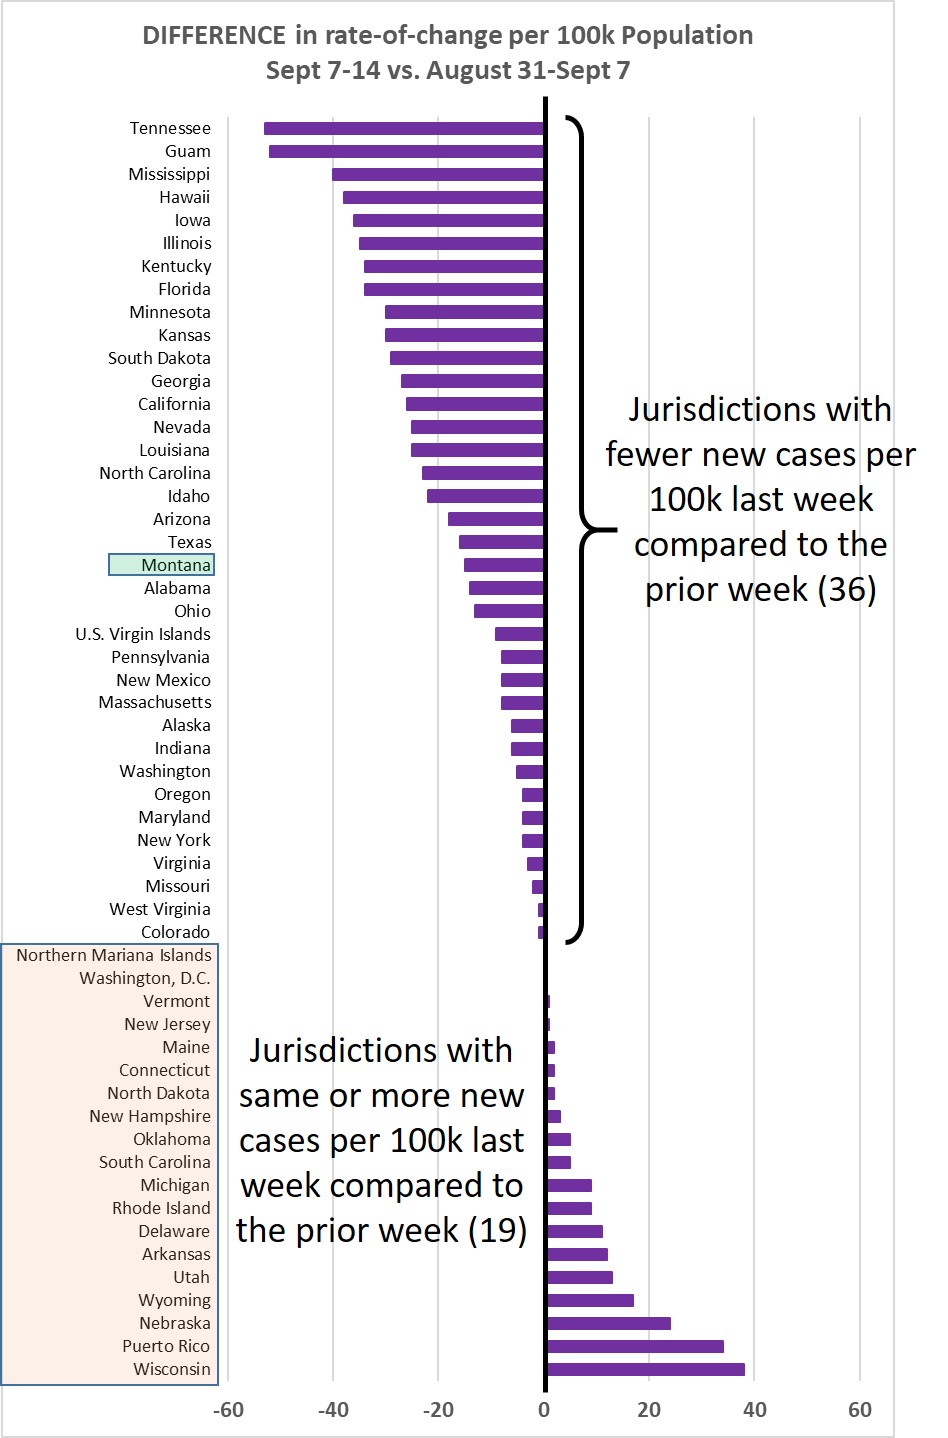
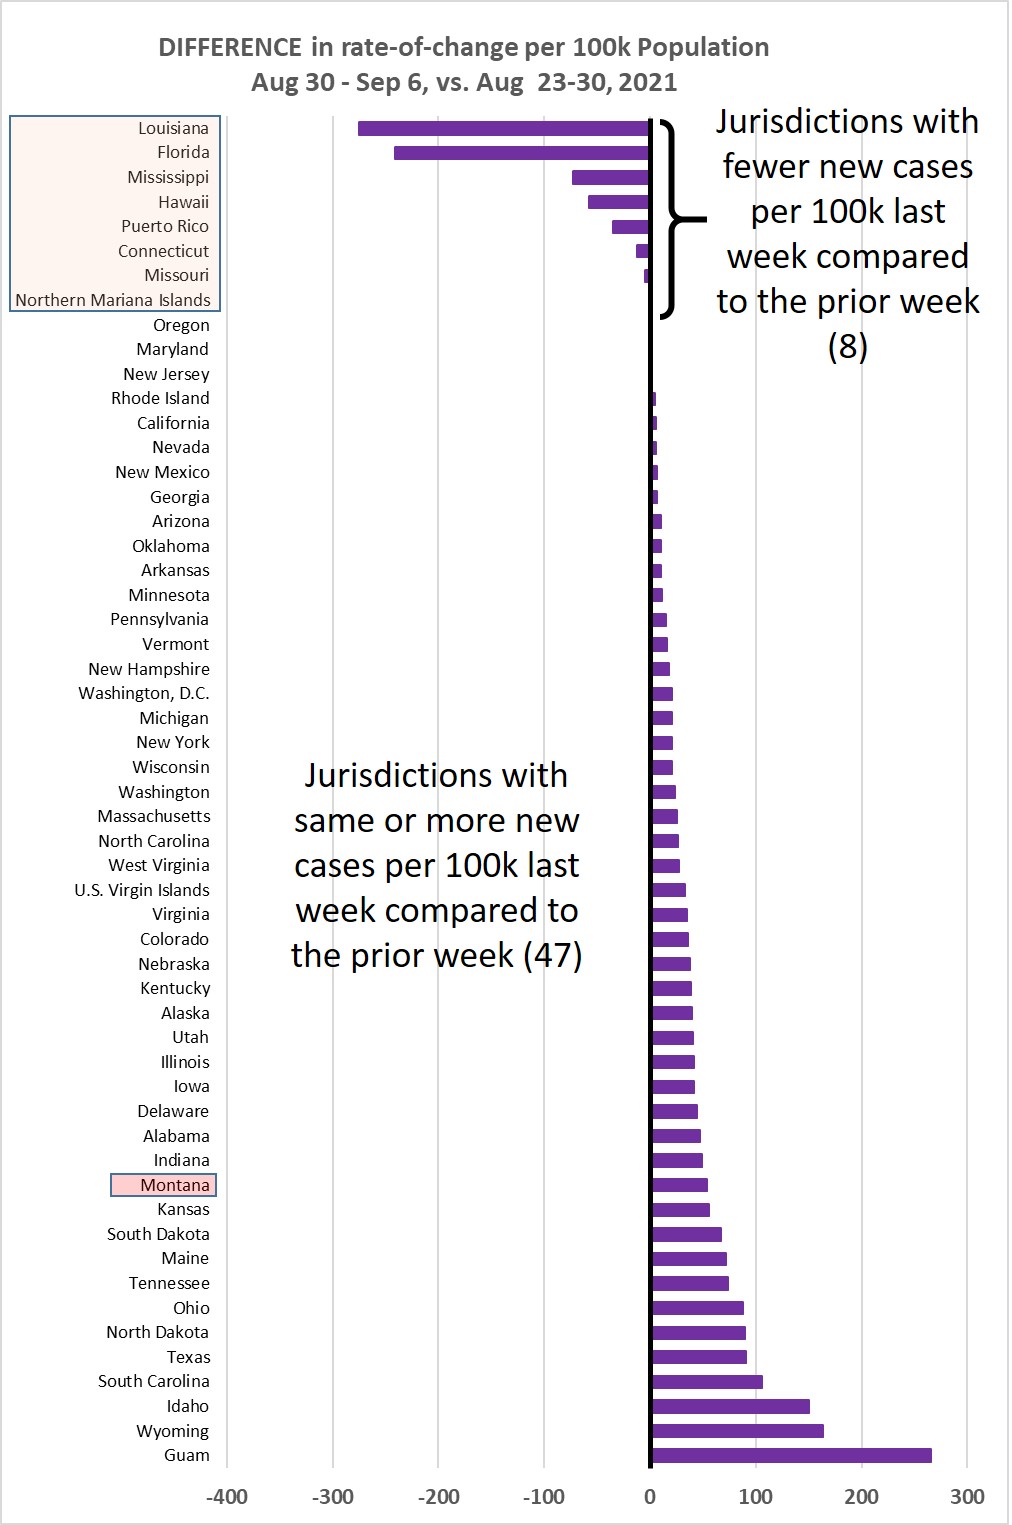
Chart 3 shows the difference in weekly new cases per 100k population for Aug 30-Sep
6, vs. Aug 23-30, 2021. This past week 47/55 jurisdictions (86%) showed the same or
higher rate of new cases. I imagine that Louisiana had trouble detecting and reporting
cases due to hurricane Ida.
Chart 4 shows the percentage of the population in each jurisdiction having received
1 or 2 Covid-19 vaccination shots. This is sorted by the fraction that have received
2 shots--or one shot of the J&J vaccine. Average across the 55 jurisdictions is 52%
being fully immunized--a weekly increase of about 0.73% (weekly increase the prior
week was 0.89%).

Monday, August 30, 2021
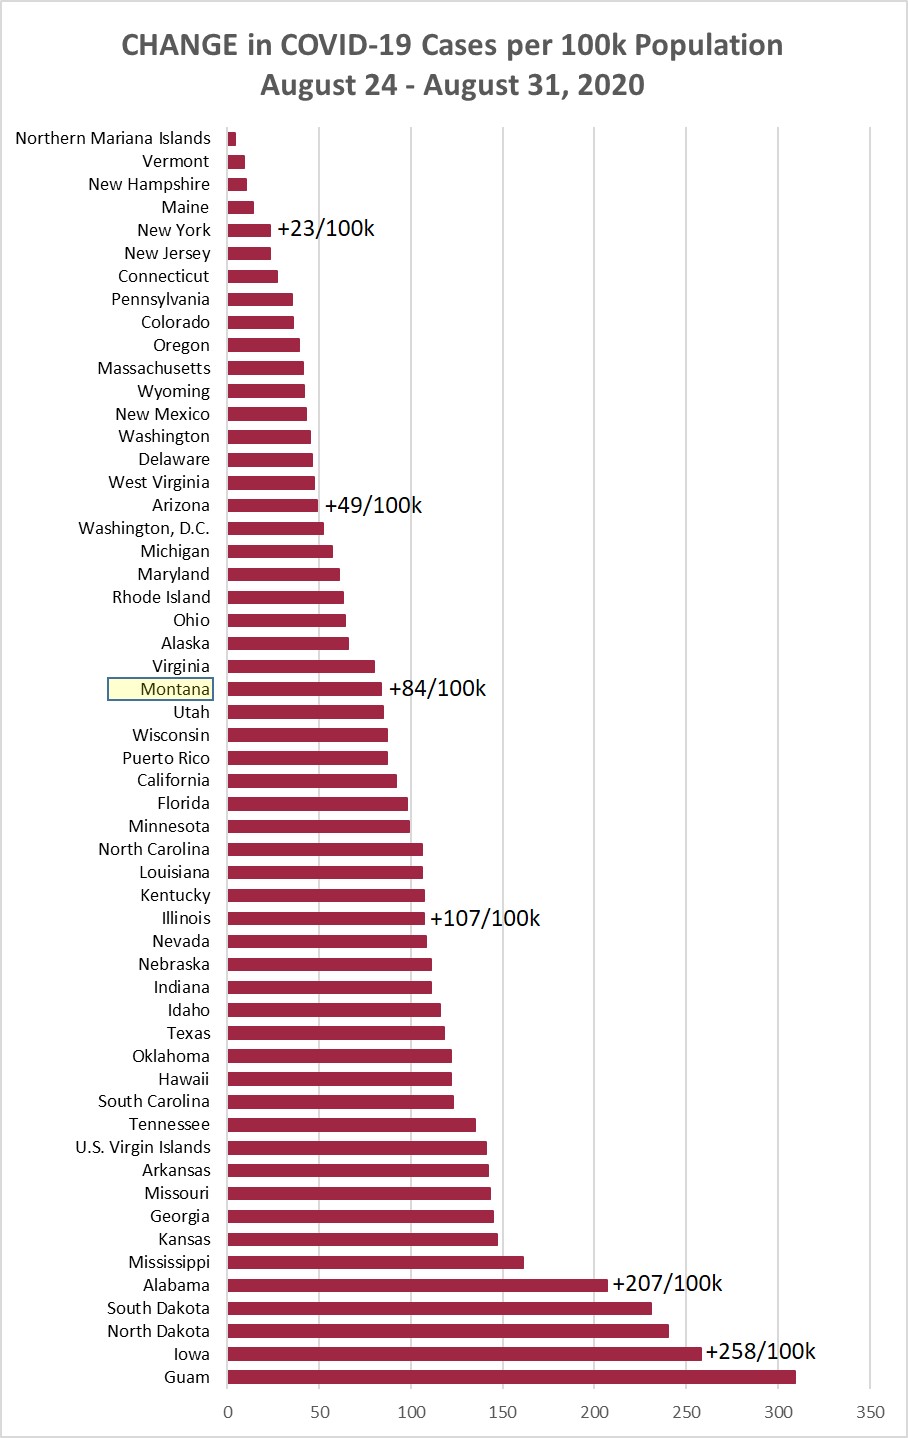
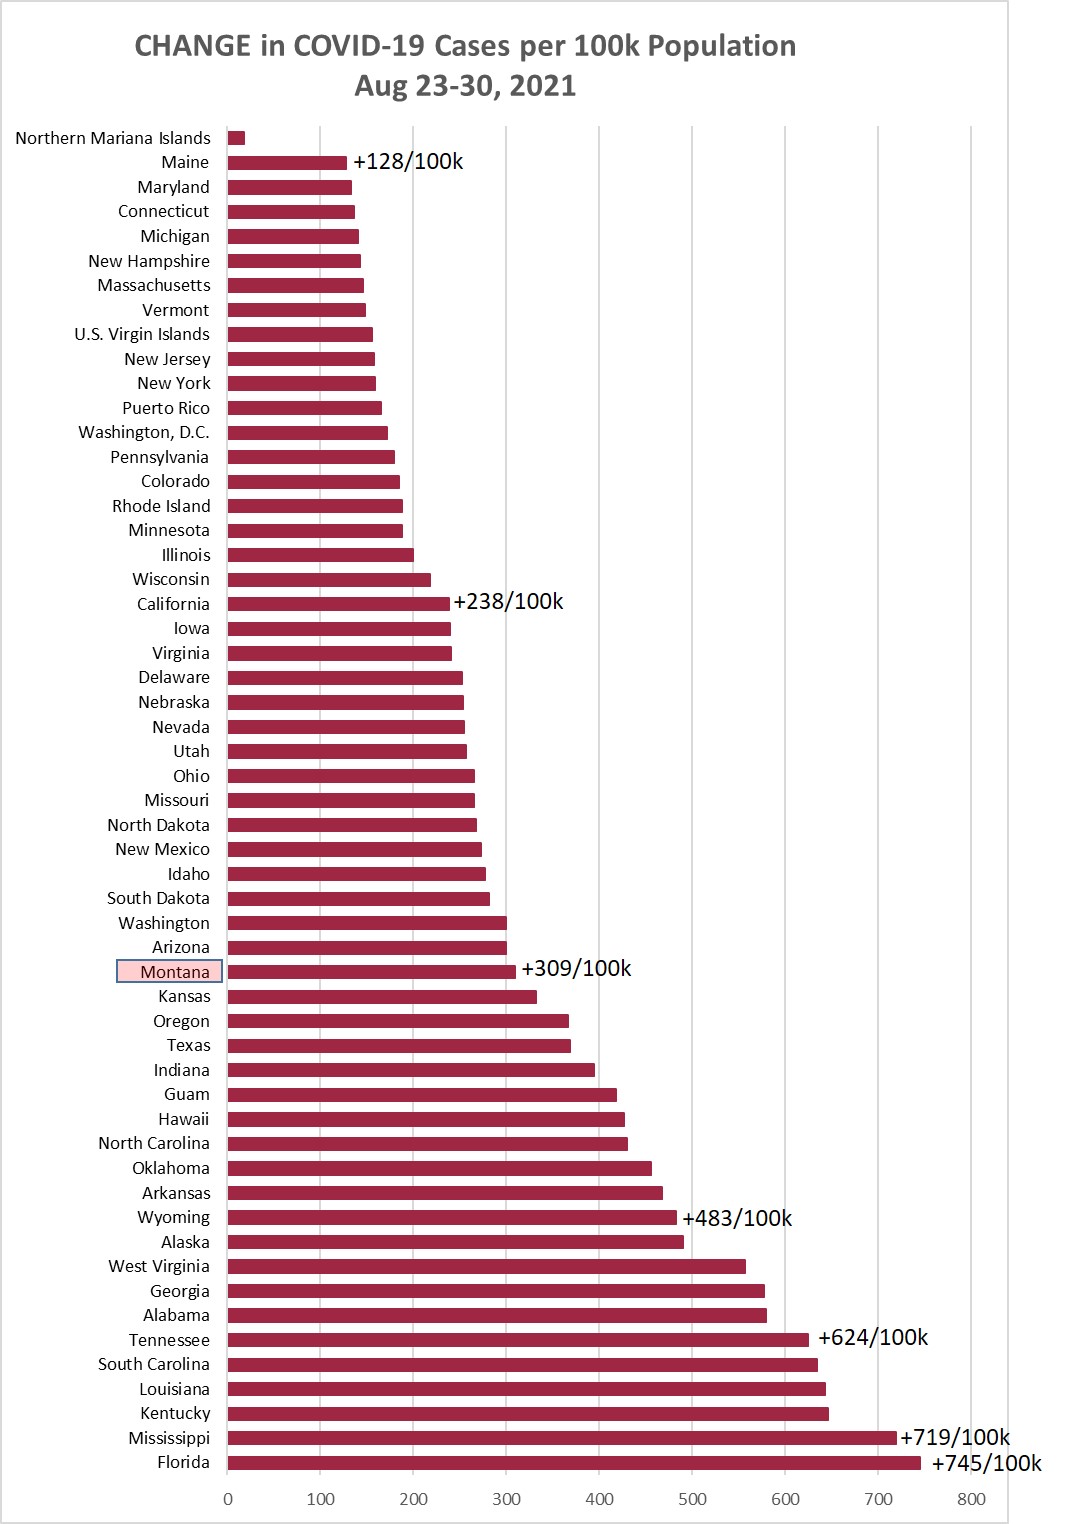
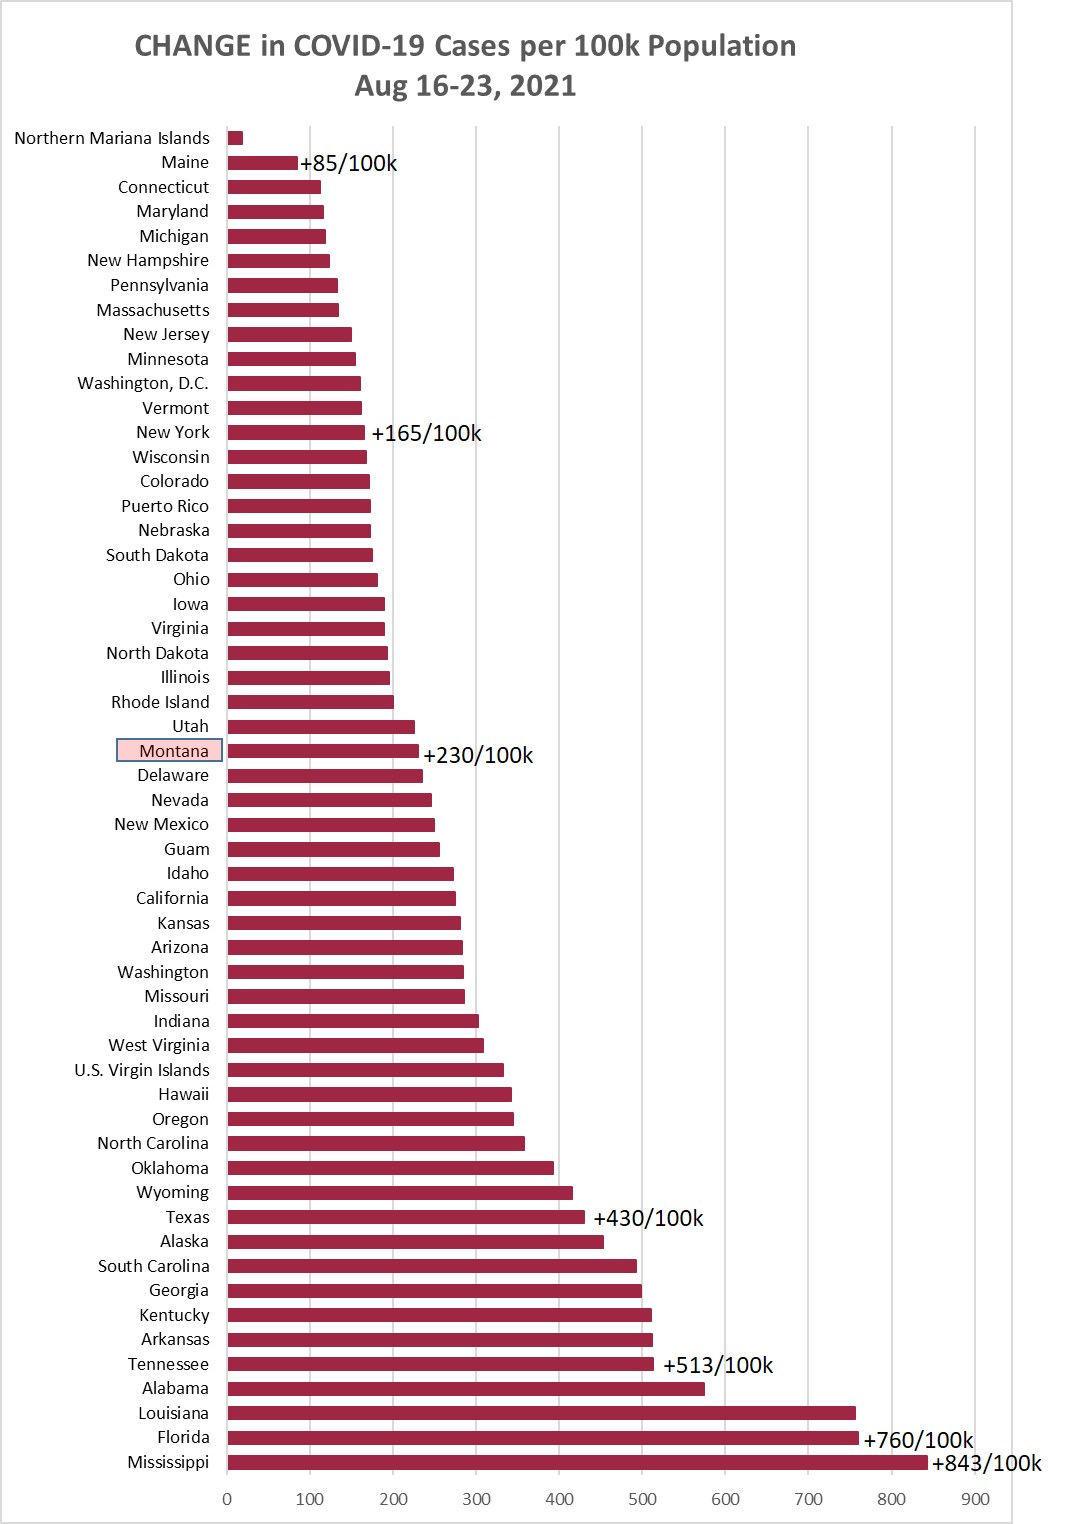
Chart 1 shows the change in cases per 100,000 population as of this morning (August
30, 2021) compared to the cases per 100,000 on August 23, 2021. Montana was up +309/100k
this week, compared to +230/100k the prior week, and +185/100k the week before that.
(A year ago this week Montana had +84/100k.)
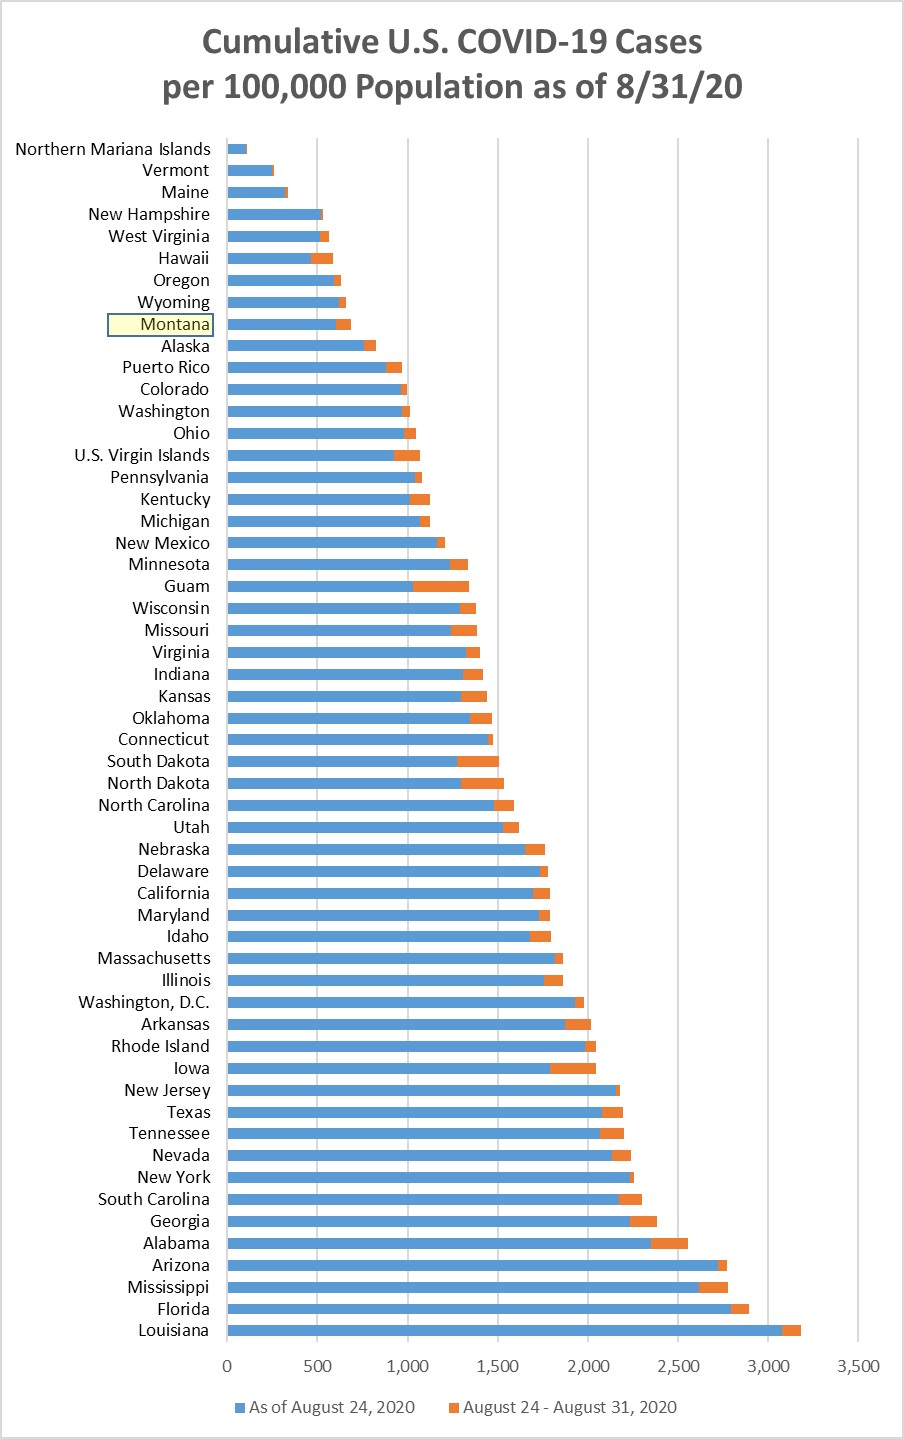
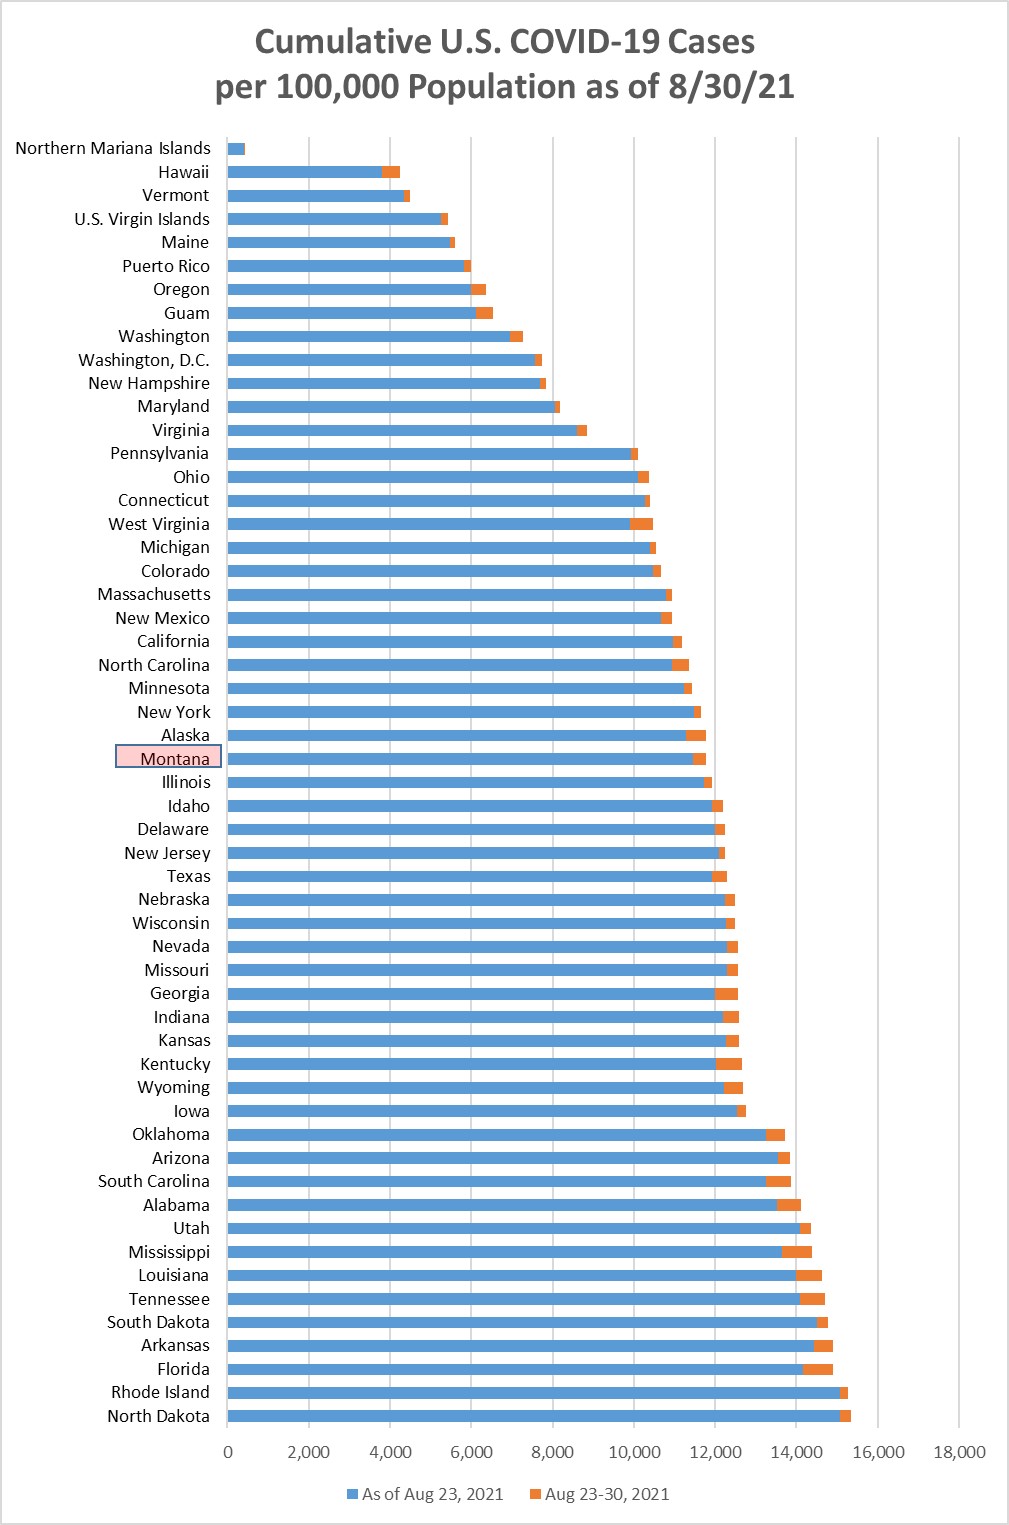
Chart 2 shows the same information as Chart 1, but with the overall cumulative cases
per 100k in each state to August 30. MT is 26/55 (29th highest). Montana has had 11.76%
of the population with a positive Covid test at some point during the pandemic.
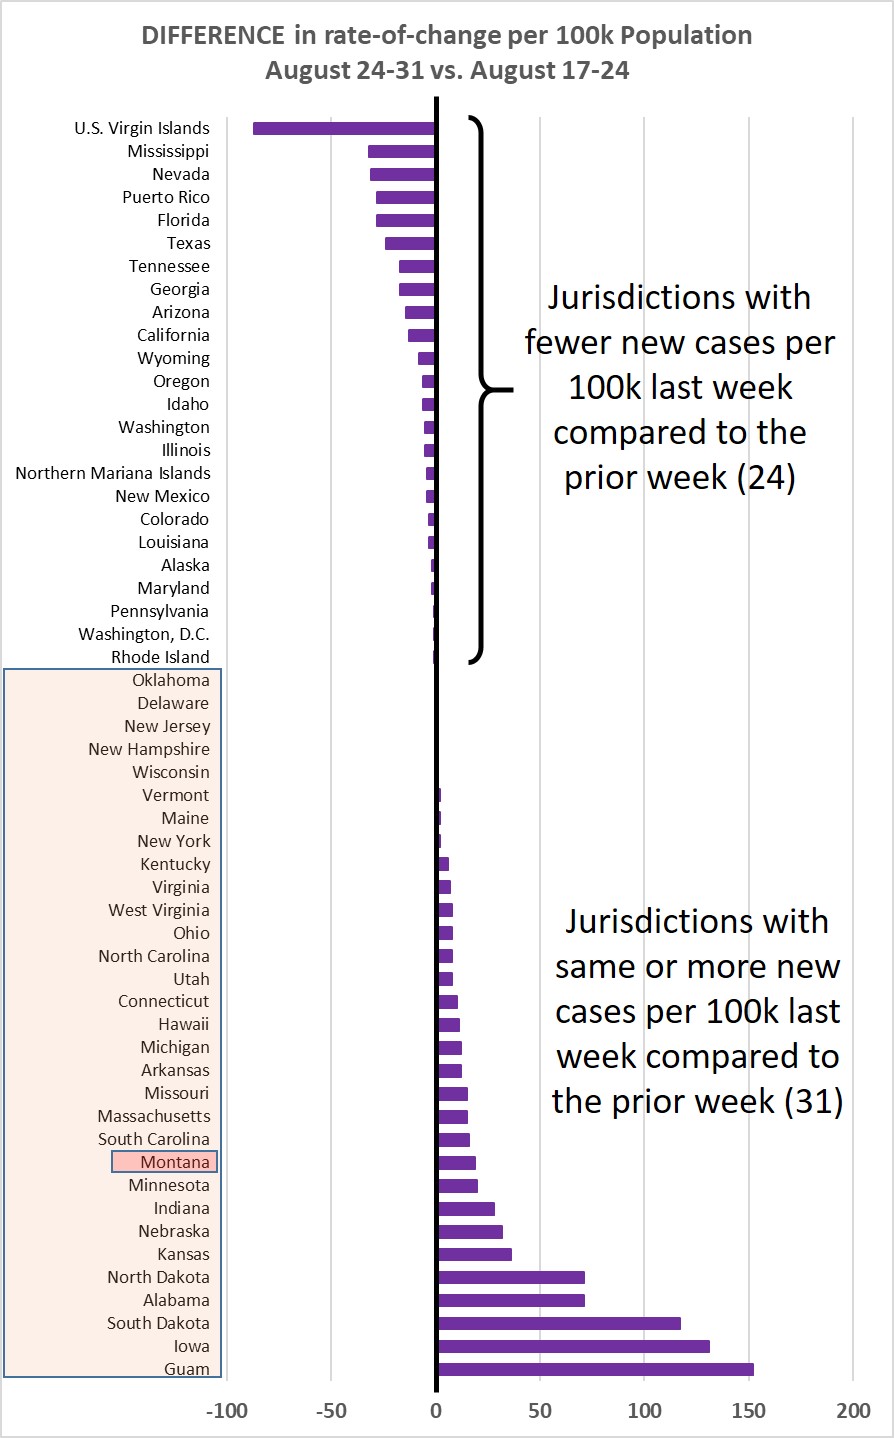
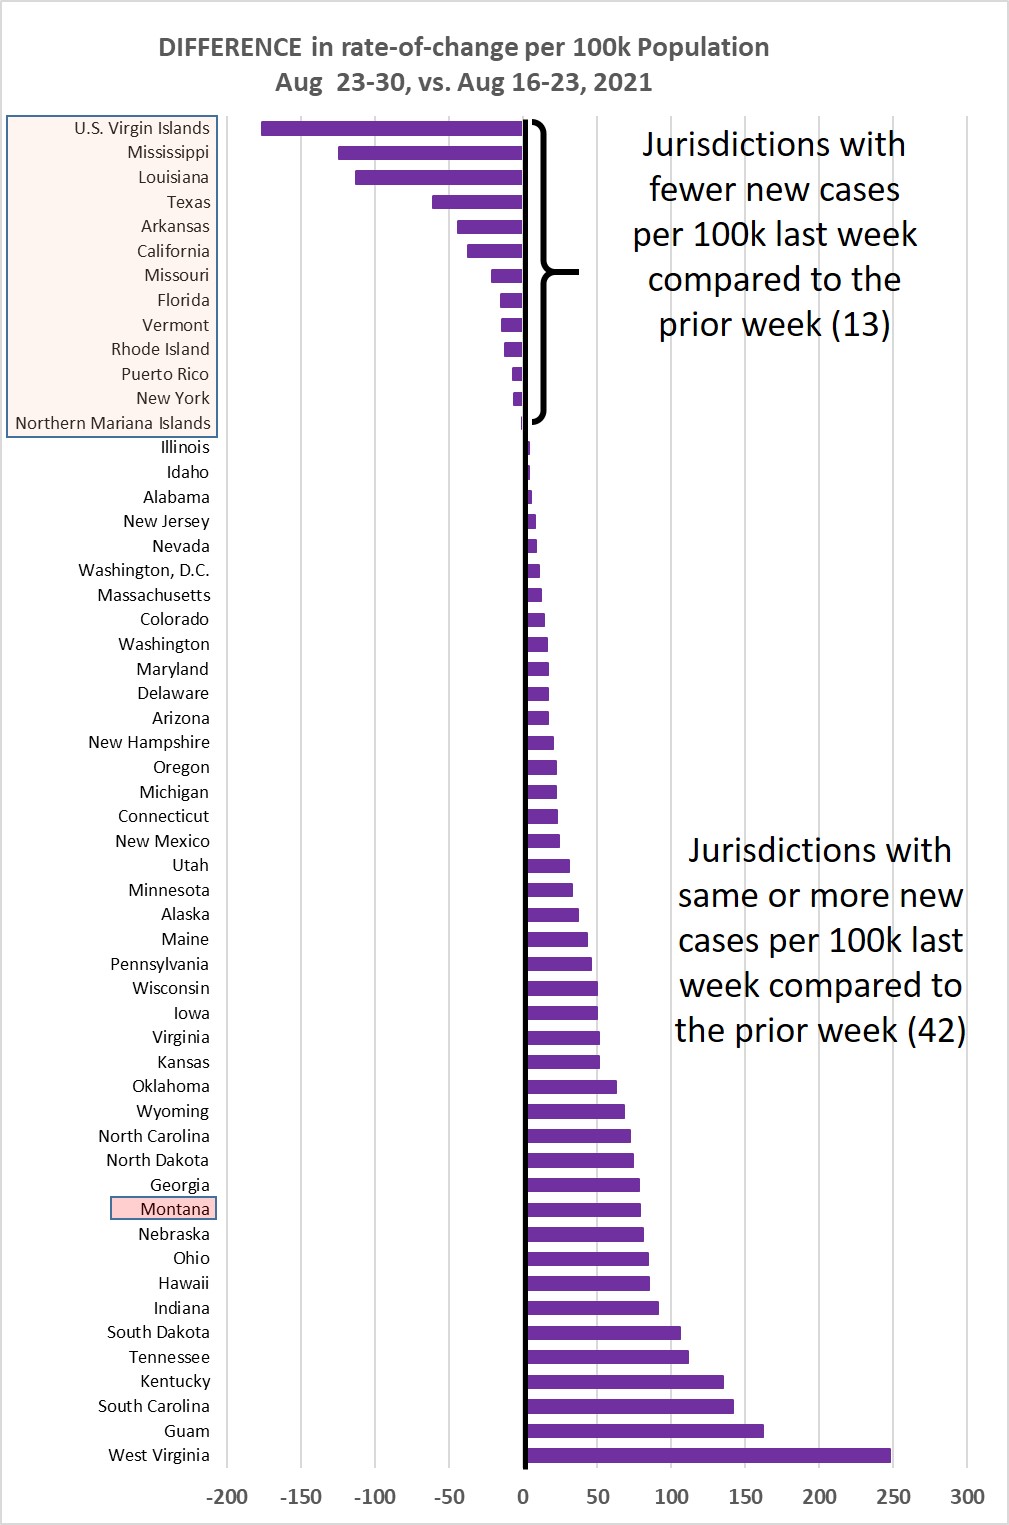
Chart 3 shows the difference in weekly new cases per 100k population for Aug 23-30,
vs. Aug 16-23, 2021. This past week 42/55 jurisdictions (76%) showed the same or higher
rate of new cases.
Chart 4 shows the percentage of the population in each jurisdiction having received
1 or 2 Covid-19 vaccination shots. This is sorted by the fraction that have received
2 shots--or one shot of the J&J vaccine. Average across the 55 jurisdictions is 51.3%
being fully immunized--a weekly increase of about 0.89% (weekly increase the prior
week was 0.62%).

Monday, August 23, 2021
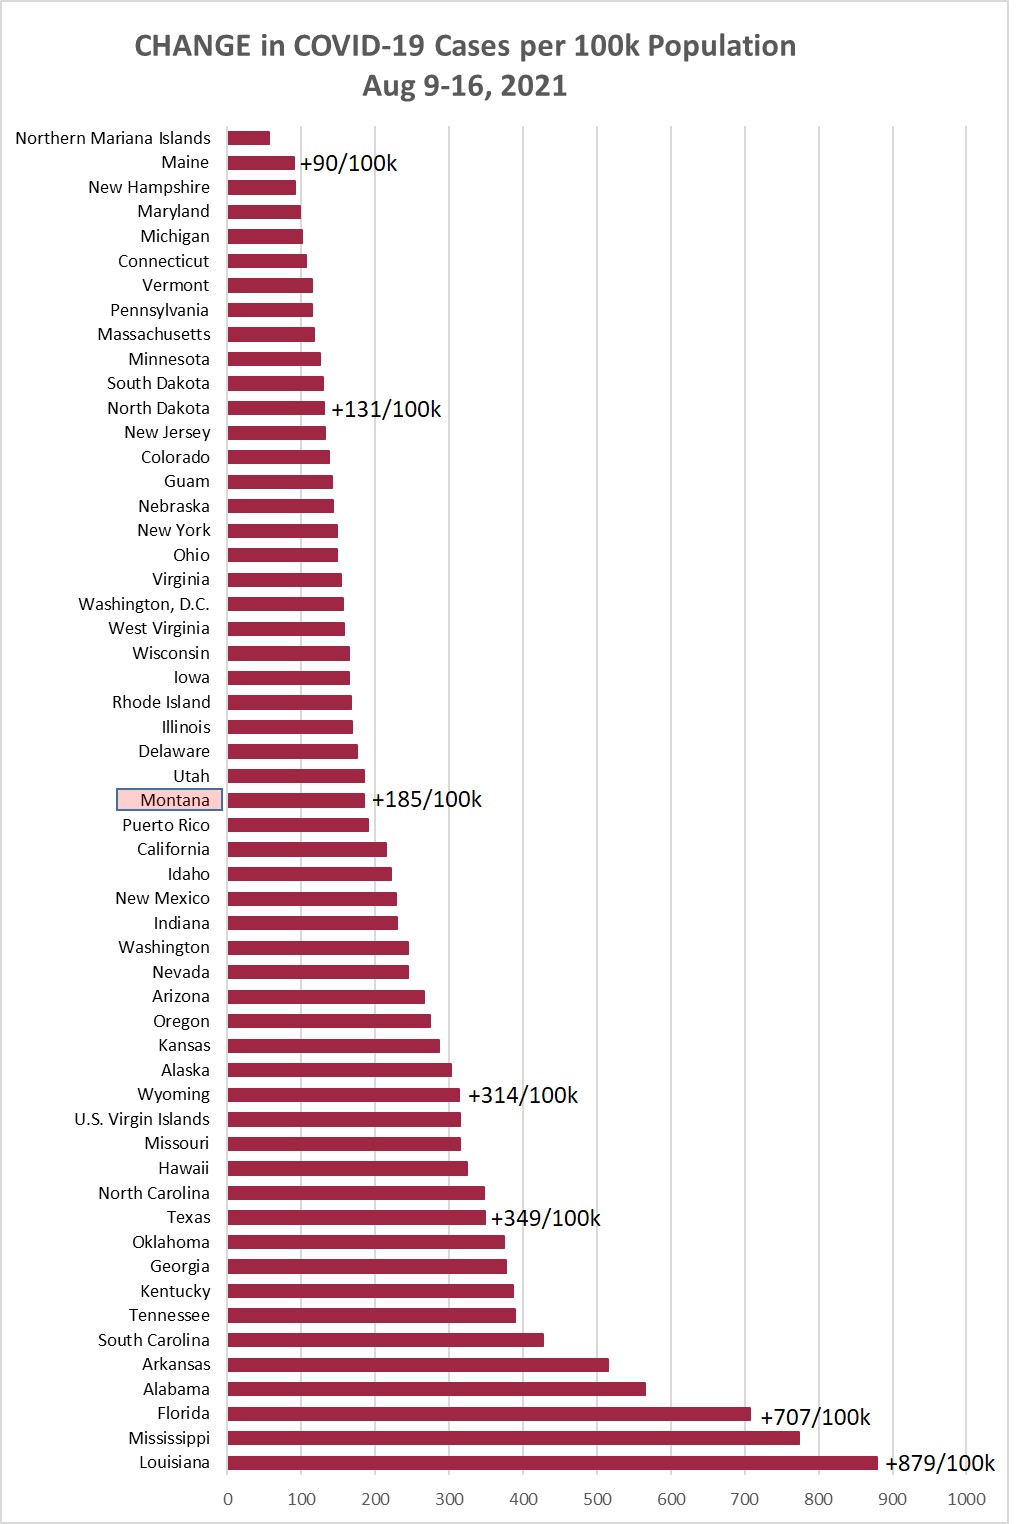
Chart 1 shows the change in cases per 100,000 population as of this morning (August
23, 2021) compared to the cases per 100,000 on August 16, 2021. Montana was up +230/100k
this week, compared to +185/100k the prior week, and +142/100k the week before that.
(A year ago this week Montana had +65/100k.)
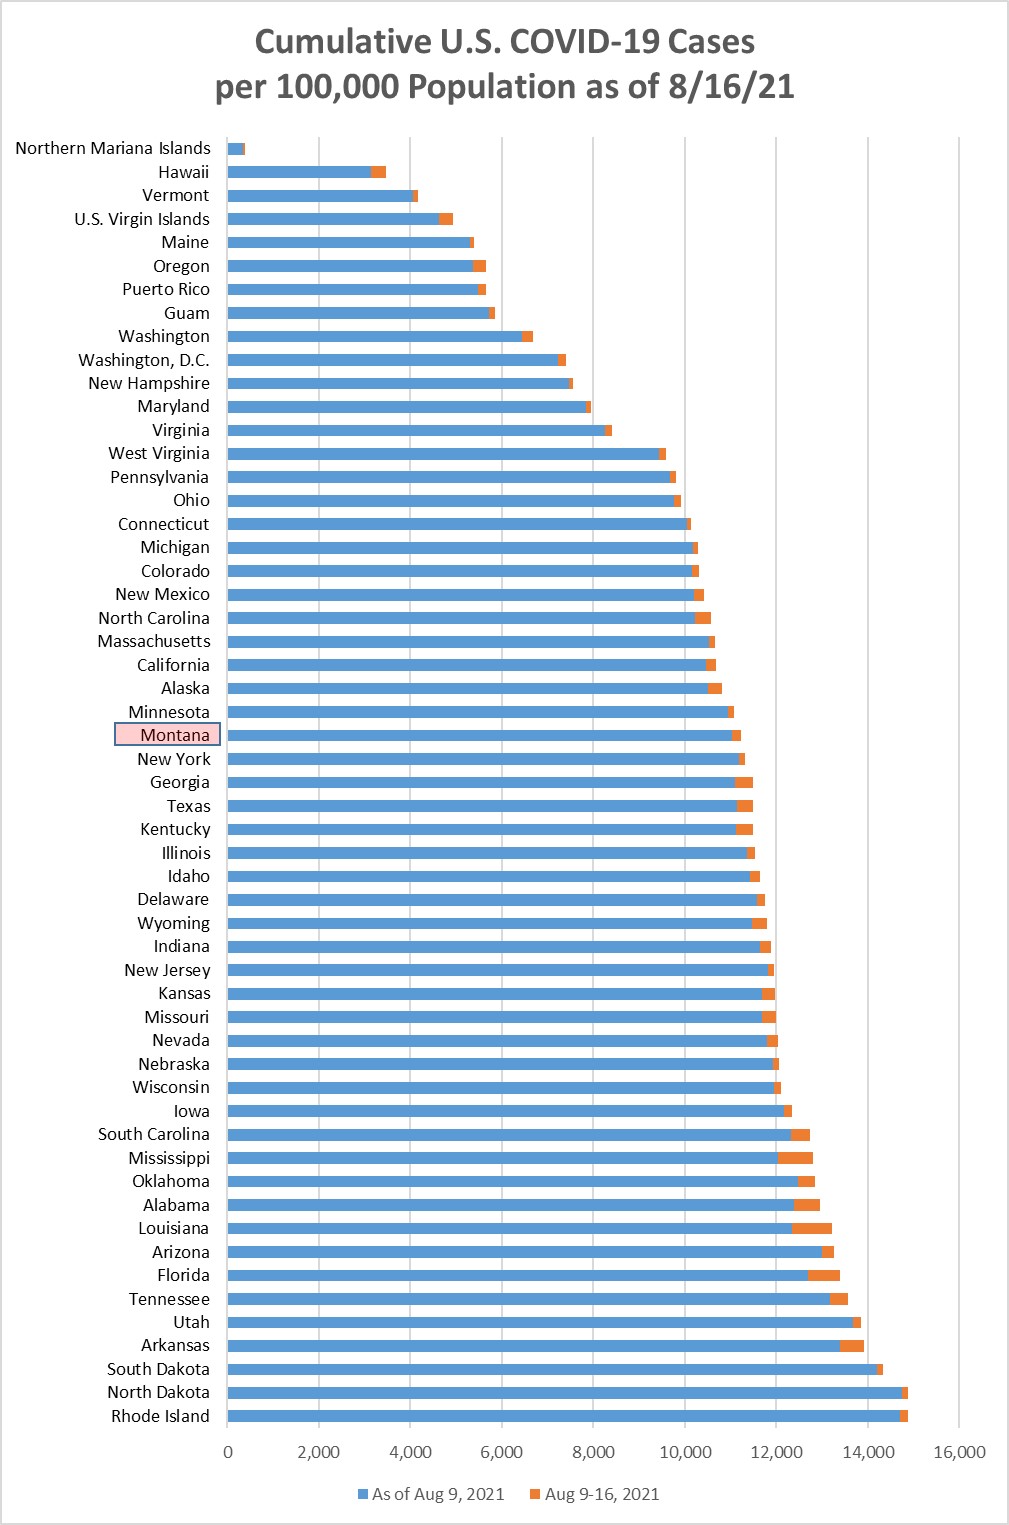
Chart 2 shows the same information as Chart 1, but with the overall cumulative cases
per 100k in each state to August 23. MT is 26/55 (30th highest). Montana has had 11.5%
of the population with a positive Covid test at some point during the pandemic.
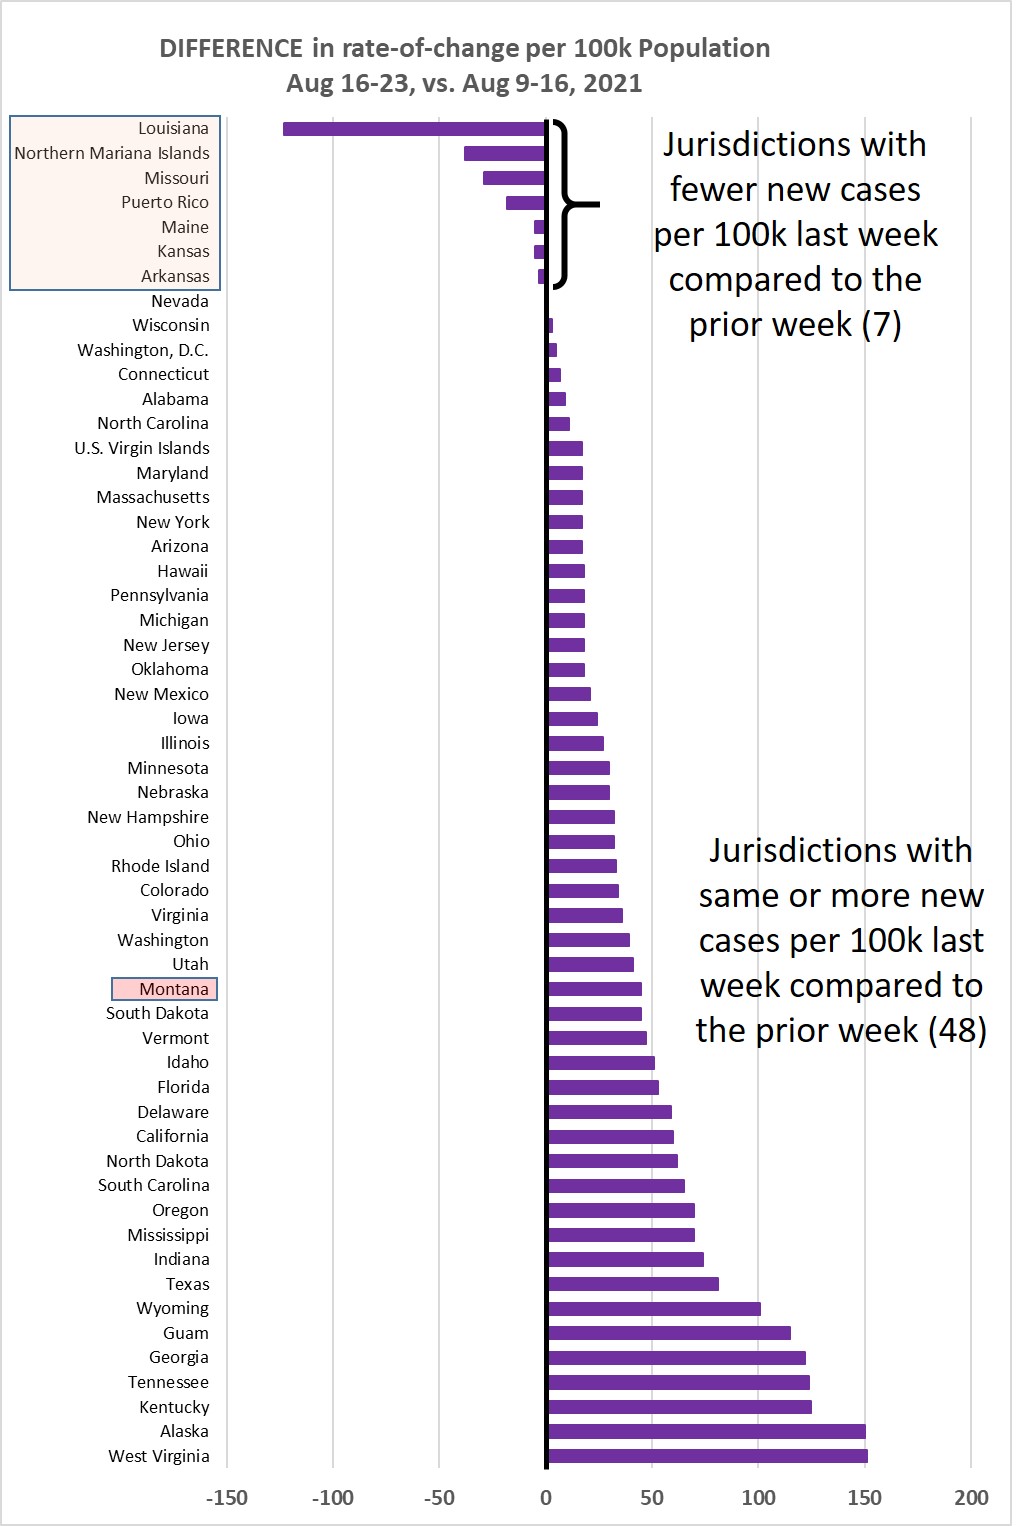
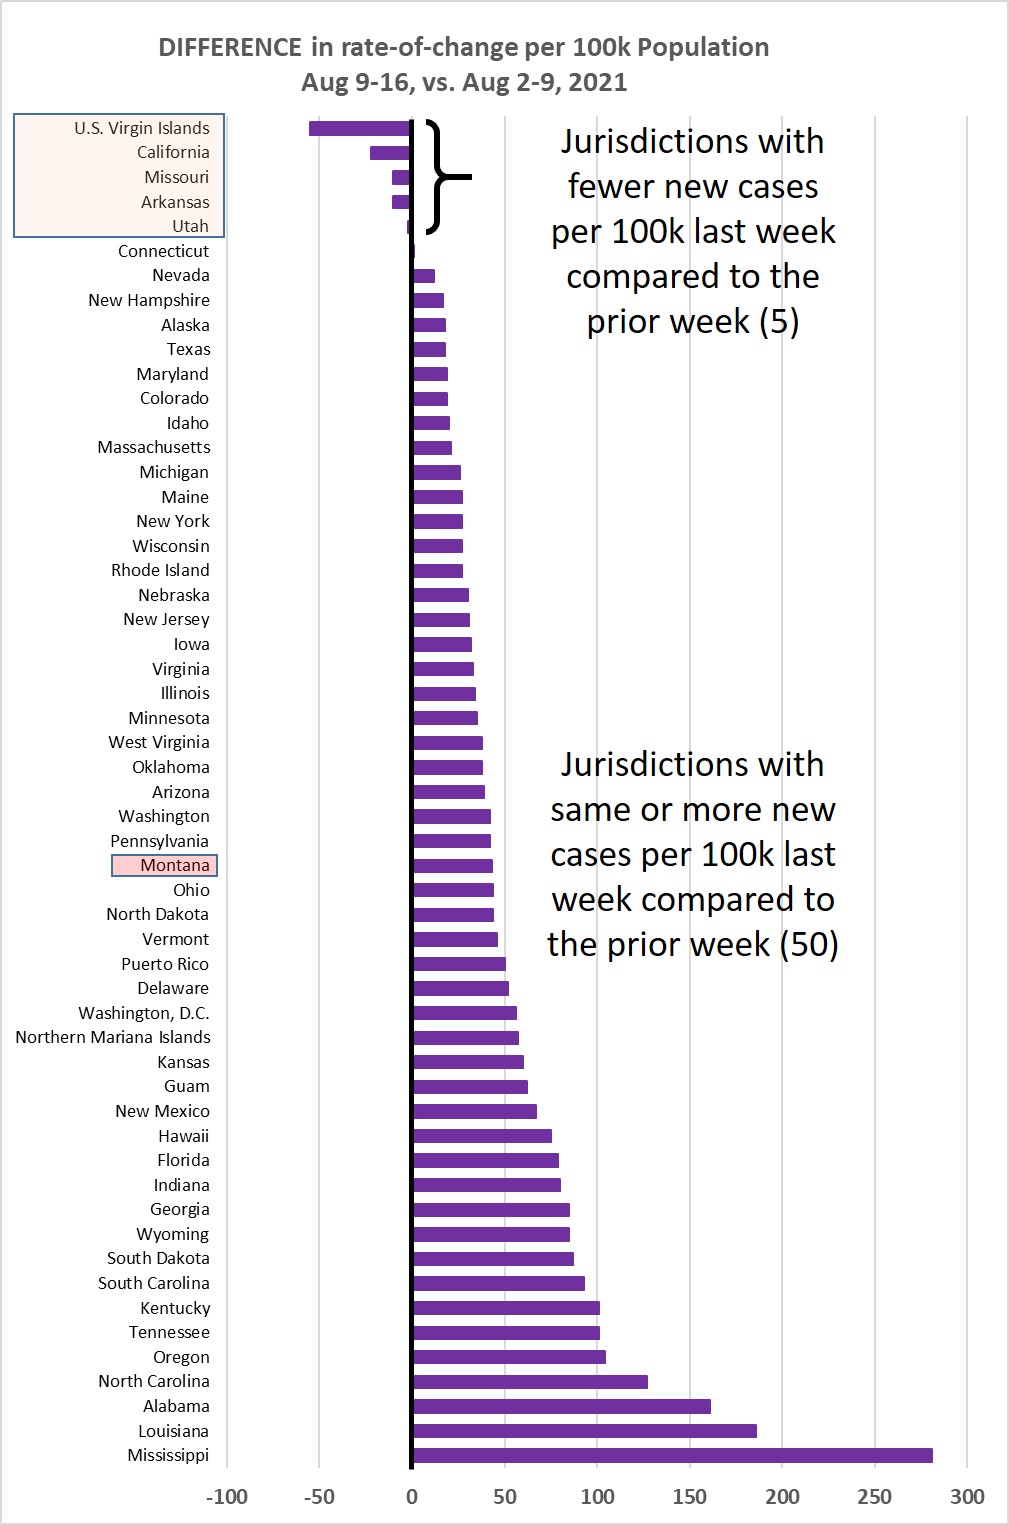
Chart 3 shows the difference in weekly new cases per 100k population for Aug 16-24,
vs. Aug 9-16, 2021. This past week 48/55 jurisdictions (87%) showed the same or higher
rate of new cases.
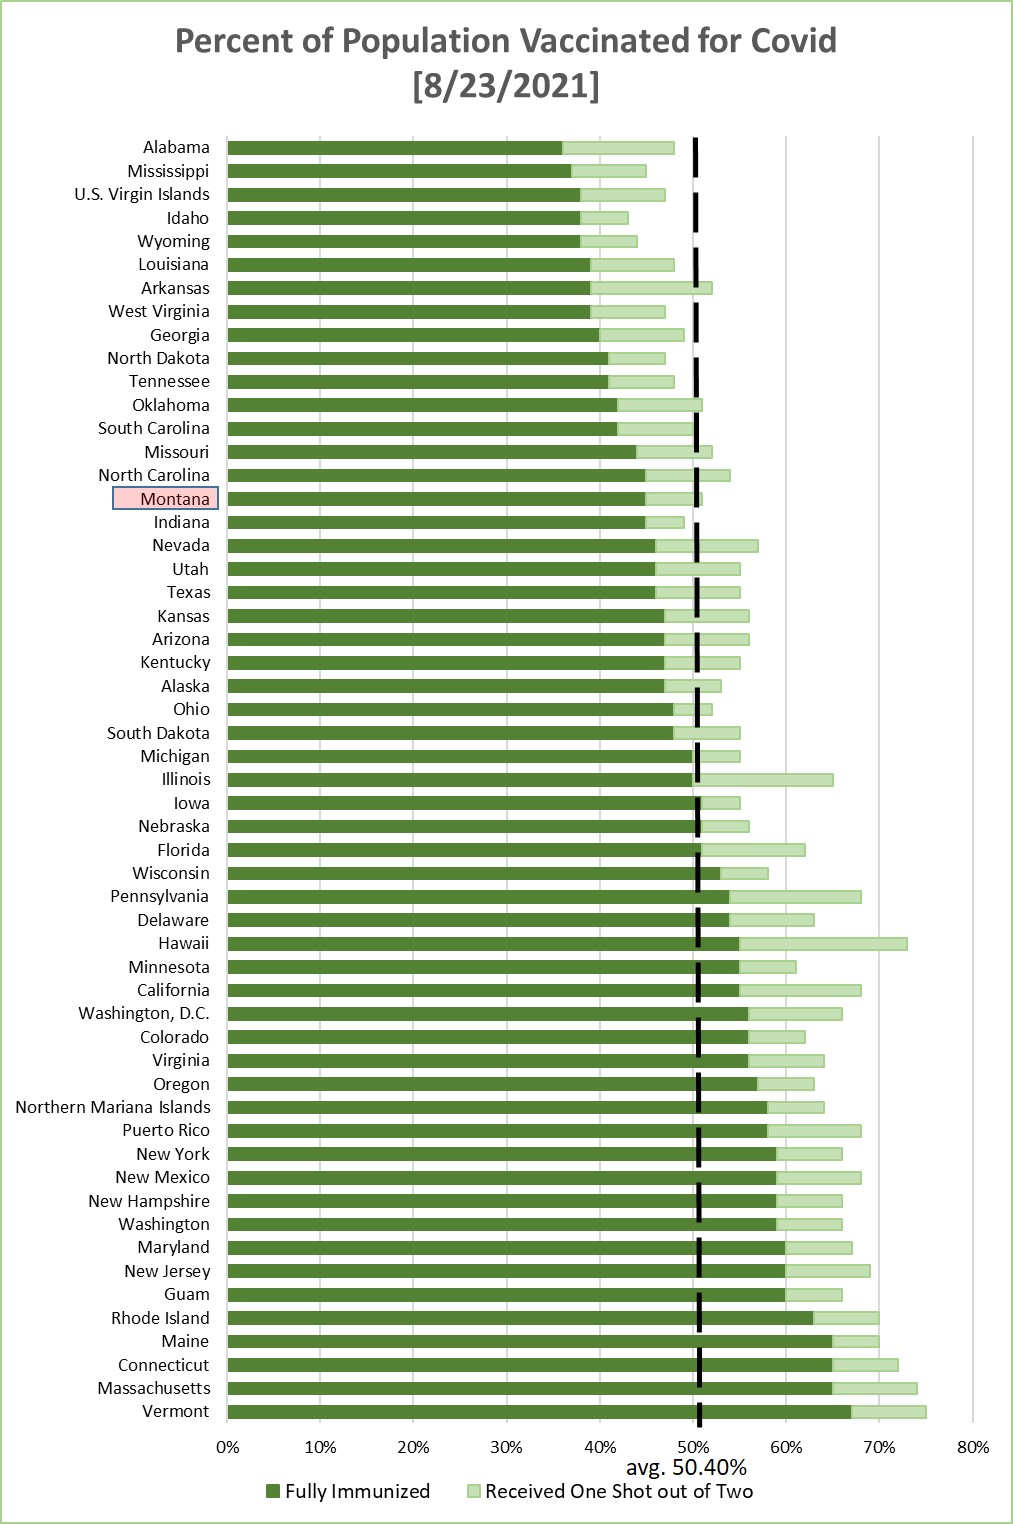
Chart 4 shows the percentage of the population in each jurisdiction having received
1 or 2 Covid-19 vaccination shots. This is sorted by the fraction that have received
2 shots--or one shot of the J&J vaccine. Average across the 55 jurisdictions is now
above 50%: 50.4% being fully immunized--a weekly increase of about 0.62% (weekly increase
the prior week was 0.43%).

Monday, August 16, 2021
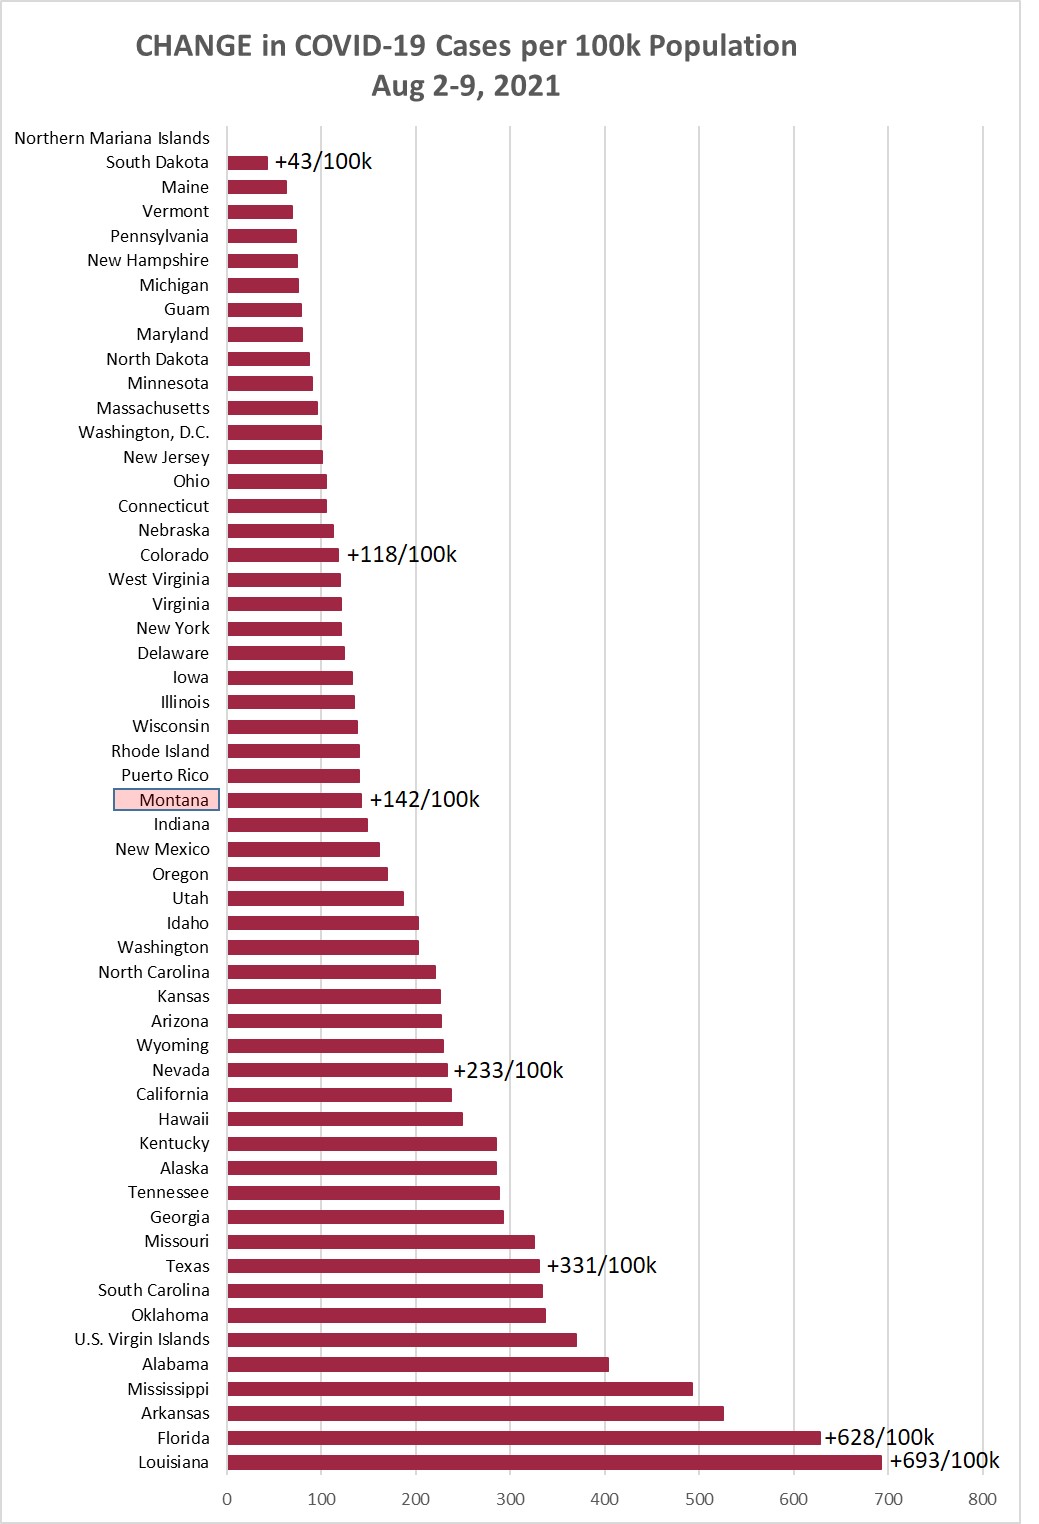
Chart 1 shows the change in cases per 100,000 population as of this morning (August
16, 2021) compared to the cases per 100,000 on August 9, 2021. Montana was up +185/100k
this week, compared to +142/100k the prior week, and +104/100k the week before that.
(A year ago this week Montana had +75/100k.)
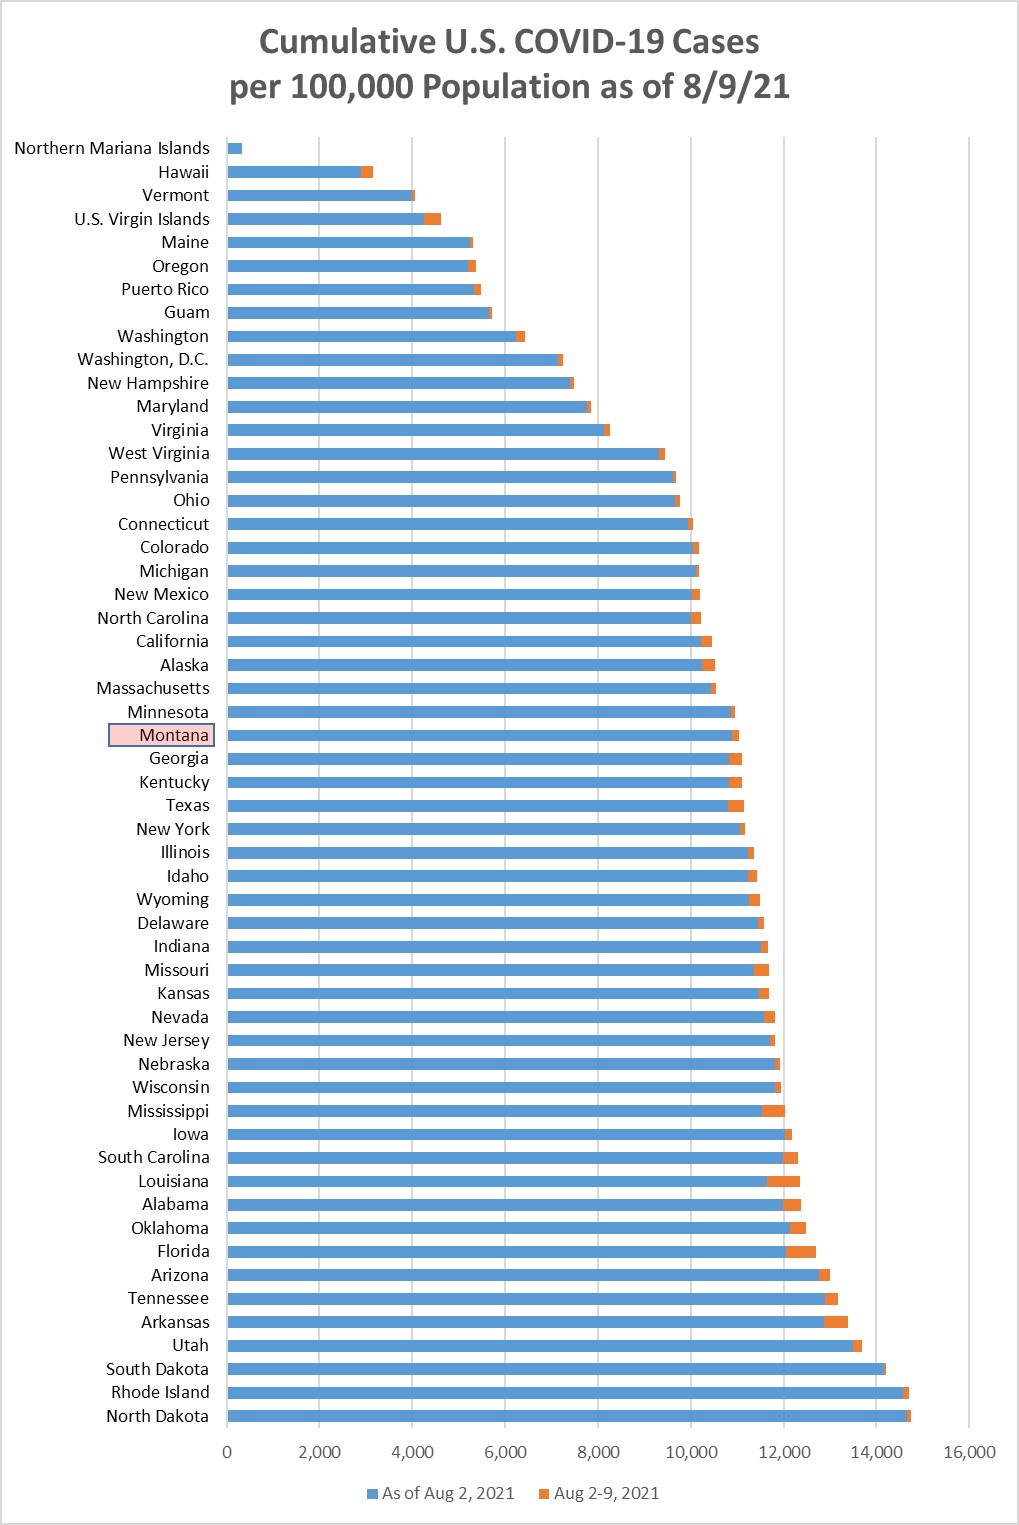
Chart 2 shows the same information as Chart 1, but with the overall cumulative cases
per 100k in each state to August 16. MT is 26/55 (30th highest). Rhode Island and
North Dakota are now tied for the top spot (14.876% of the population has a positive
test at some point).
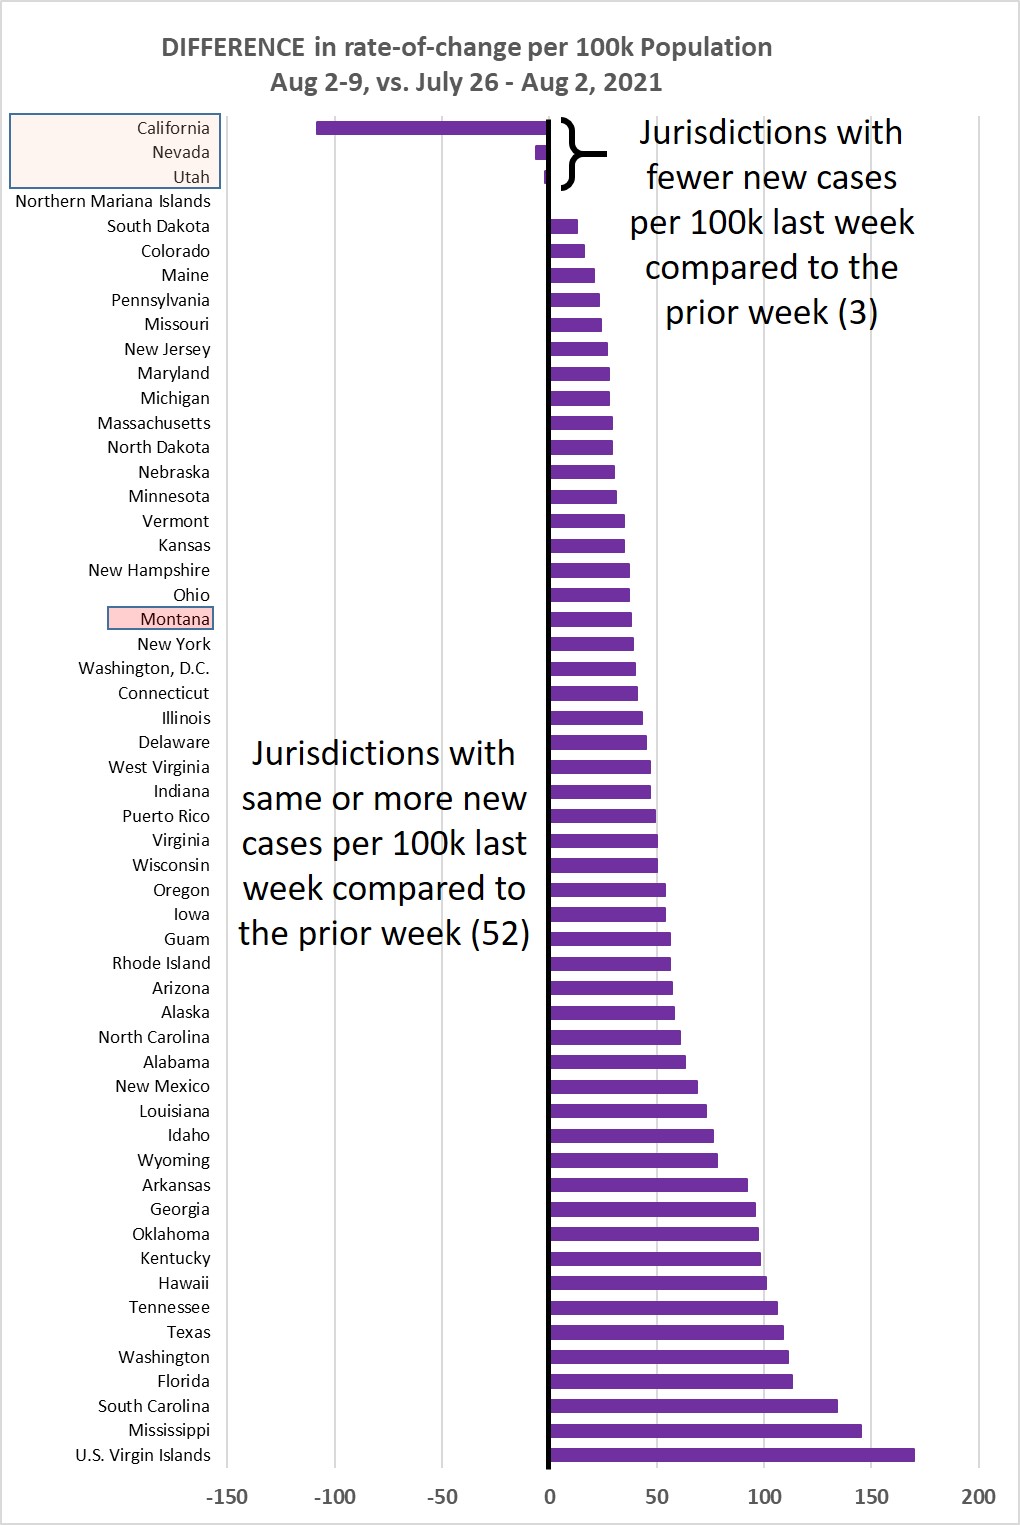
Chart 3 shows the difference in weekly new cases per 100k population for Aug 9-16,
vs. Aug 2-9, 2021. This past week 50/55 jurisdictions (91%) showed the same or higher
rate of new cases.
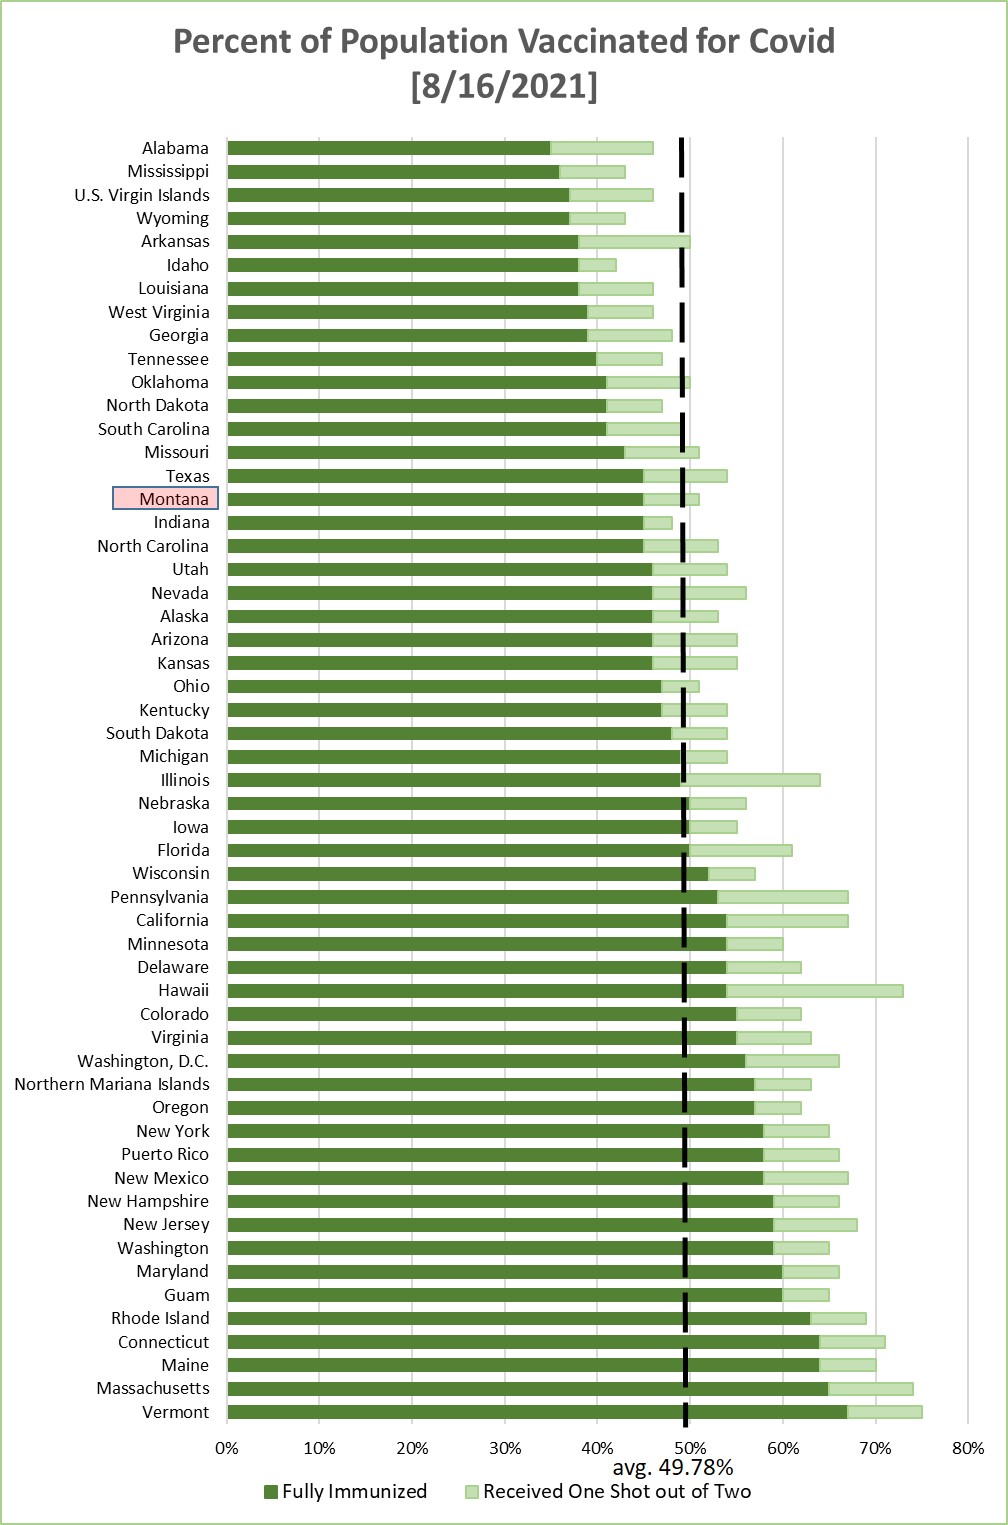
Chart 4 shows the percentage of the population in each jurisdiction having received
1 or 2 Covid-19 vaccination shots. This is sorted by the fraction that have received
2 shots--or one shot of the J&J vaccine. Average across the 55 jurisdictions is 49.78%
being fully immunized--a weekly increase of about 0.43% (weekly increase the prior
week was 0.64%).
Monday, August 9, 2021
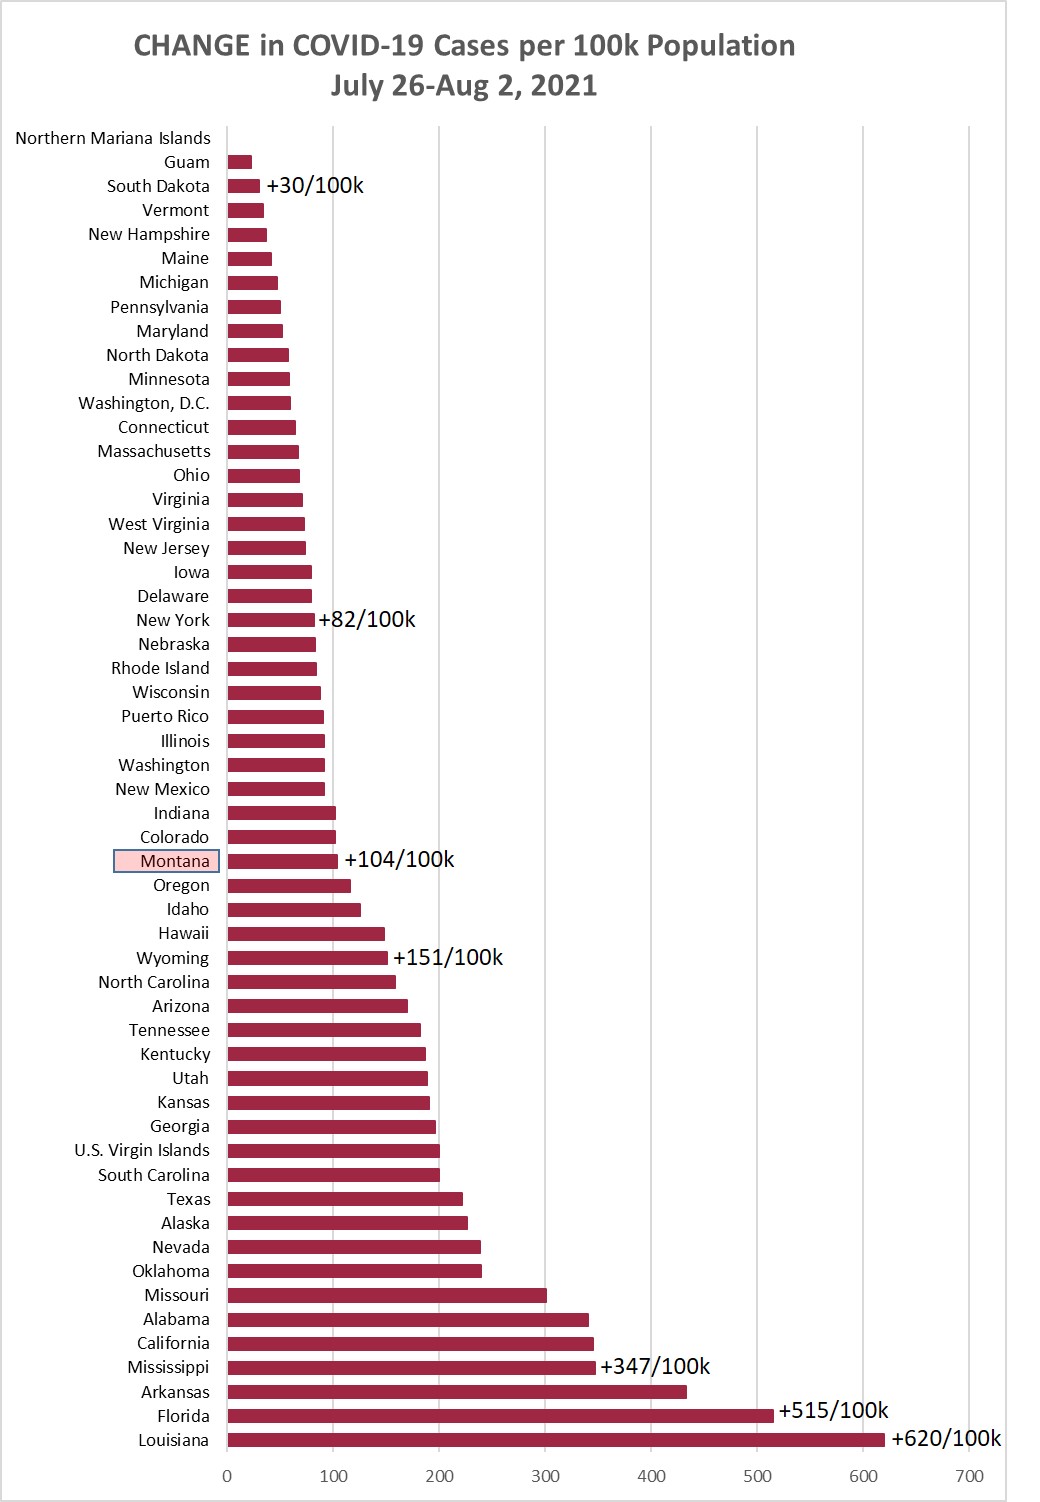
Chart 1 shows the change in cases per 100,000 population as of this morning (August
9, 2021) compared to the cases per 100,000 on August 2, 2021. Montana was up +142/100k
this week, compared to +104/100k the prior week, and +55/100k the week before that.
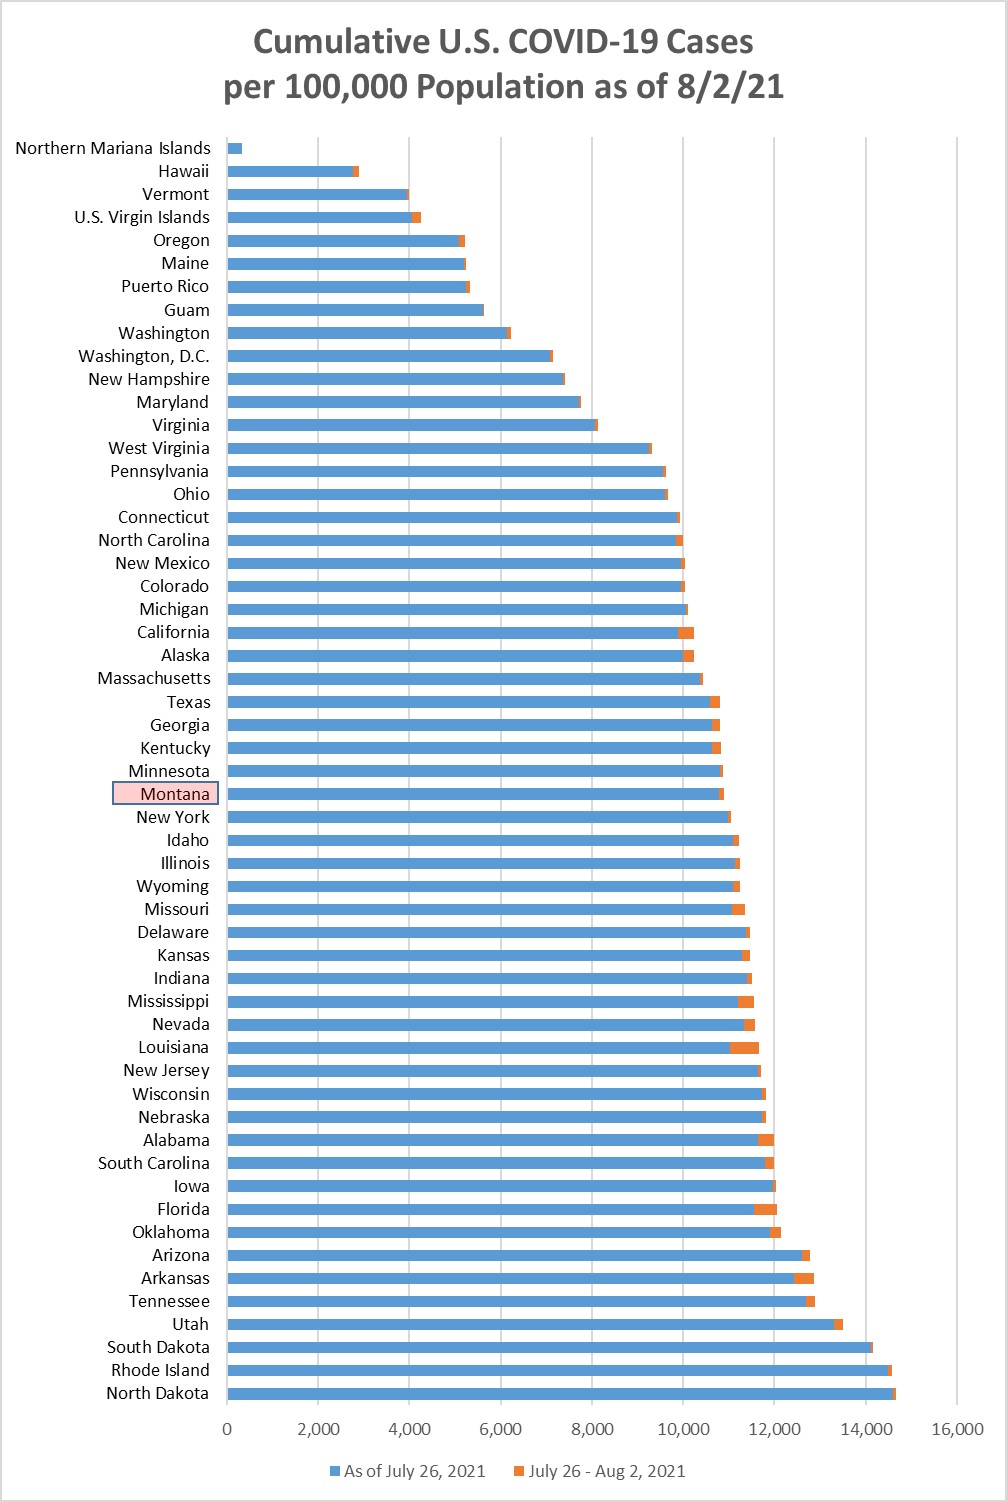
Chart 2 shows the same information as Chart 1, but with the overall cumulative cases
per 100k in each state to August 9. MT is now 26/55 (30th highest), being passed by
Georgia, Kentucky, and Texas.
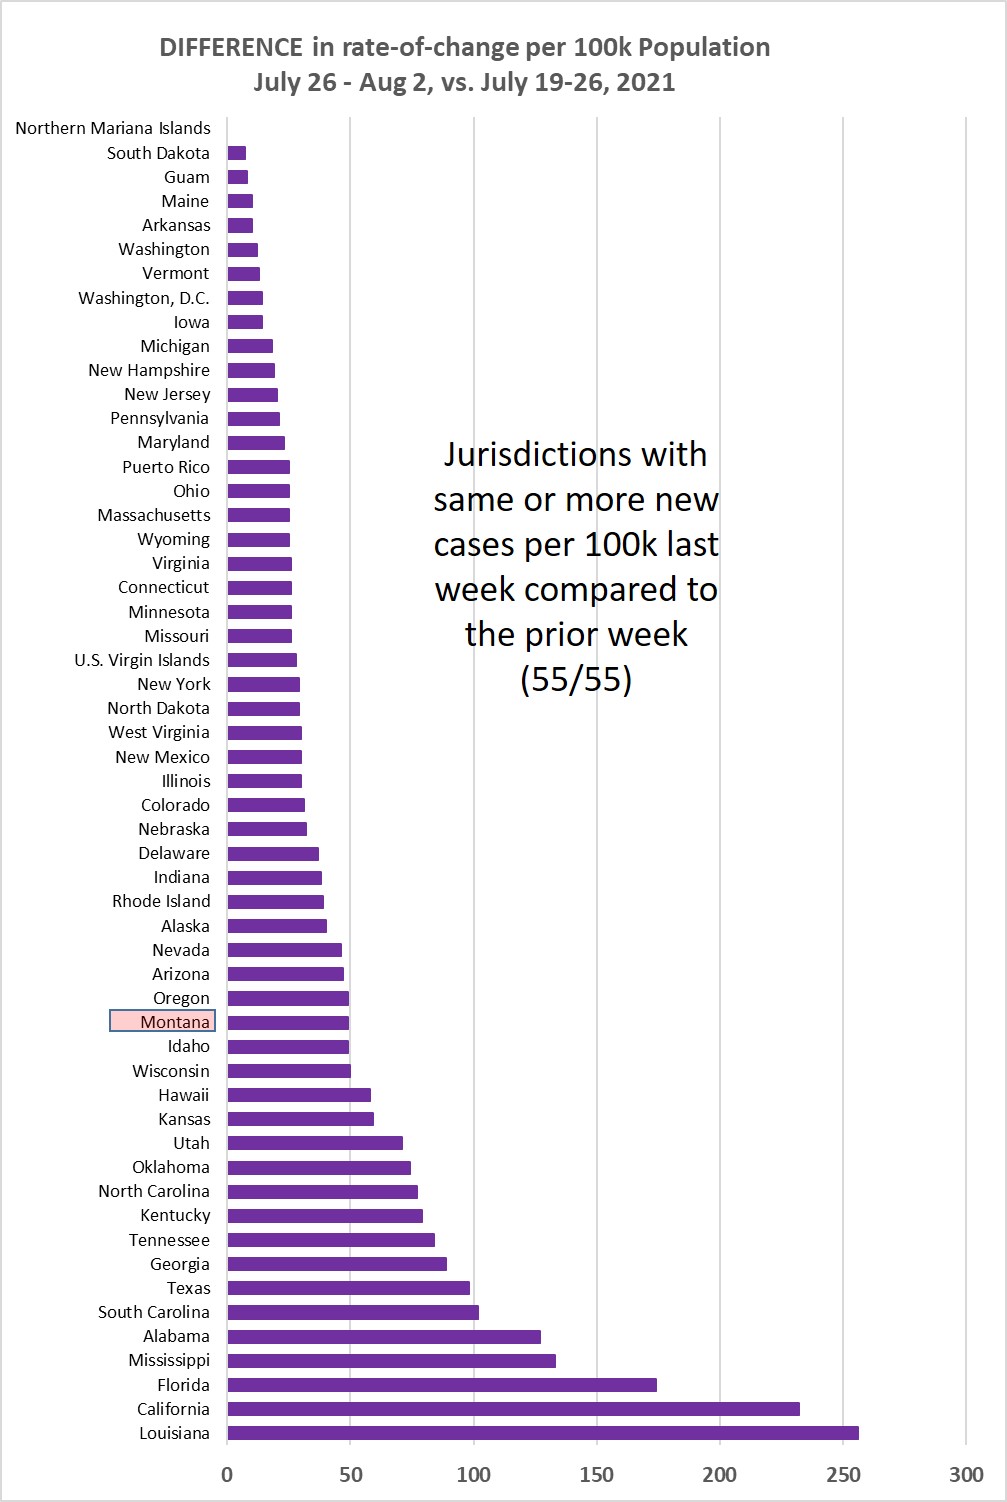
Chart 3 shows the difference in weekly new cases per 100k population for Aug 2-9,
vs. July 26-Aug 2, 2021. This past week 52/55 jurisdictions (95%) showed the same
or higher rate of new cases.
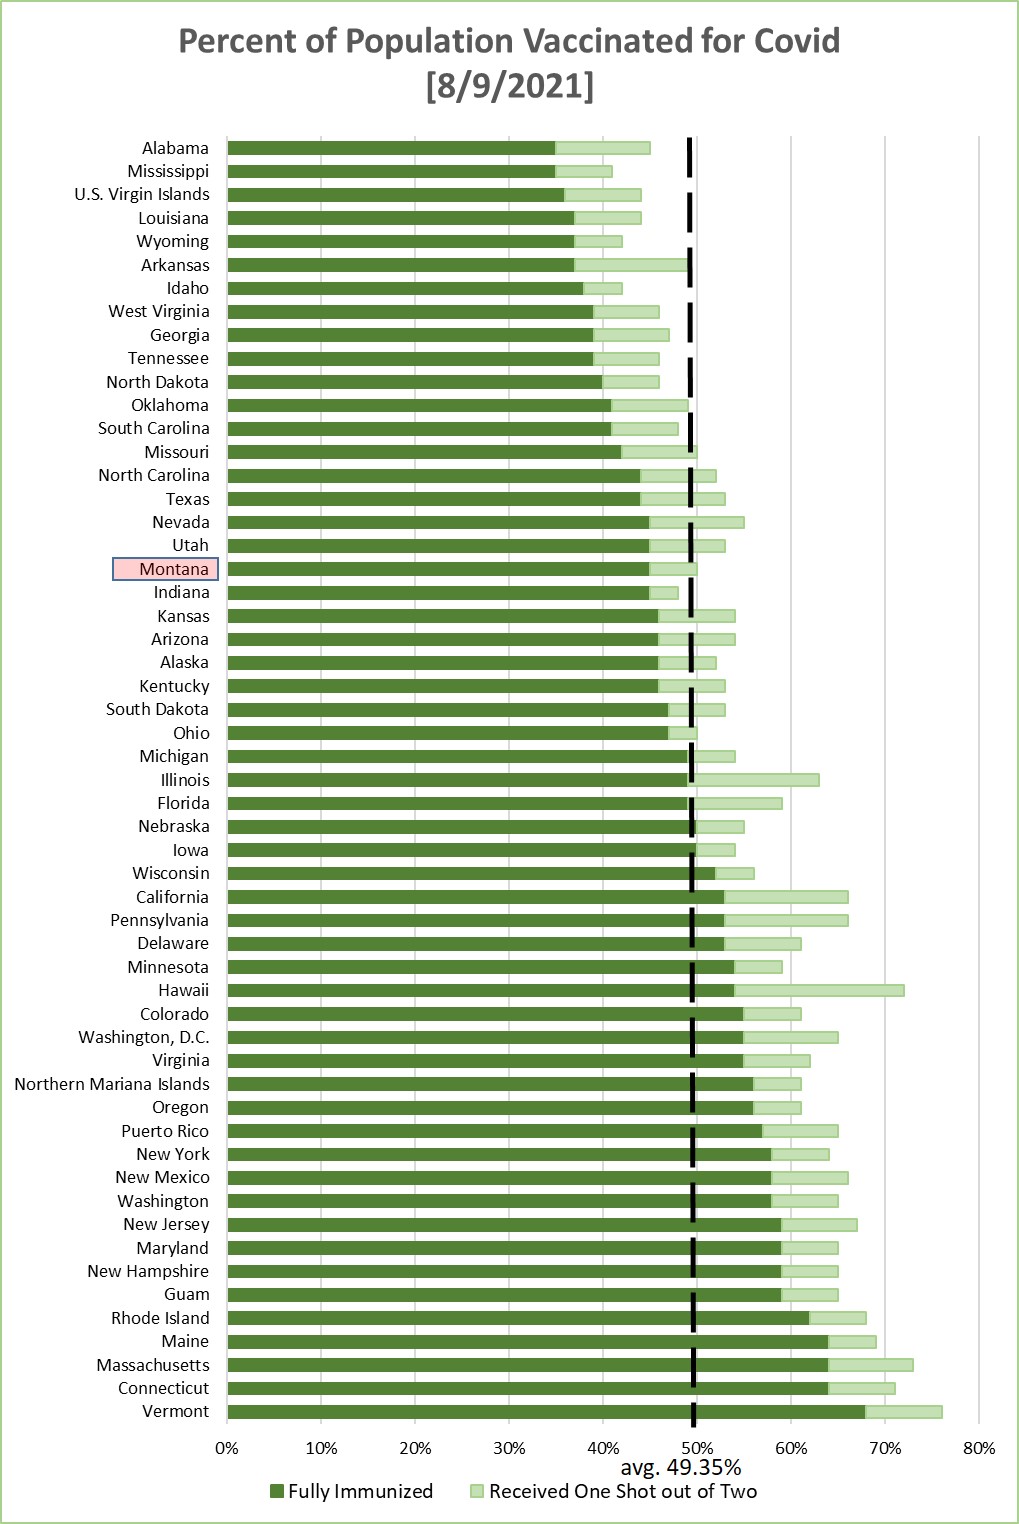
Chart 4 shows the percentage of the population in each jurisdiction having received
1 or 2 Covid-19 vaccination shots. This is sorted by the fraction that have received
2 shots--or one shot of the J&J vaccine. Average across the 55 jurisdictions is 49.35%
being fully immunized--a weekly increase of about 0.64% (weekly increase the prior
week was only 0.36%).
Monday, August 2, 2021
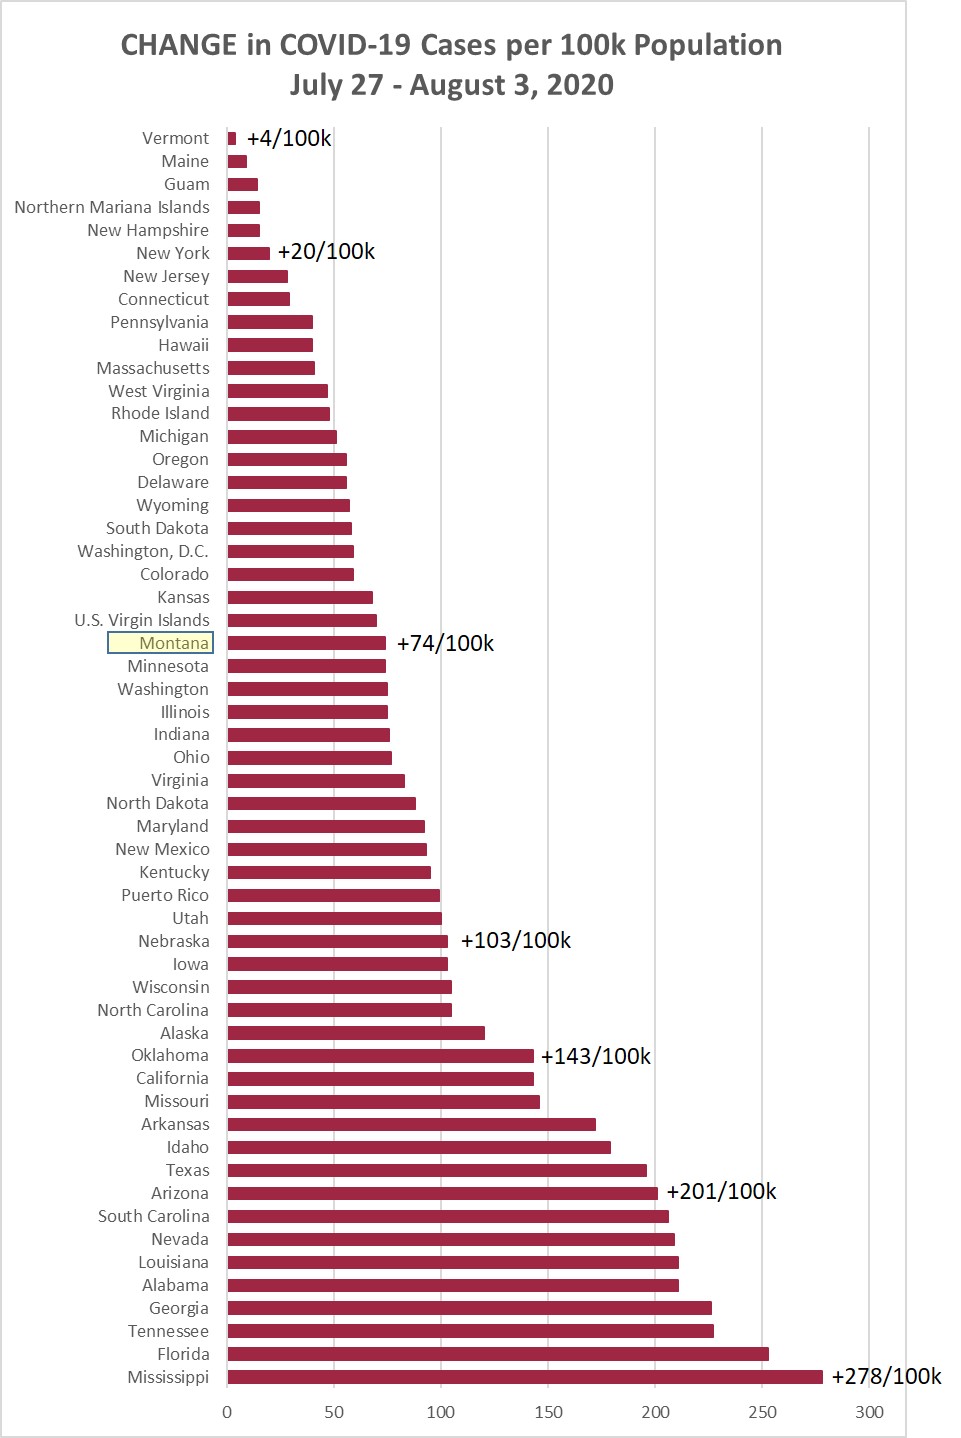
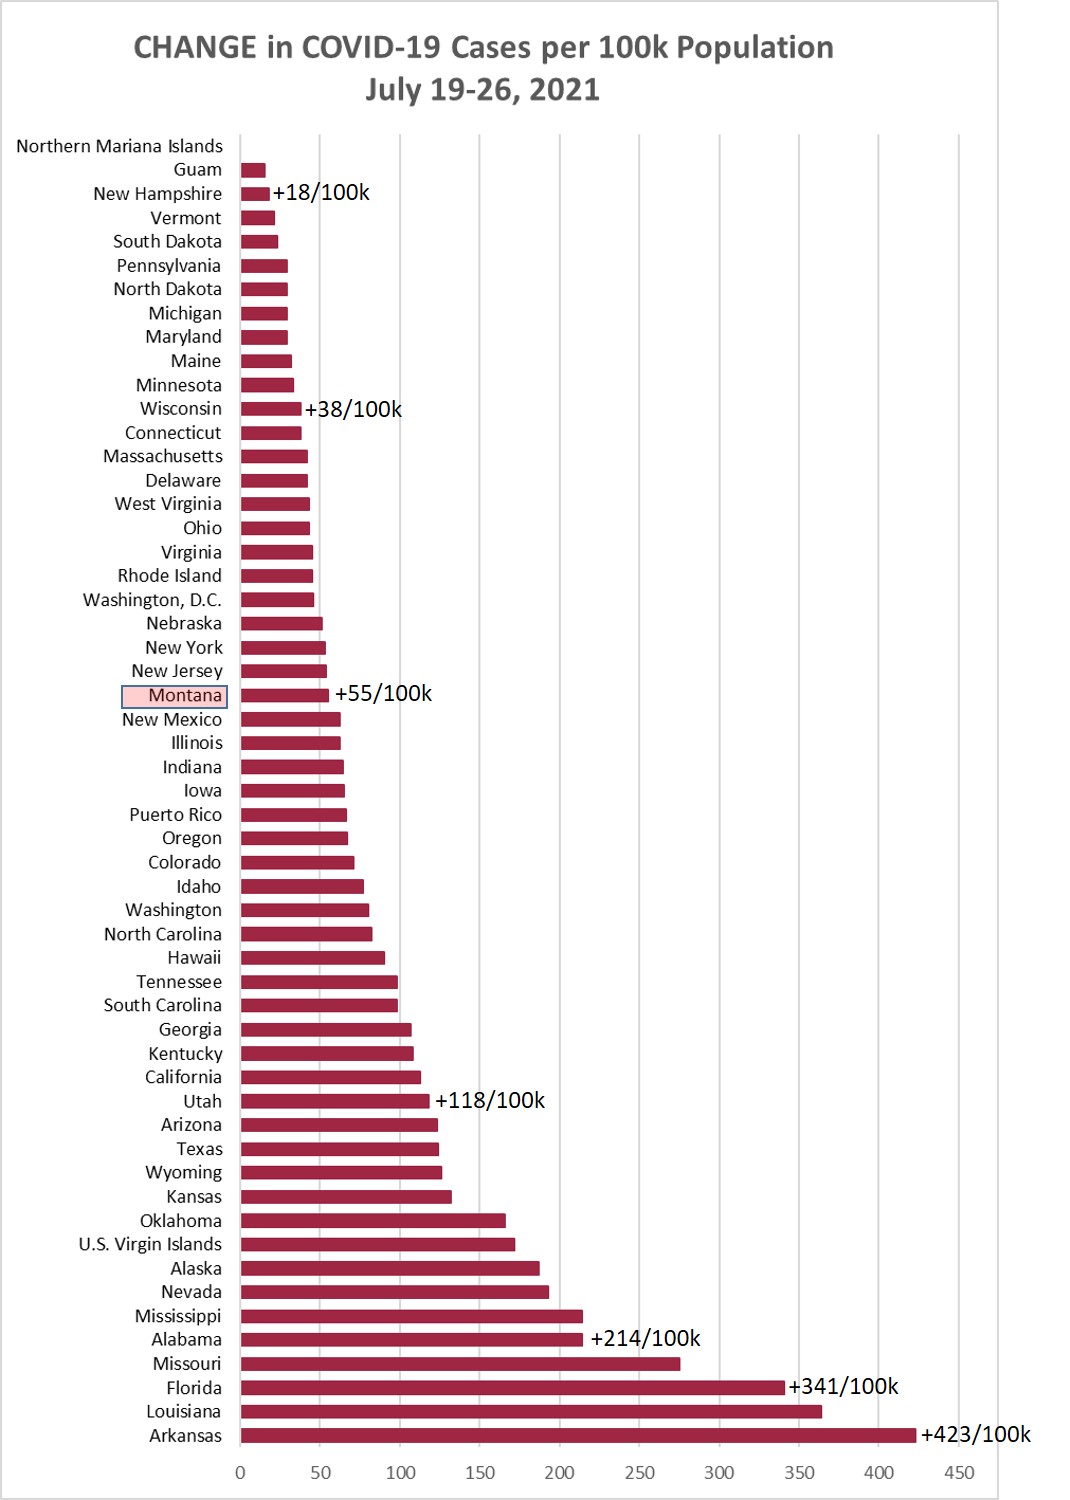
Chart 1 shows the change in cases per 100,000 population as of this morning (August
2, 2021) compared to the cases per 100,000 on July 26, 2021. Montana was up +104/100k
this week, compared to +55/100k the prior week, and +40/100k the week before that.
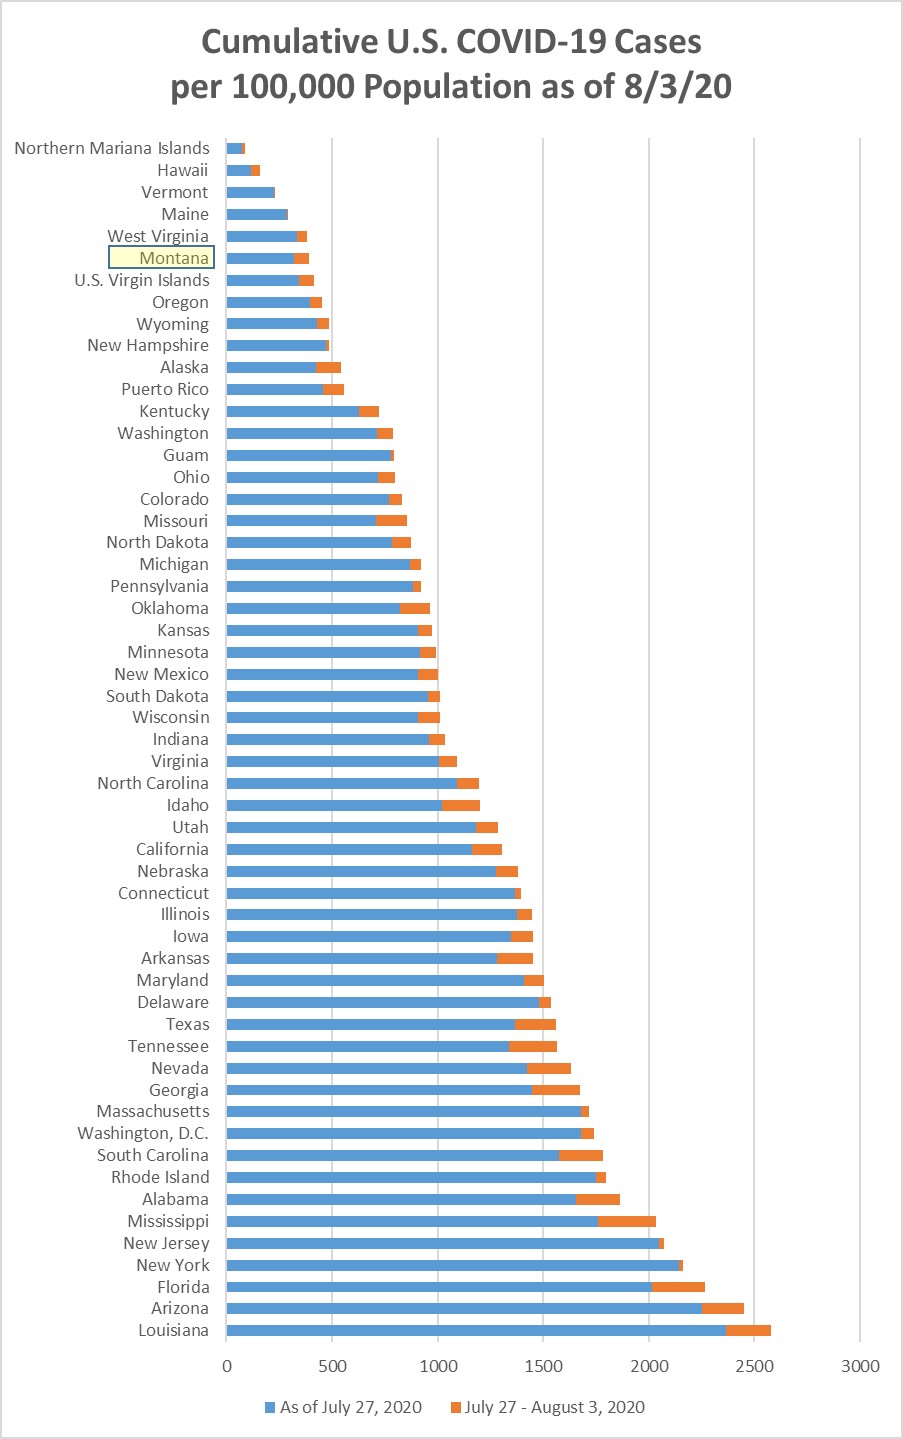
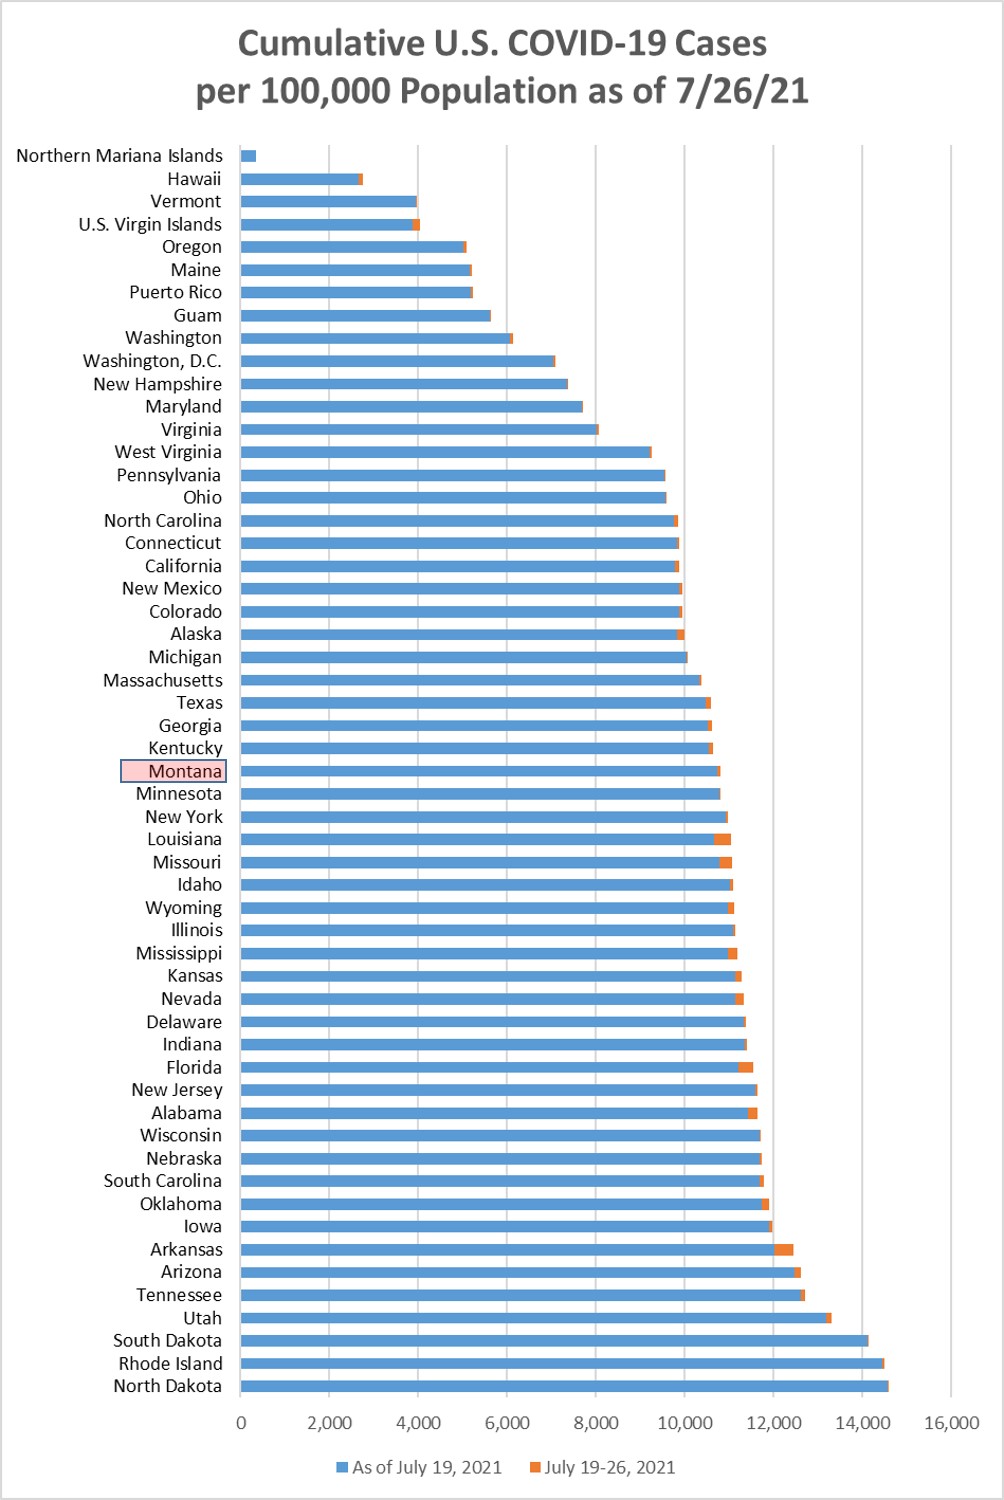
Chart 2 shows the same information as Chart 1, but with the overall cumulative cases
per 100k in each state to August 2. MT is now 29/55 (27th highest), passing Minnesota
this week.
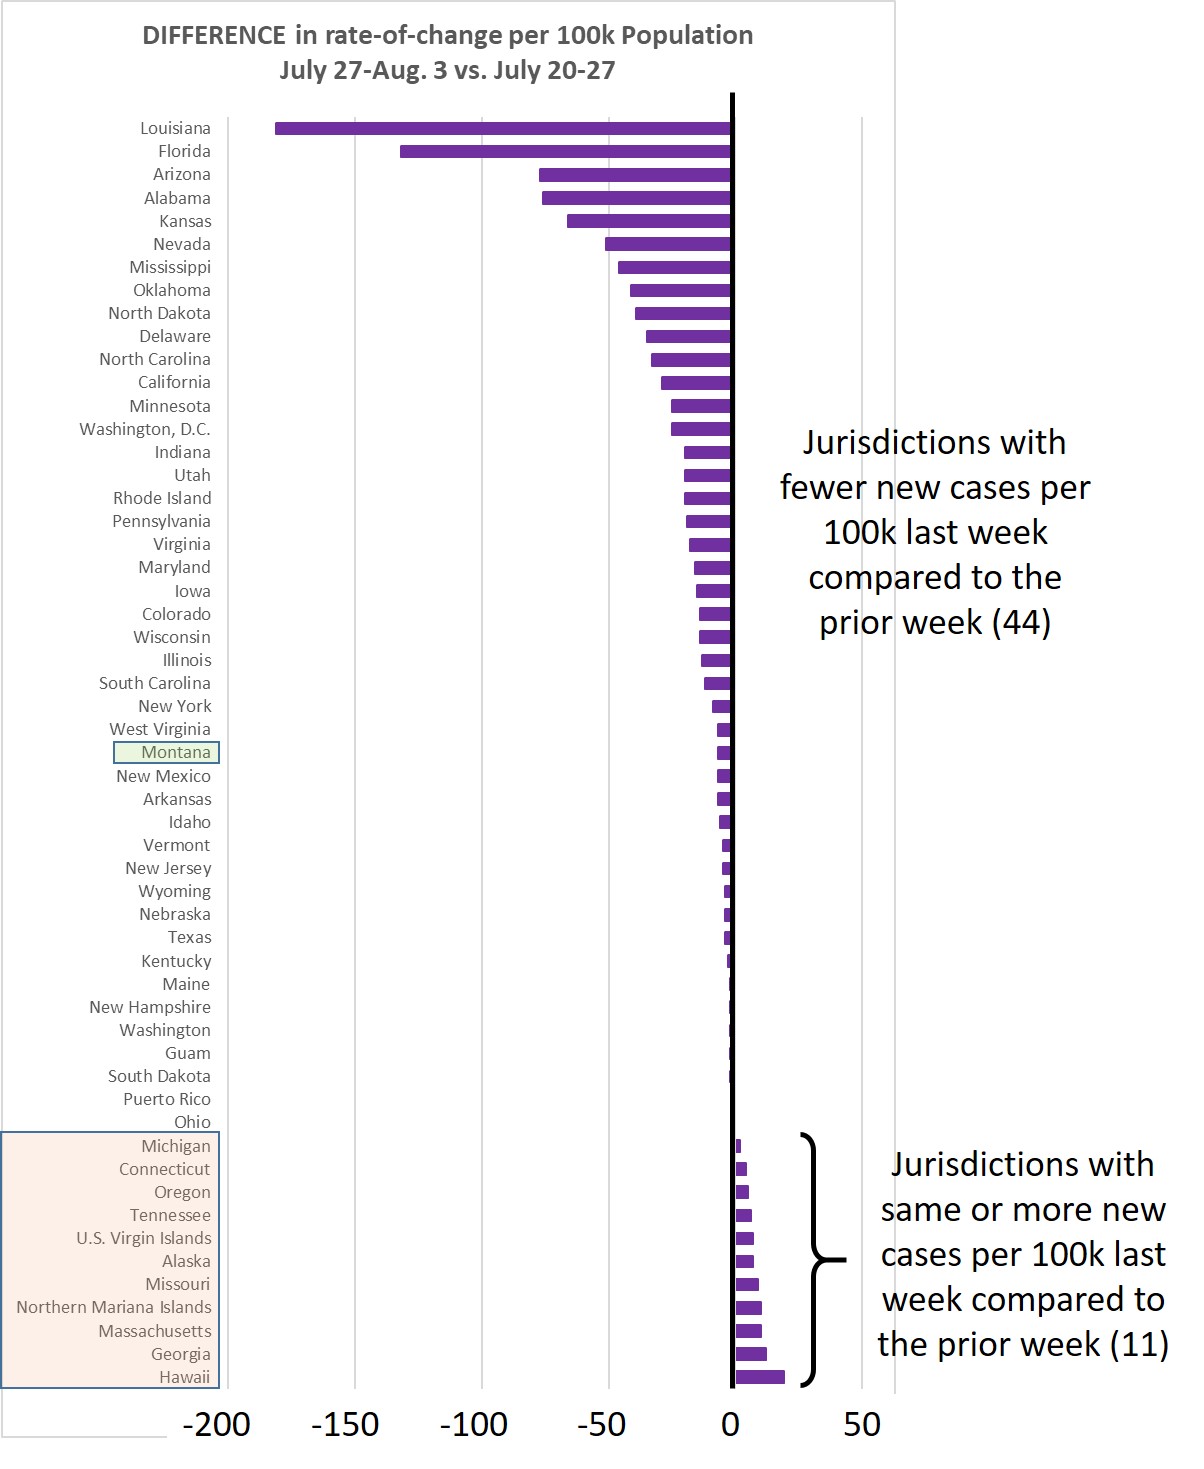
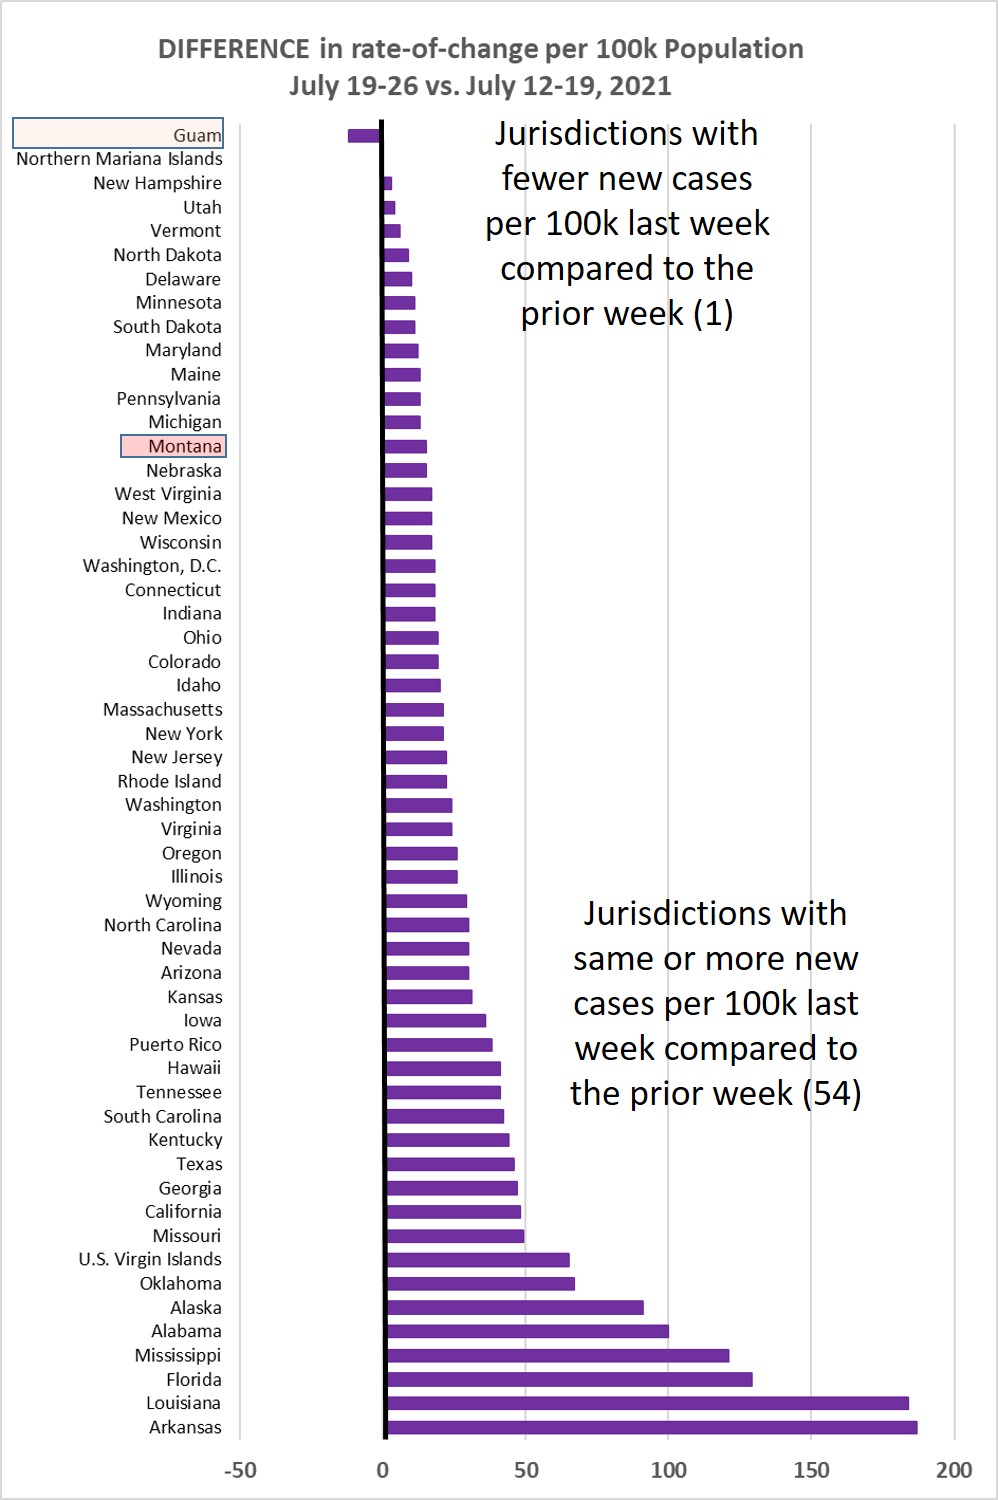
Chart 3 shows the difference in weekly new cases per 100k population for July 26-Aug
2, vs. July 19-26, 2021. This past week all 55/55 jurisdictions (100%) showed the
same or higher rate of new cases.
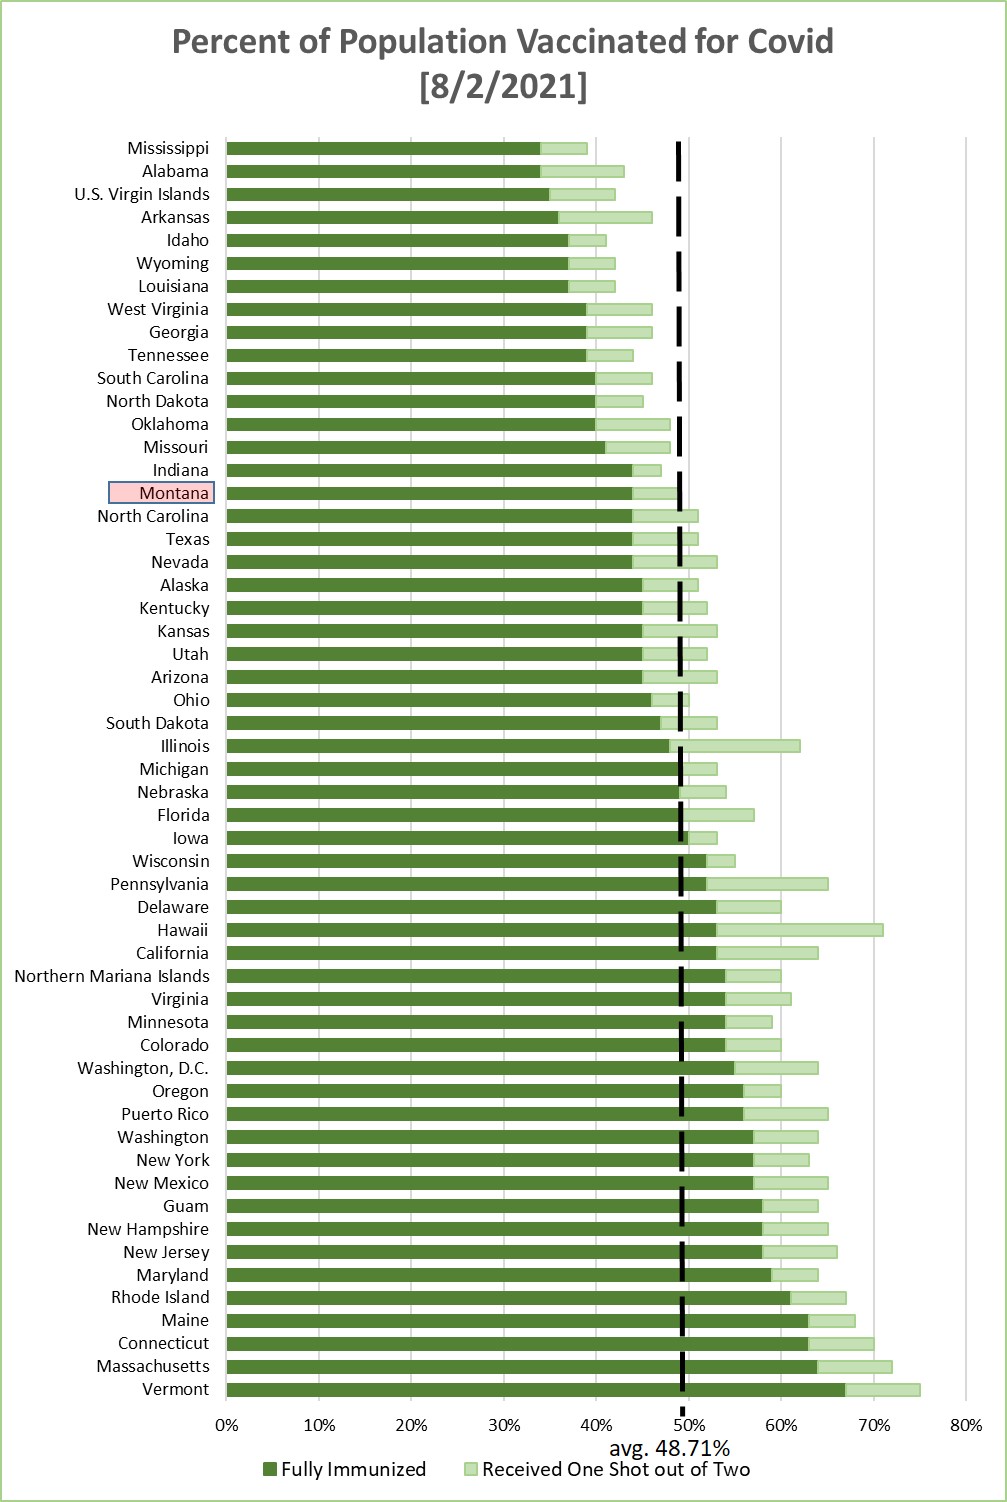
Chart 4 shows the percentage of the population in each jurisdiction having received
1 or 2 Covid-19 vaccination shots. This is sorted by the fraction that have received
2 shots--or one shot of the J&J vaccine. Average across the 55 jurisdictions is 48.71%
being fully immunized--a weekly increase of about 0.36%.
Monday, July 26, 2021
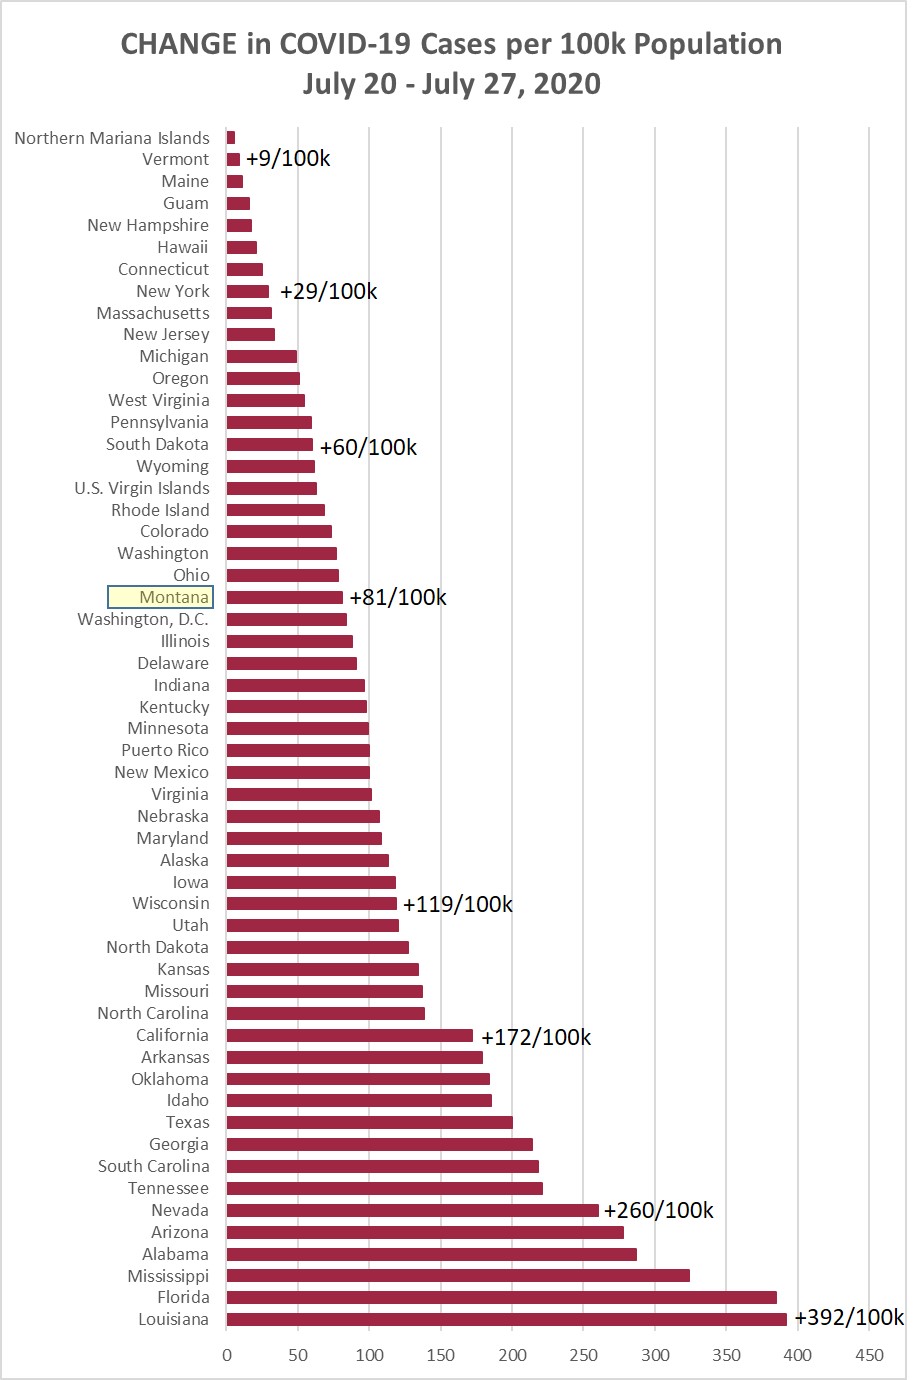
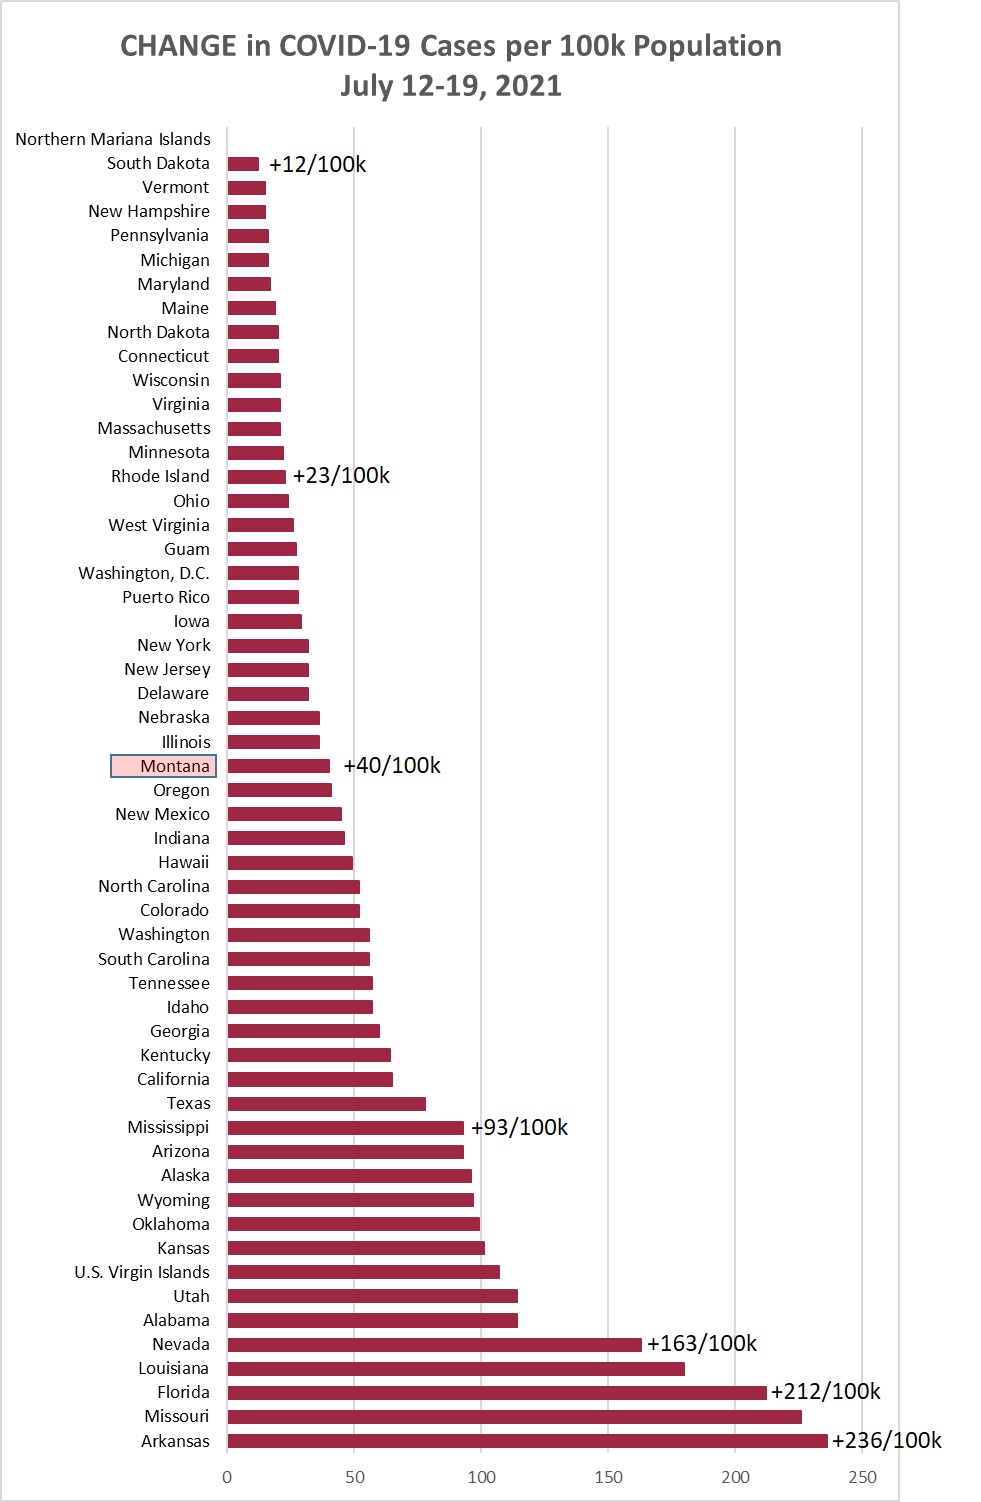
Chart 1 shows the change in cases per 100,000 population as of this morning (July
26, 2021) compared to the cases per 100,000 on July 19, 2021. Montana was up +55/100k
this week, compared to +40/100k the prior week, and +34/100k the week before that.
Chart 2 shows the same information as Chart 1, but with the overall cumulative cases
per 100k in each state to July 26. MT is now 28/55 (26th highest), having been passed
by Louisiana this week.
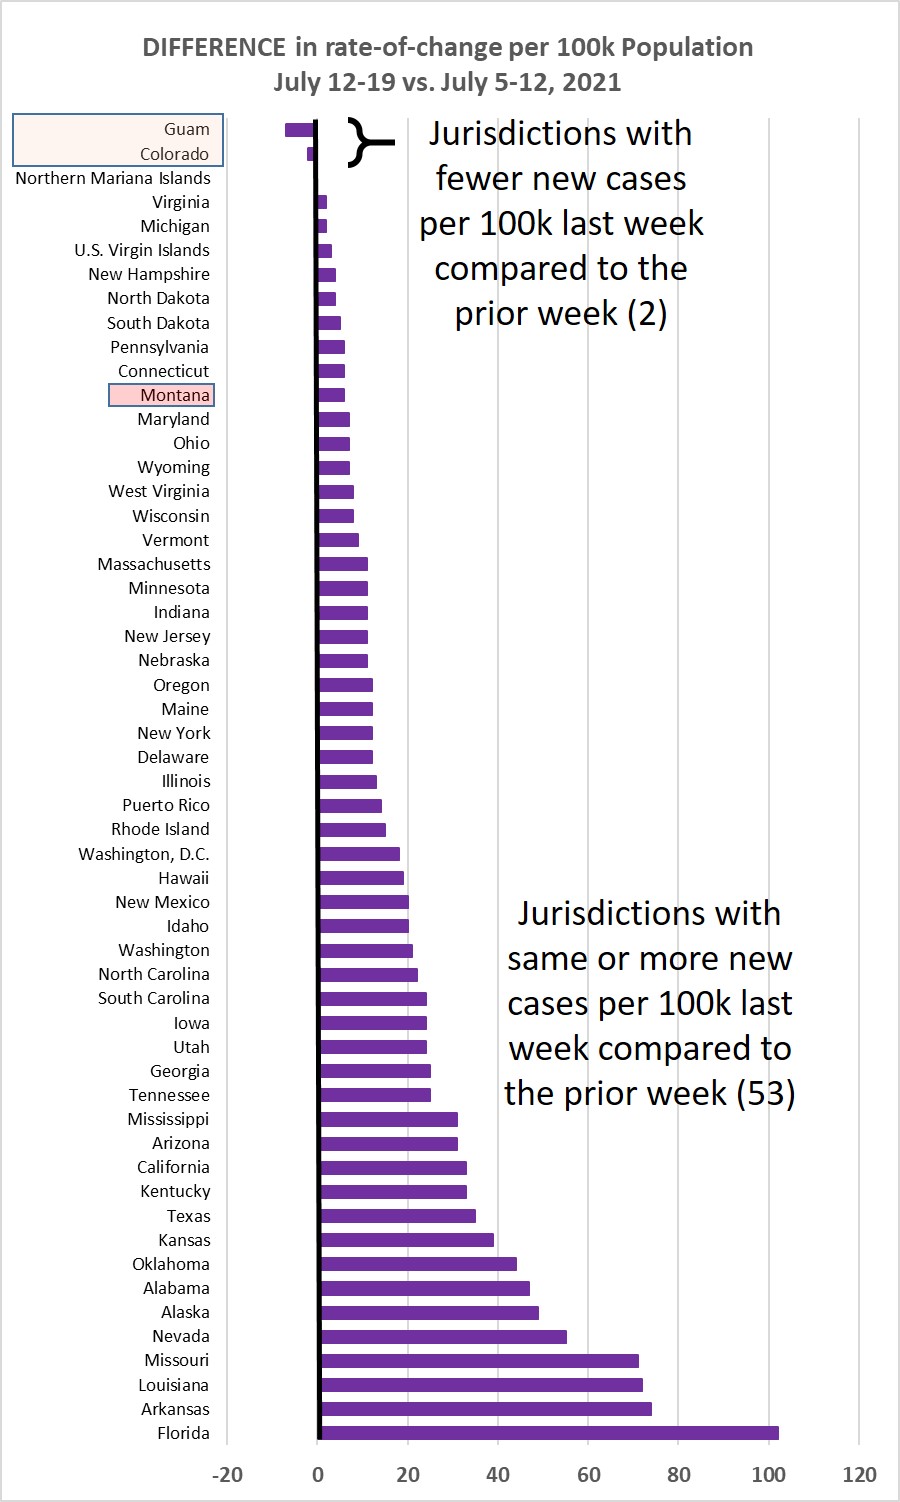
Chart 3 shows the difference in weekly new cases per 100k population for July 19-26,
vs. July 12-19, 2021. This past week 54/55 jurisdictions (98%) showed the same or
higher rate of new cases. Gack.
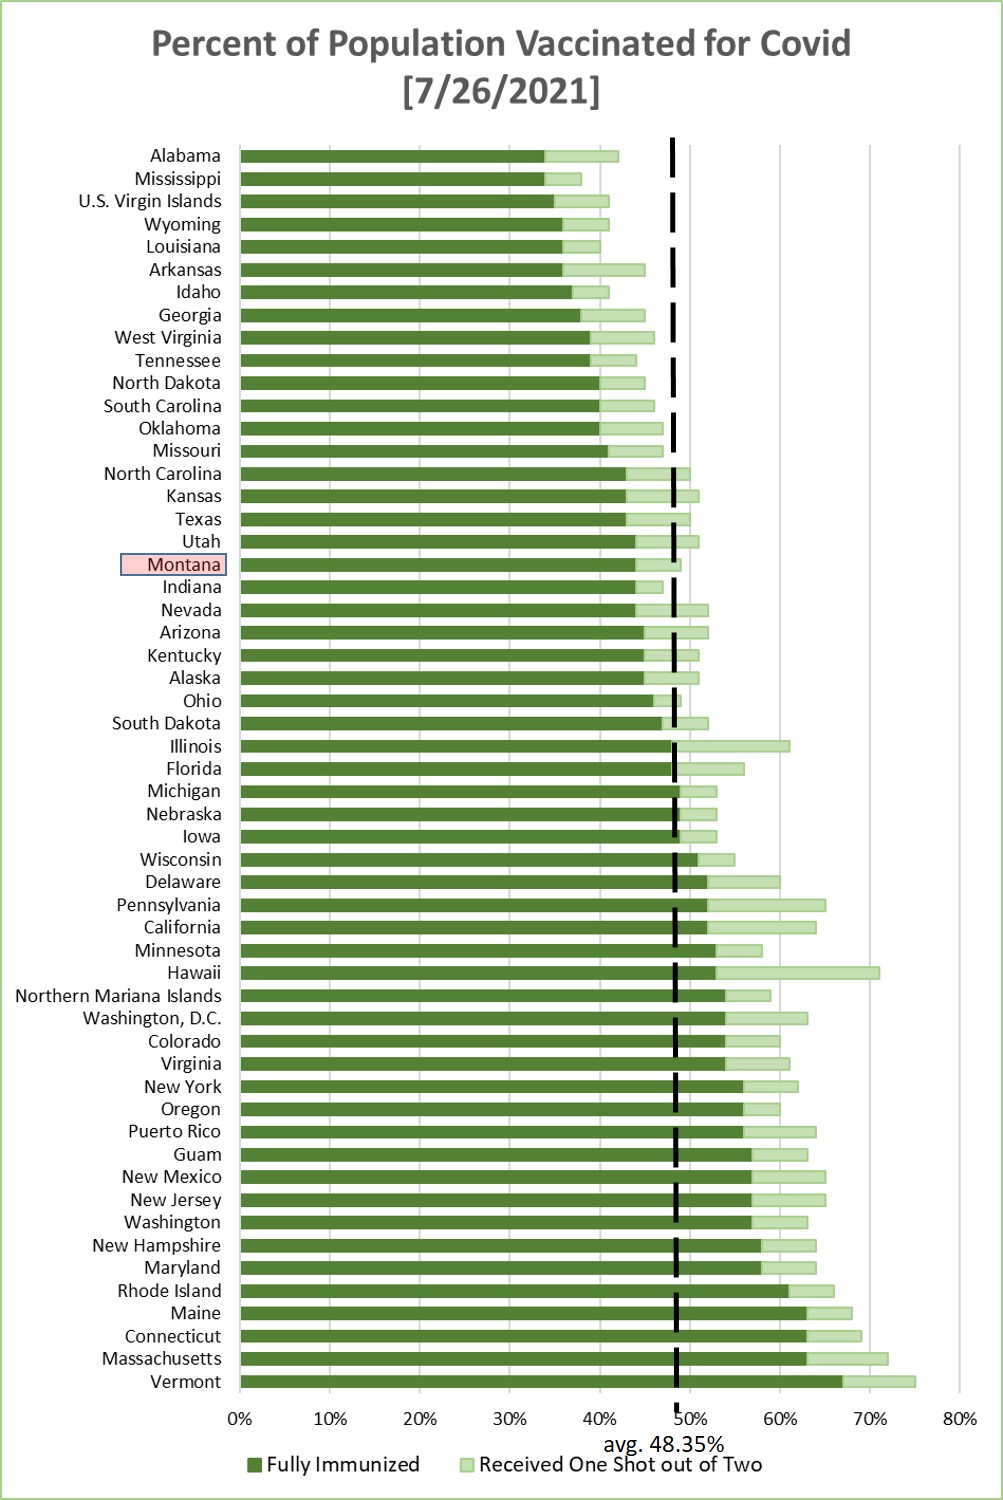
Chart 4 shows the percentage of the population in each jurisdiction having received
1 or 2 Covid-19 vaccination shots. This is sorted by the fraction that have received
2 shots--or one shot of the J&J vaccine. Average across the 55 jurisdictions is 48.35%
being fully immunized--a weekly increase of about 0.44%.
Monday, July 19, 2021
Chart 1 shows the change in cases per 100,000 population as of this morning (July
19, 2021) compared to the cases per 100,000 on July 12, 2021. Montana was up +40/100k
this week, compared to +34/100k the prior week, and +33/100k the week before that.
Chart 2 shows the same information as Chart 1, but with the overall cumulative cases
per 100k in each state to July 19. MT is now 29/55 (27th highest), having been passed
by Missouri this week.
Chart 3 shows the difference in weekly new cases per 100k population for July 12-19,
vs. July 5-12, 2021. This past week 53/55 jurisdictions (96% !!) showed the same or
higher rate of new cases. Going the wrong way, folks.
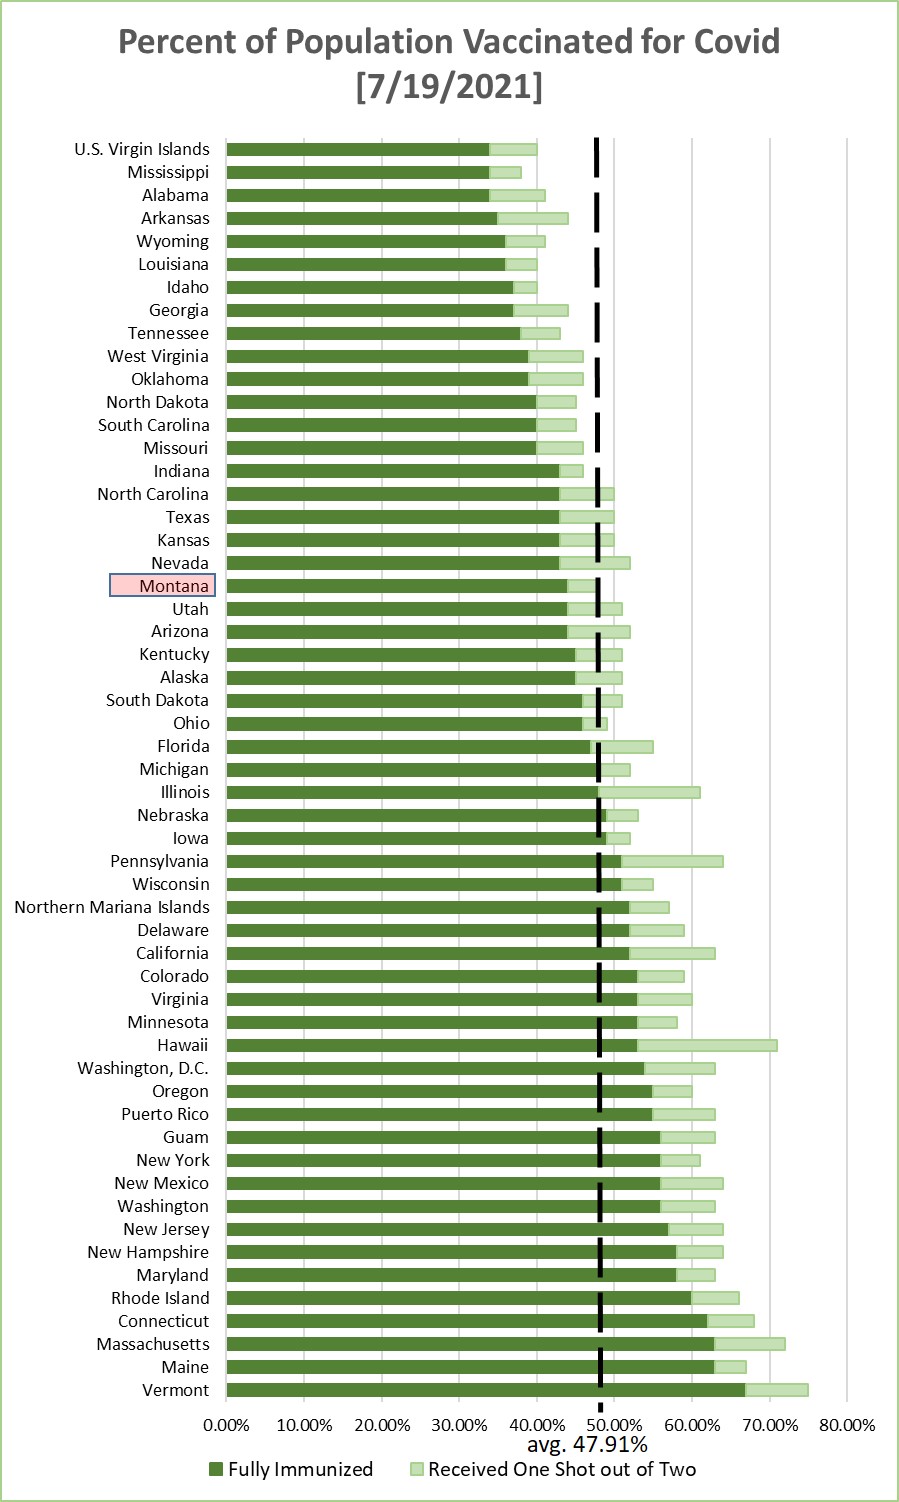
Chart 4 shows the percentage of the population in each jurisdiction having received
1 or 2 Covid-19 vaccination shots. This is sorted by the fraction that have received
2 shots--or one shot of the J&J vaccine. Average across the 55 jurisdictions is 47.91%
being fully immunized--a weekly increase of about 0.64%.

Monday, July 12, 2021
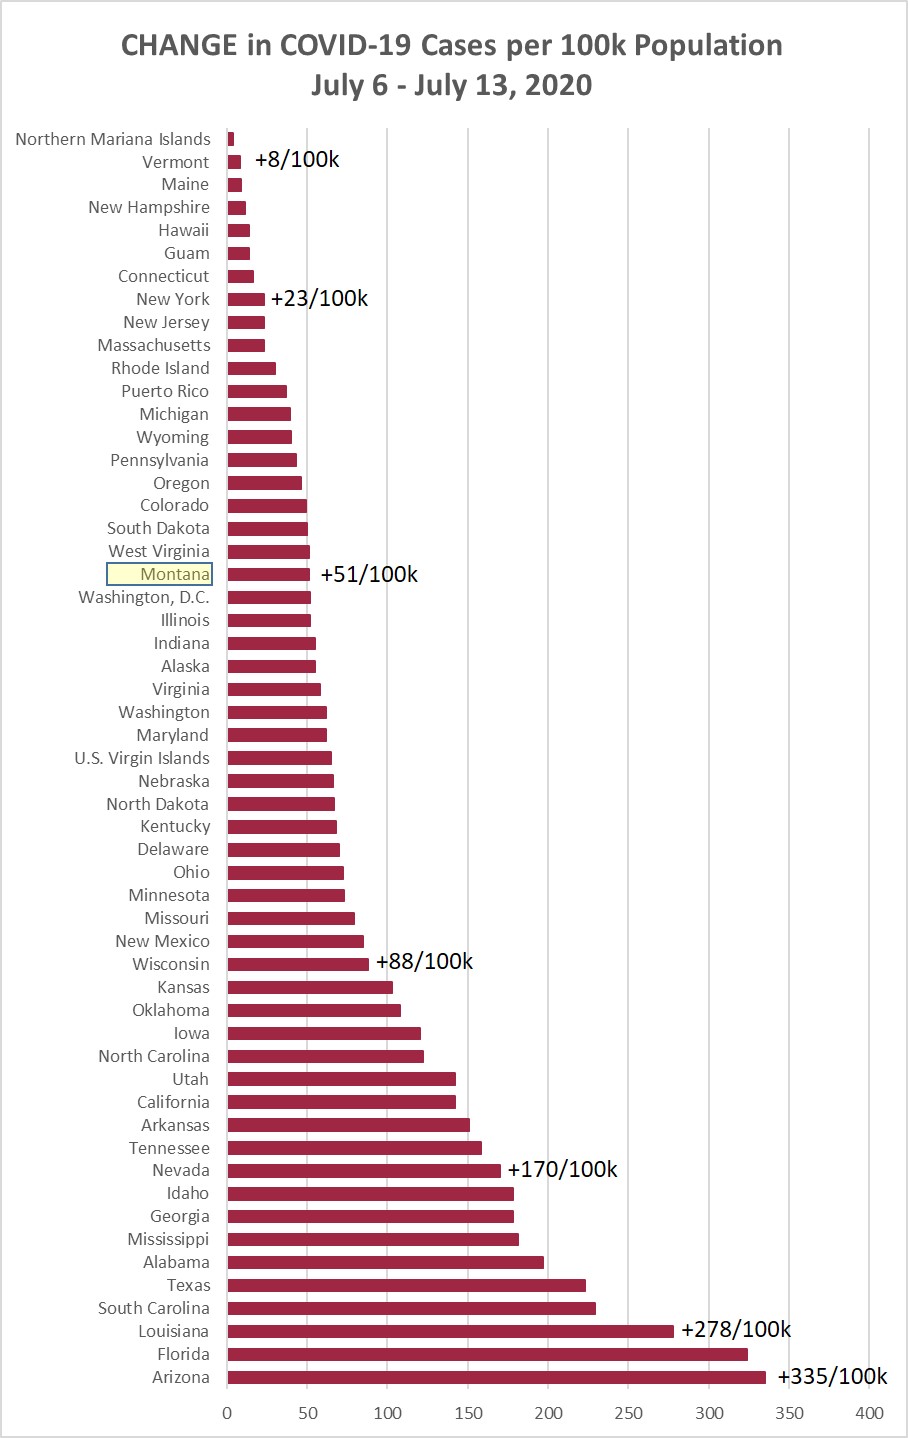
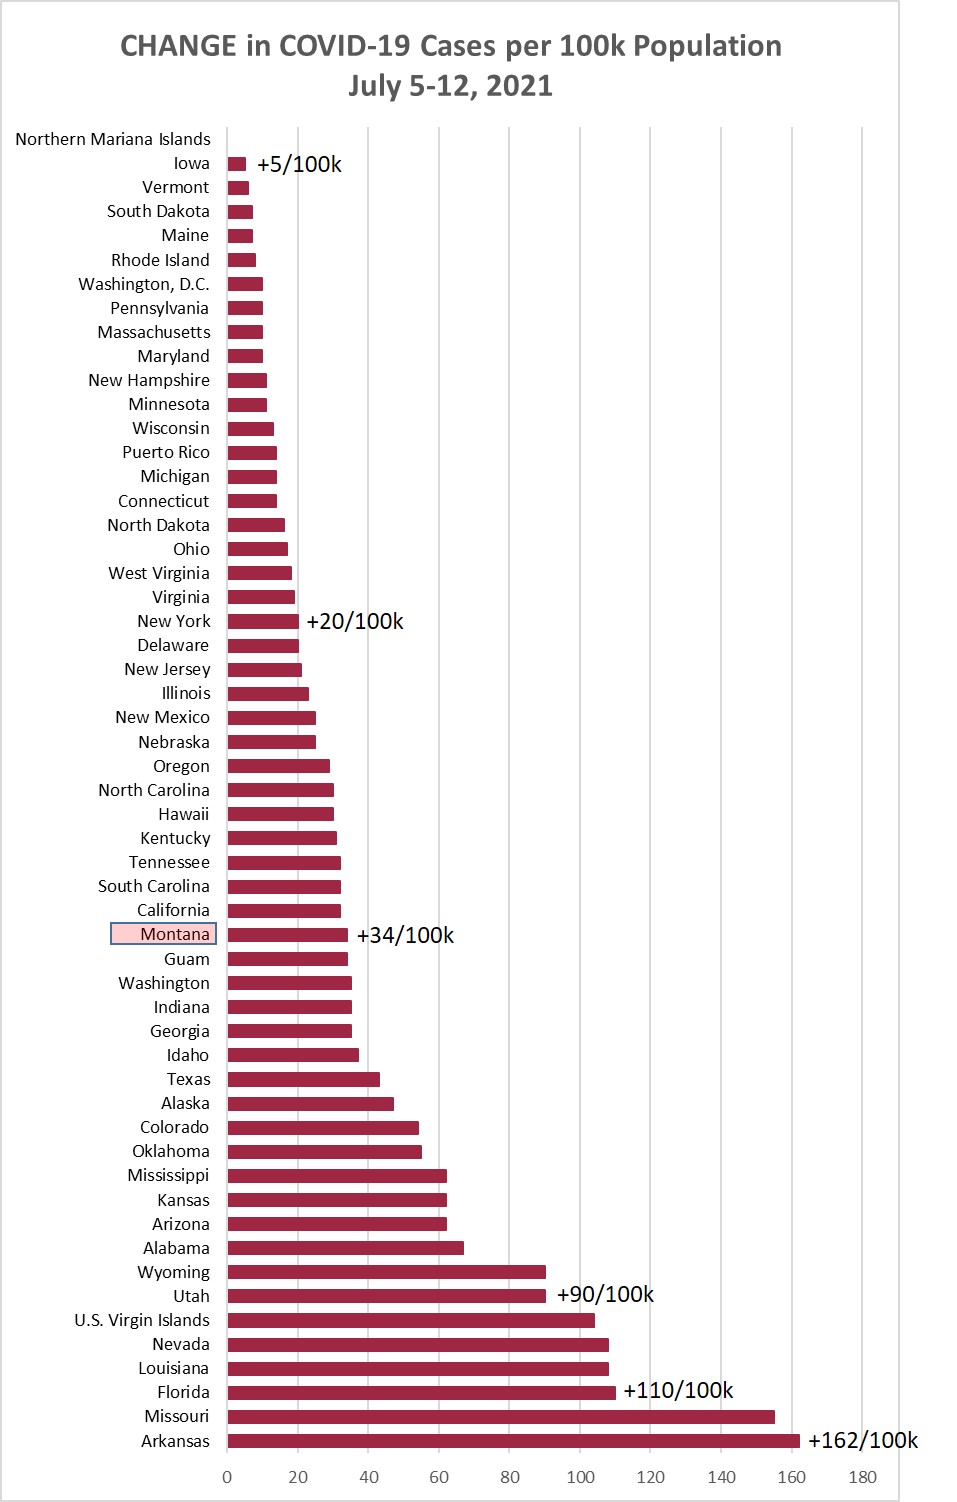
Chart 1 shows the change in cases per 100,000 population as of this morning (July
12, 2021) compared to the cases per 100,000 on July 5, 2021. Montana was up +34/100k
this week, compared to +33/100k the prior week, and +33/100k the week before that.
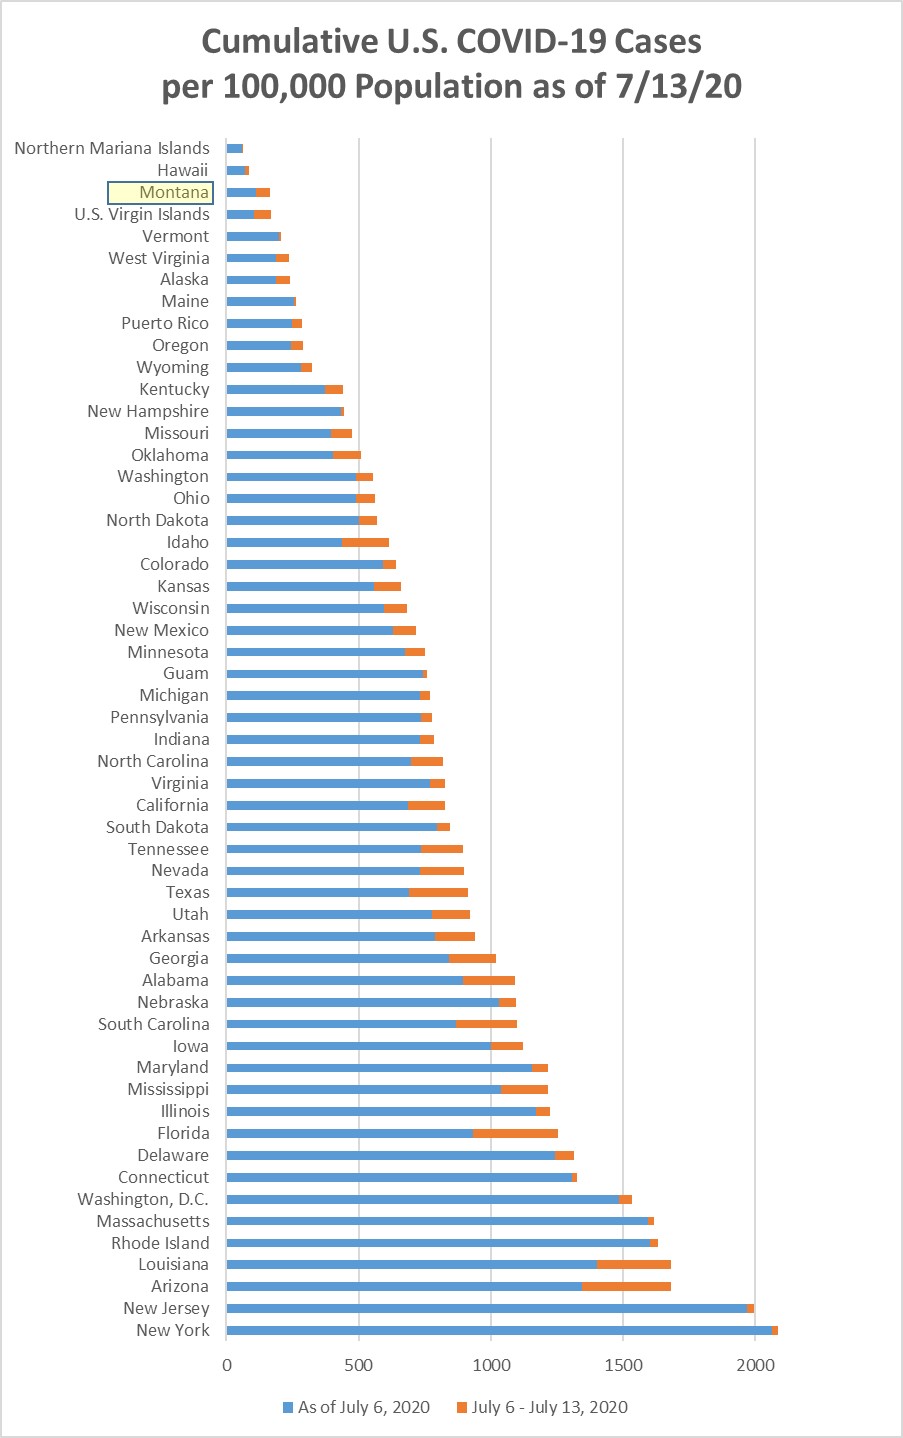
Chart 2 shows the same information as Chart 1, but with the overall cumulative cases
per 100k in each state to July 12. MT remains 30/55 (26th highest).
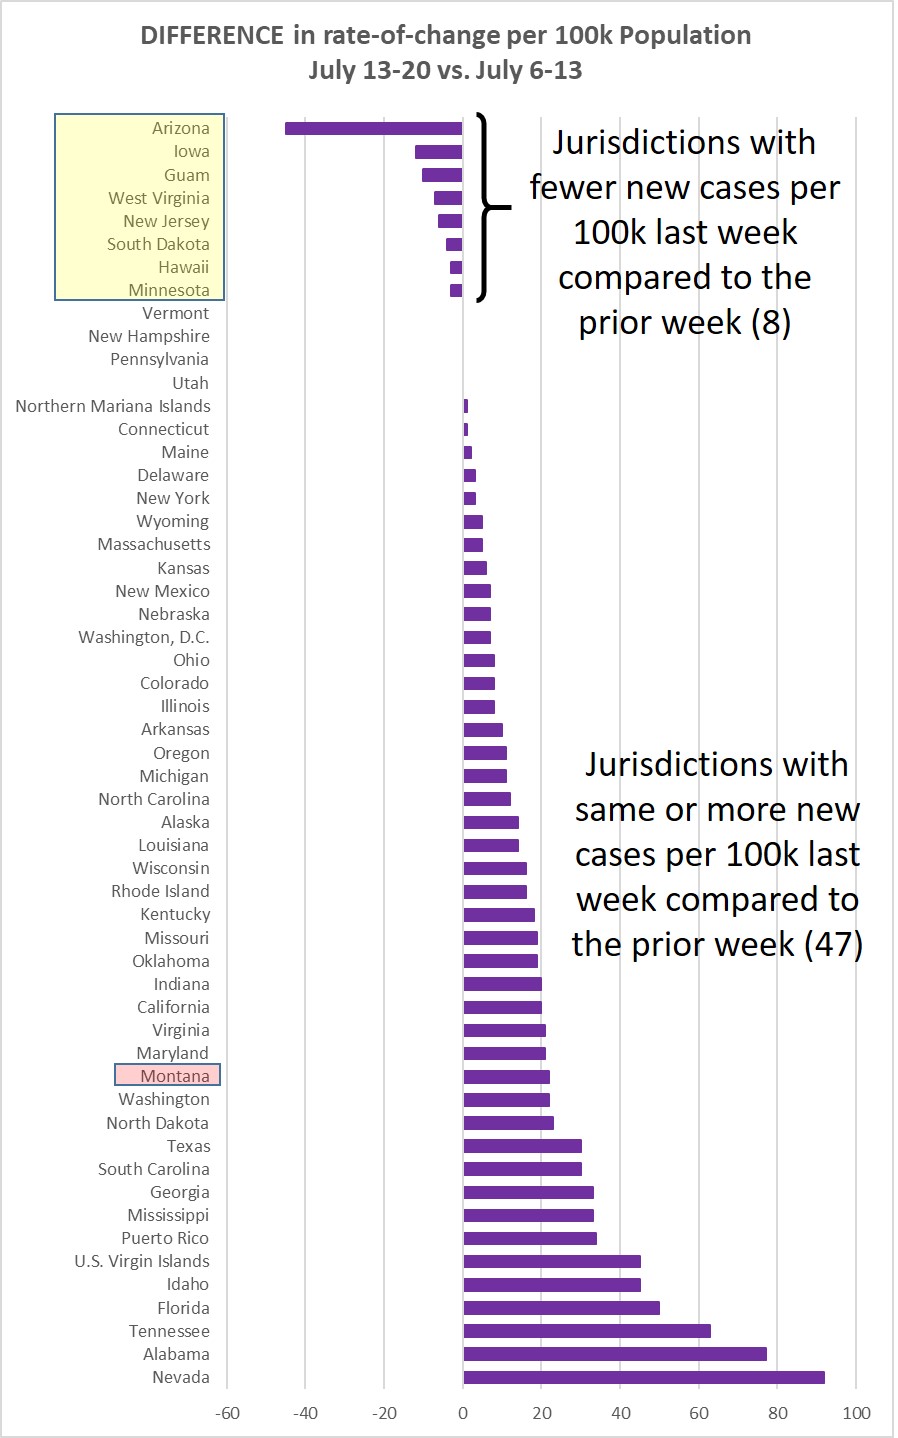
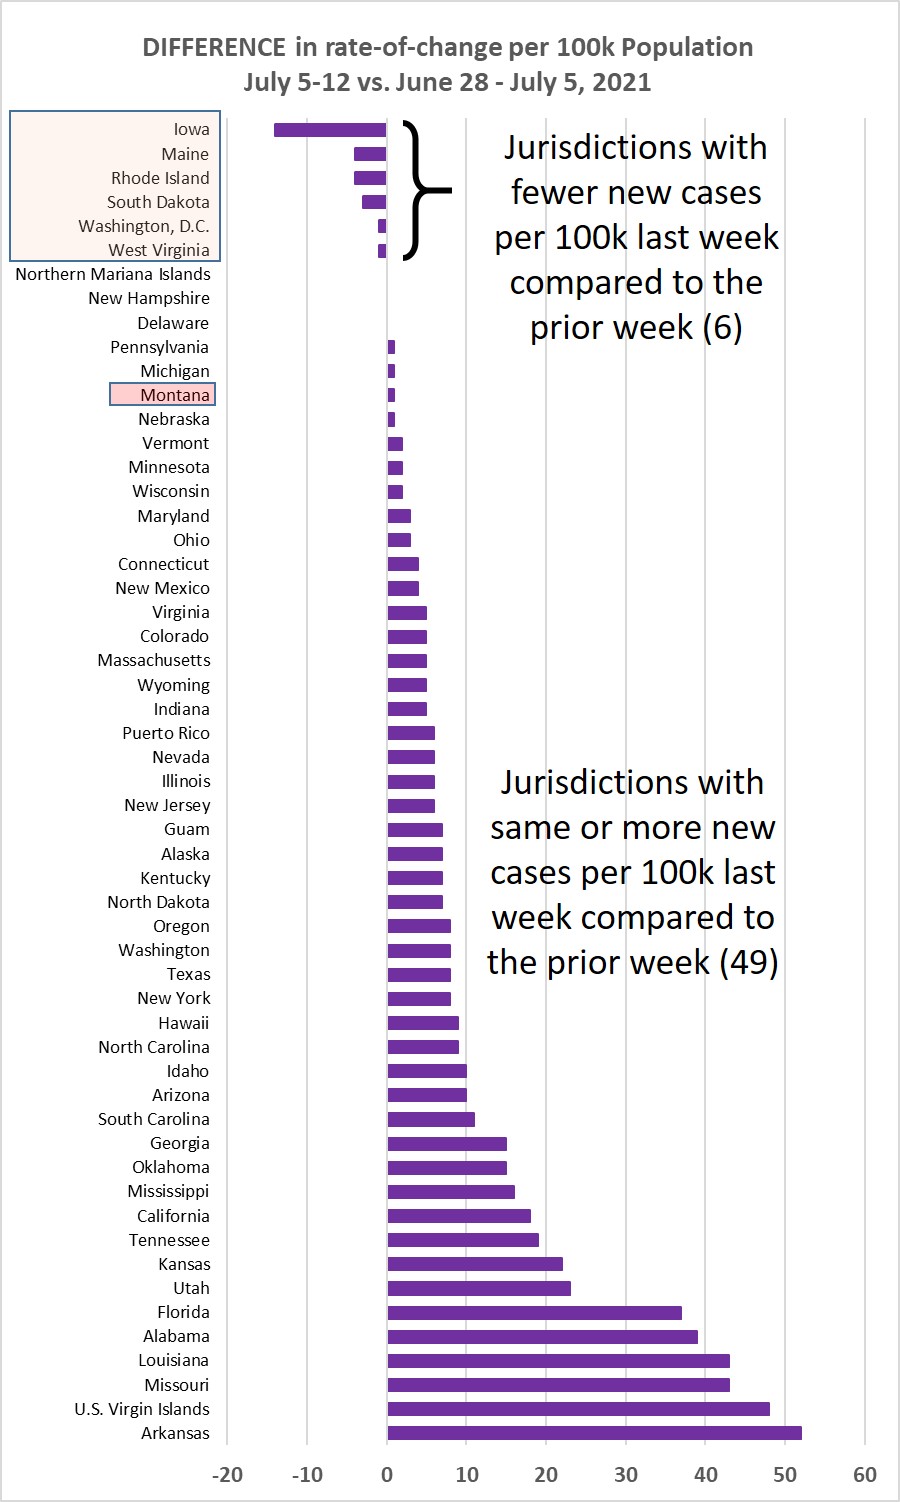
Chart 3 shows the difference in weekly new cases per 100k population for July 5-12,
vs. June 28 - July 5, 2021. This past week 49/55 jurisdictions (89% !!) showed the
same or higher rate of new cases.

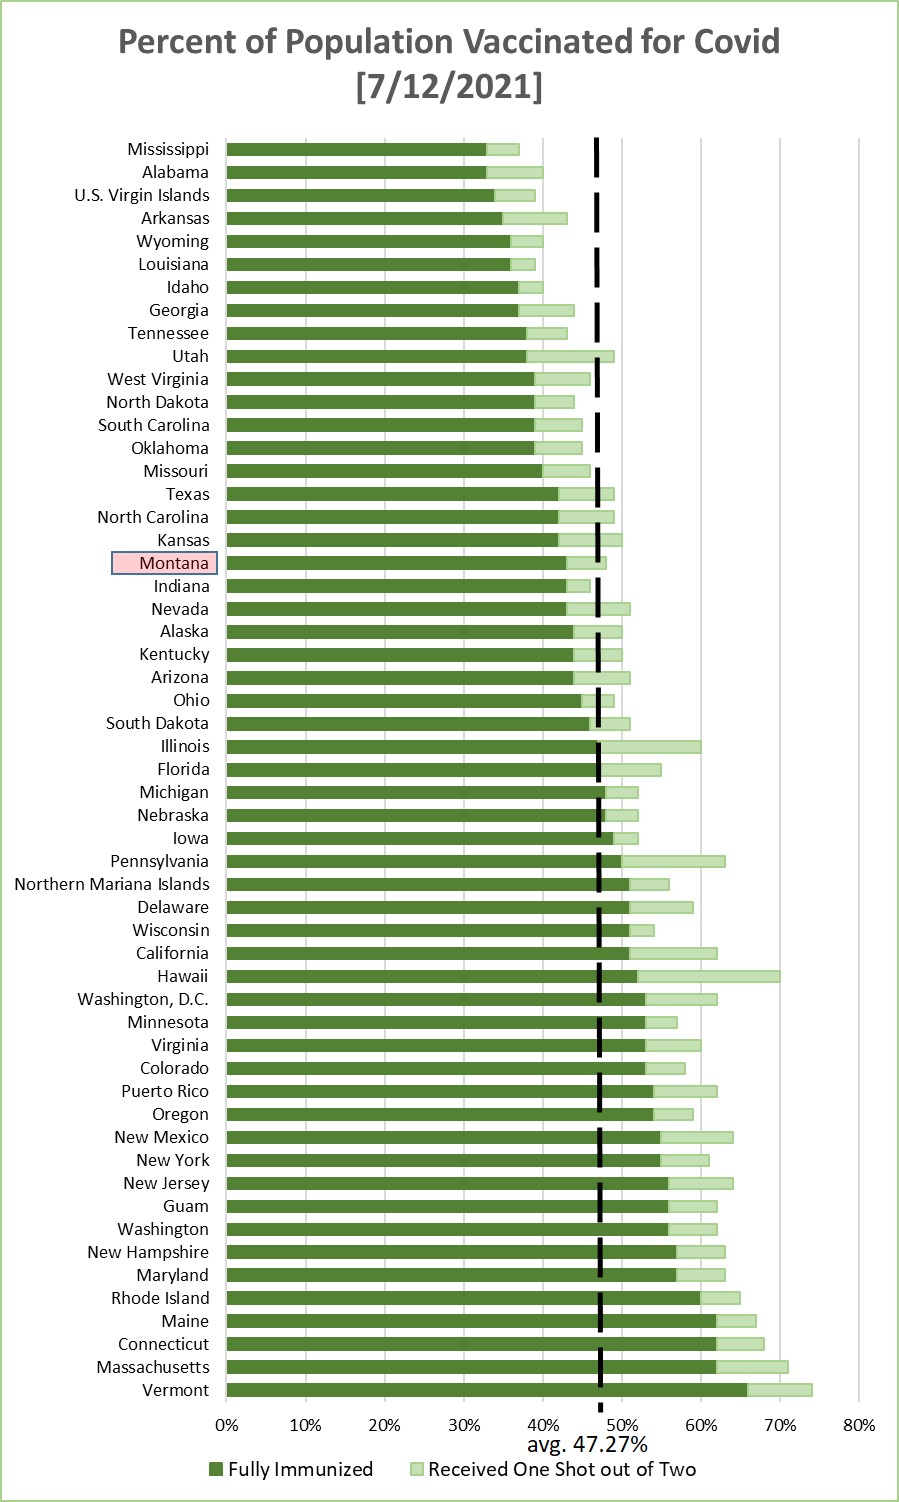
Chart 4 shows the percentage of the population in each jurisdiction having received
1 or 2 Covid-19 vaccination shots. This is sorted by the fraction that have received
2 shots--or one shot of the J&J vaccine. Average across the 55 jurisdictions is 47.27%
being fully immunized--a weekly increase of about 0.8%.

Monday, July 5, 2021
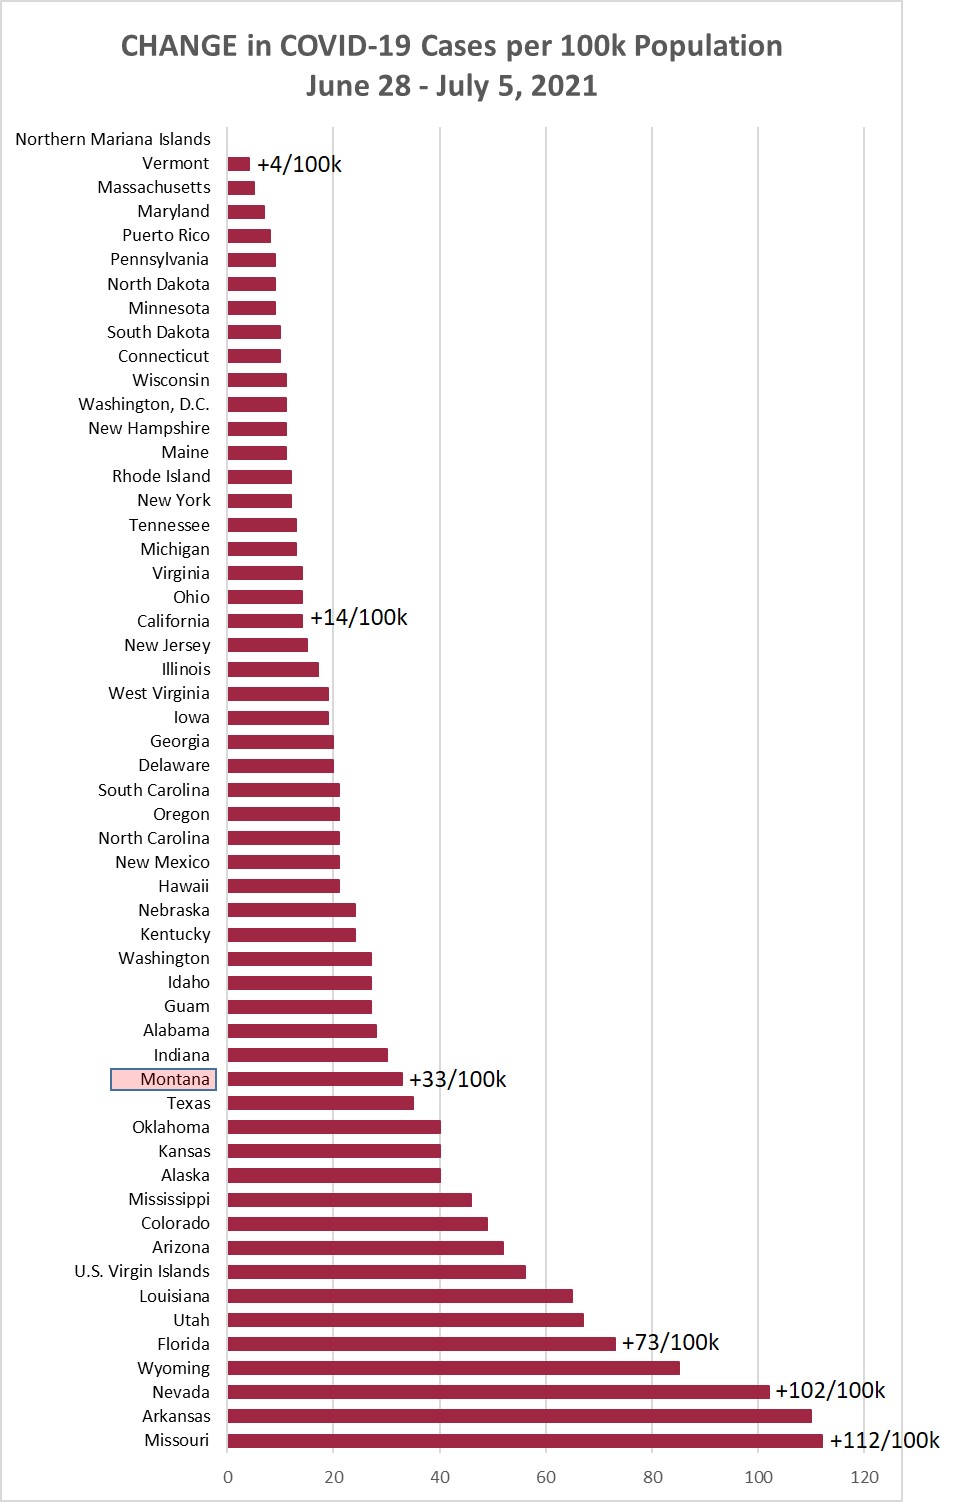
Chart 1 shows the change in cases per 100,000 population as of this morning (July
5, 2021) compared to the cases per 100,000 on June 28, 2021. Montana was up +33/100k
this week, same as the +33/100k the prior week, and compared to +39/100k the week
before that.
Chart 2 shows the same information as Chart 1, but with the overall cumulative cases
per 100k in each state to July 5. MT remains 30/55 (26th highest).
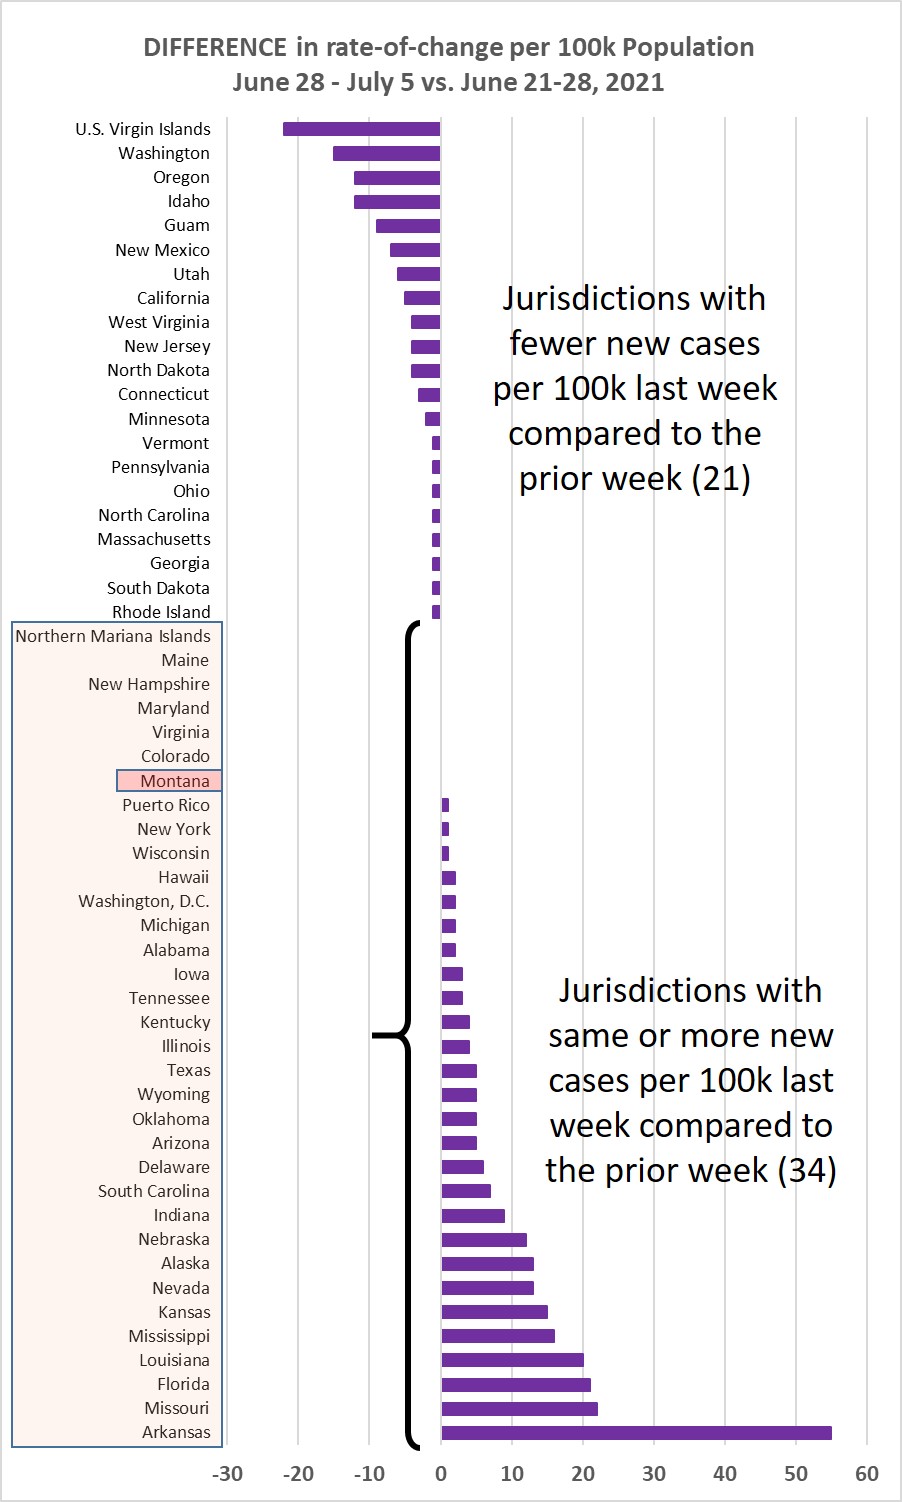
Chart 3 shows the difference in weekly new cases per 100k population for June 28 -
July 5, vs. June 21-28, 2021. This past week 34/55 jurisdictions (61.8%) showed the
same or higher rate of new cases.
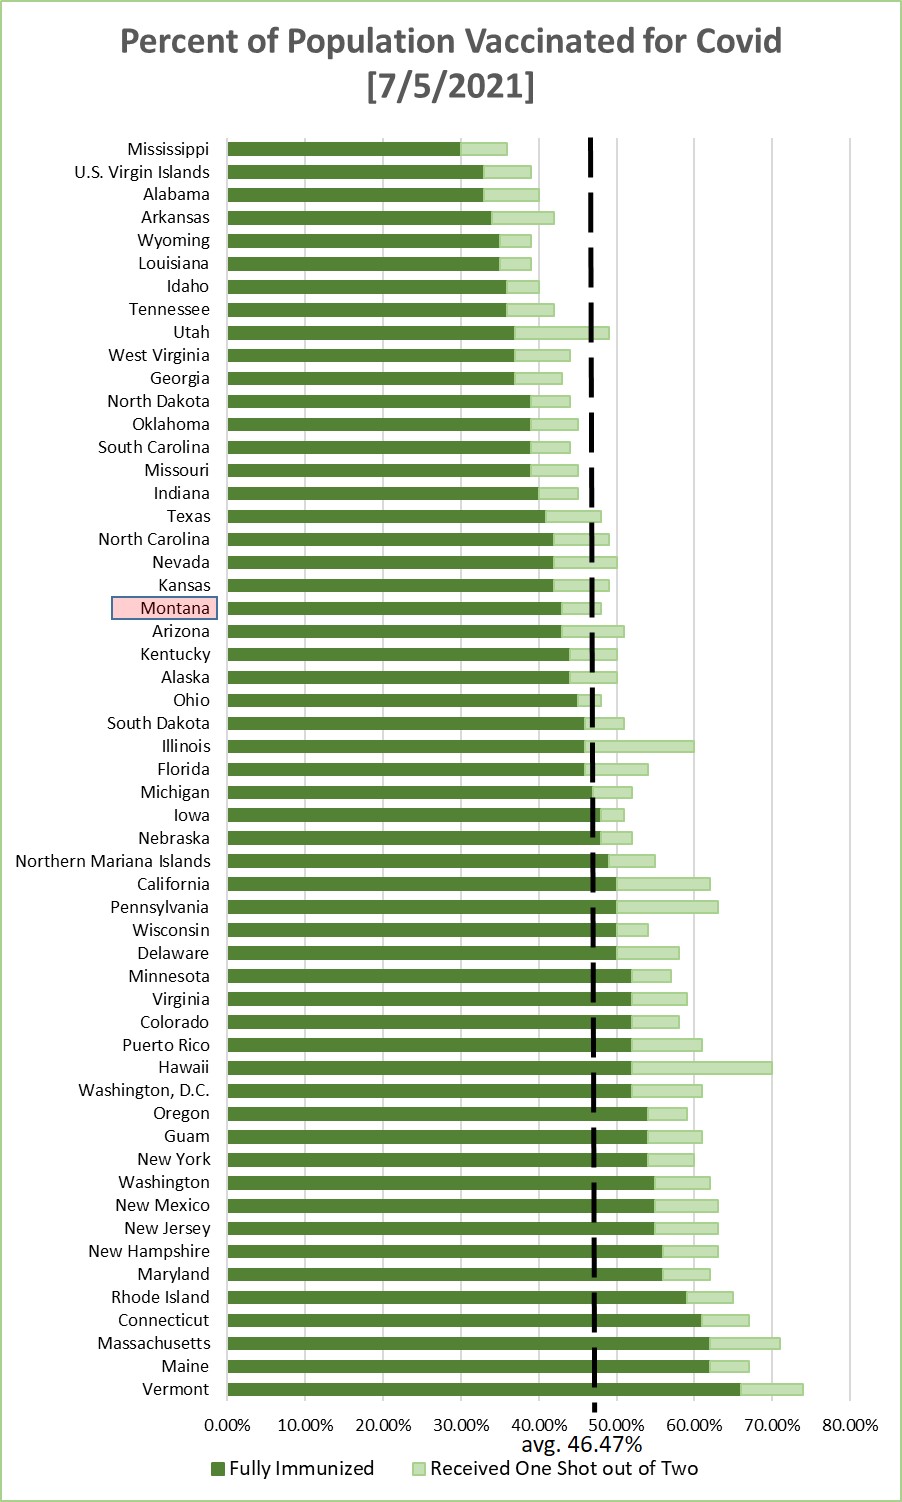
Chart 4 shows the percentage of the population in each jurisdiction having received
1 or 2 Covid-19 vaccination shots. This is sorted by the fraction that have received
2 shots--or one shot of the J&J vaccine. Average across the 55 jurisdictions is 46.47%
being fully immunized--a weekly increase of about 1.3%.

Monday, June 28, 2021
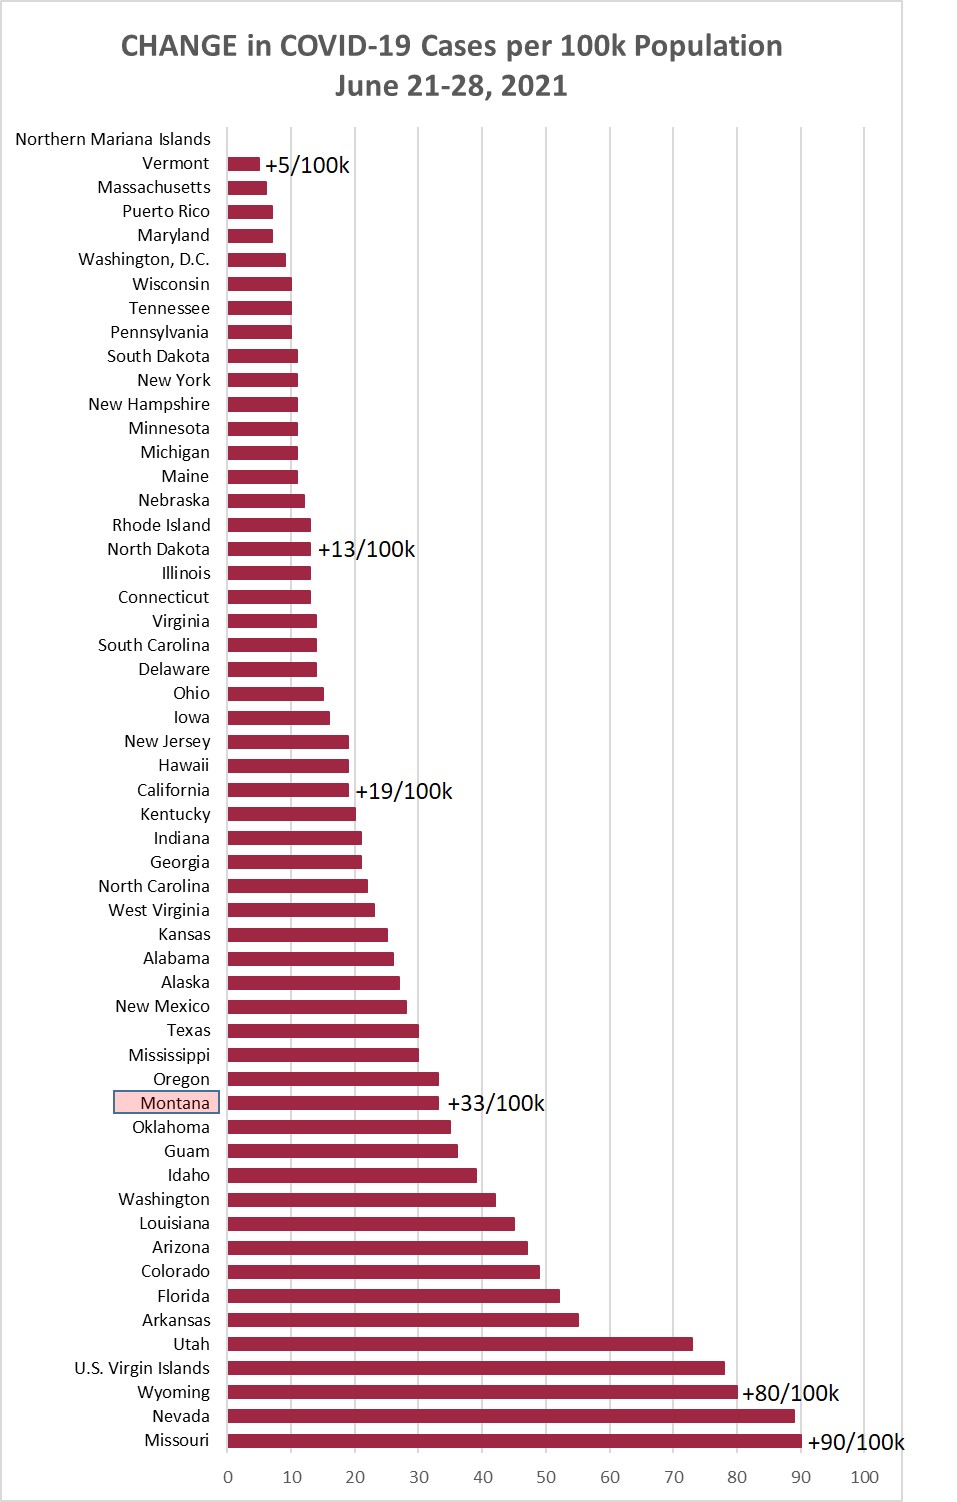
Chart 1 shows the change in cases per 100,000 population as of this morning (June
28, 2021) compared to the cases per 100,000 on June 21, 2021. Montana was up +33/100k
this week, compared to +39/100k the prior week, and +46/100k the week before that.
Chart 2 shows the same information as Chart 1, but with the overall cumulative cases
per 100k in each state to June 28. MT remains 30/55 (26th highest).
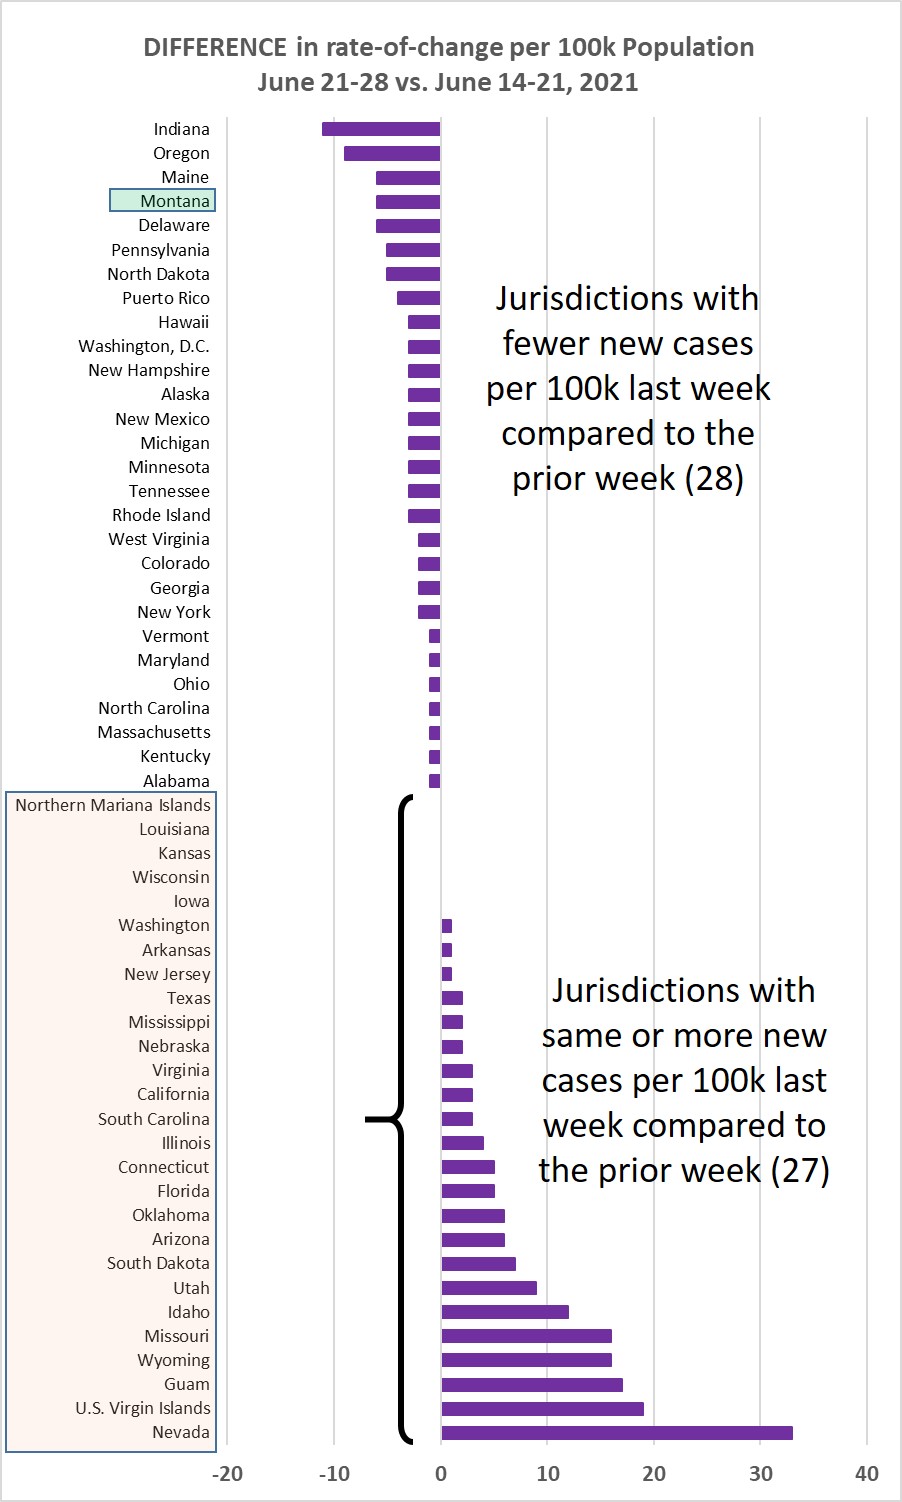
Chart 3 shows the difference in weekly new cases per 100k population for June 21-28,
vs. June 14-21, 2021. This past week 28/55 jurisdictions (49.1%) showed a lower rate
of new cases.
Chart 4 shows the percentage of the population in each jurisdiction having received
1 or 2 Covid-19 vaccination shots. This is sorted by the fraction that have received
2 shots--or one shot of the J&J vaccine. Average across the 55 jurisdictions is 45.18%
being fully immunized--a weekly increase of about 0.91%.


Monday, June 21, 2021
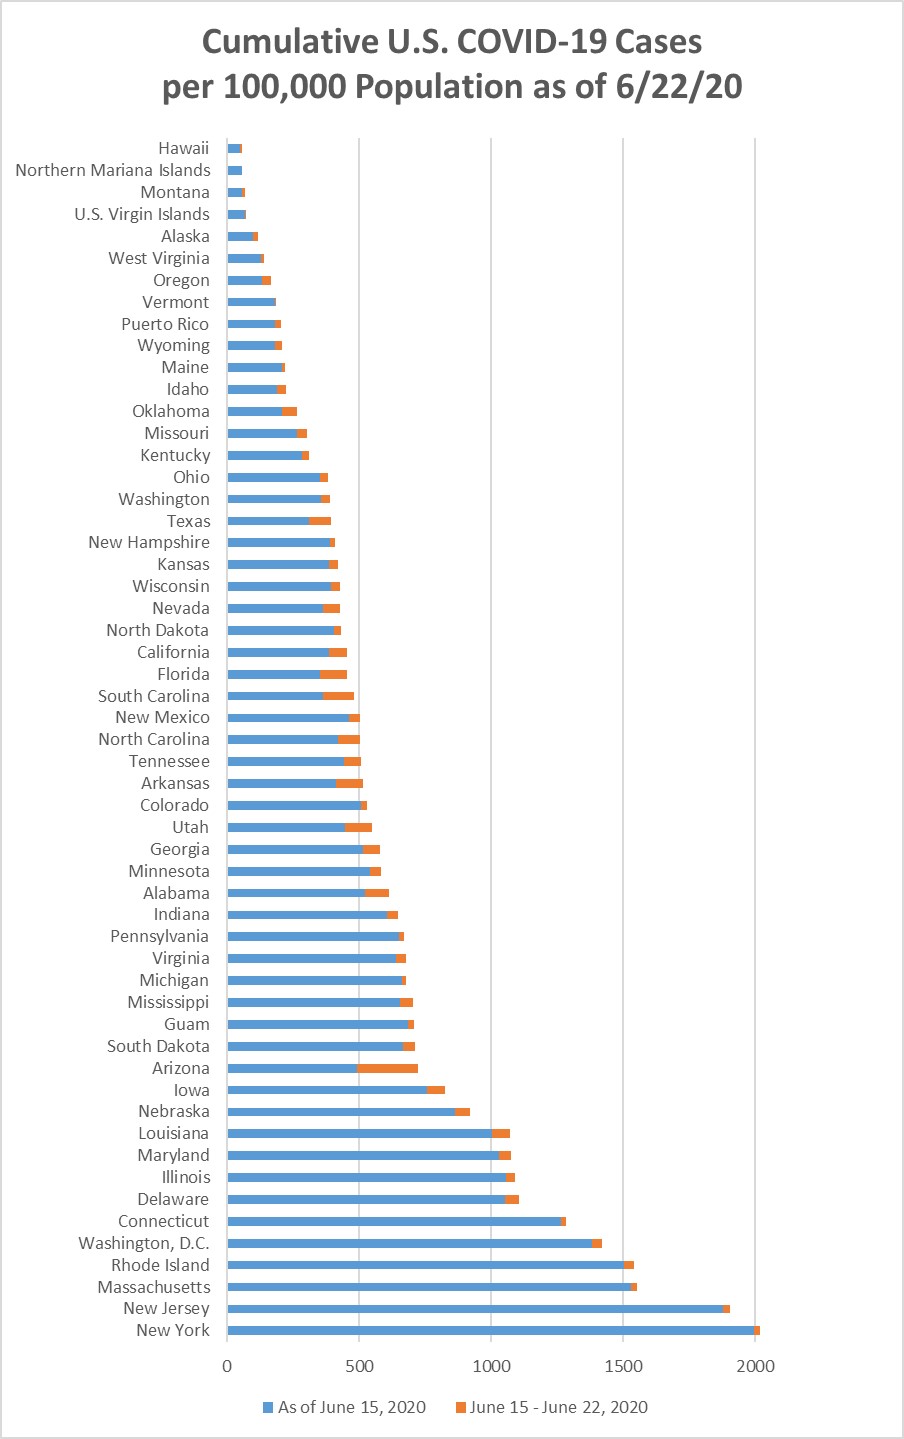
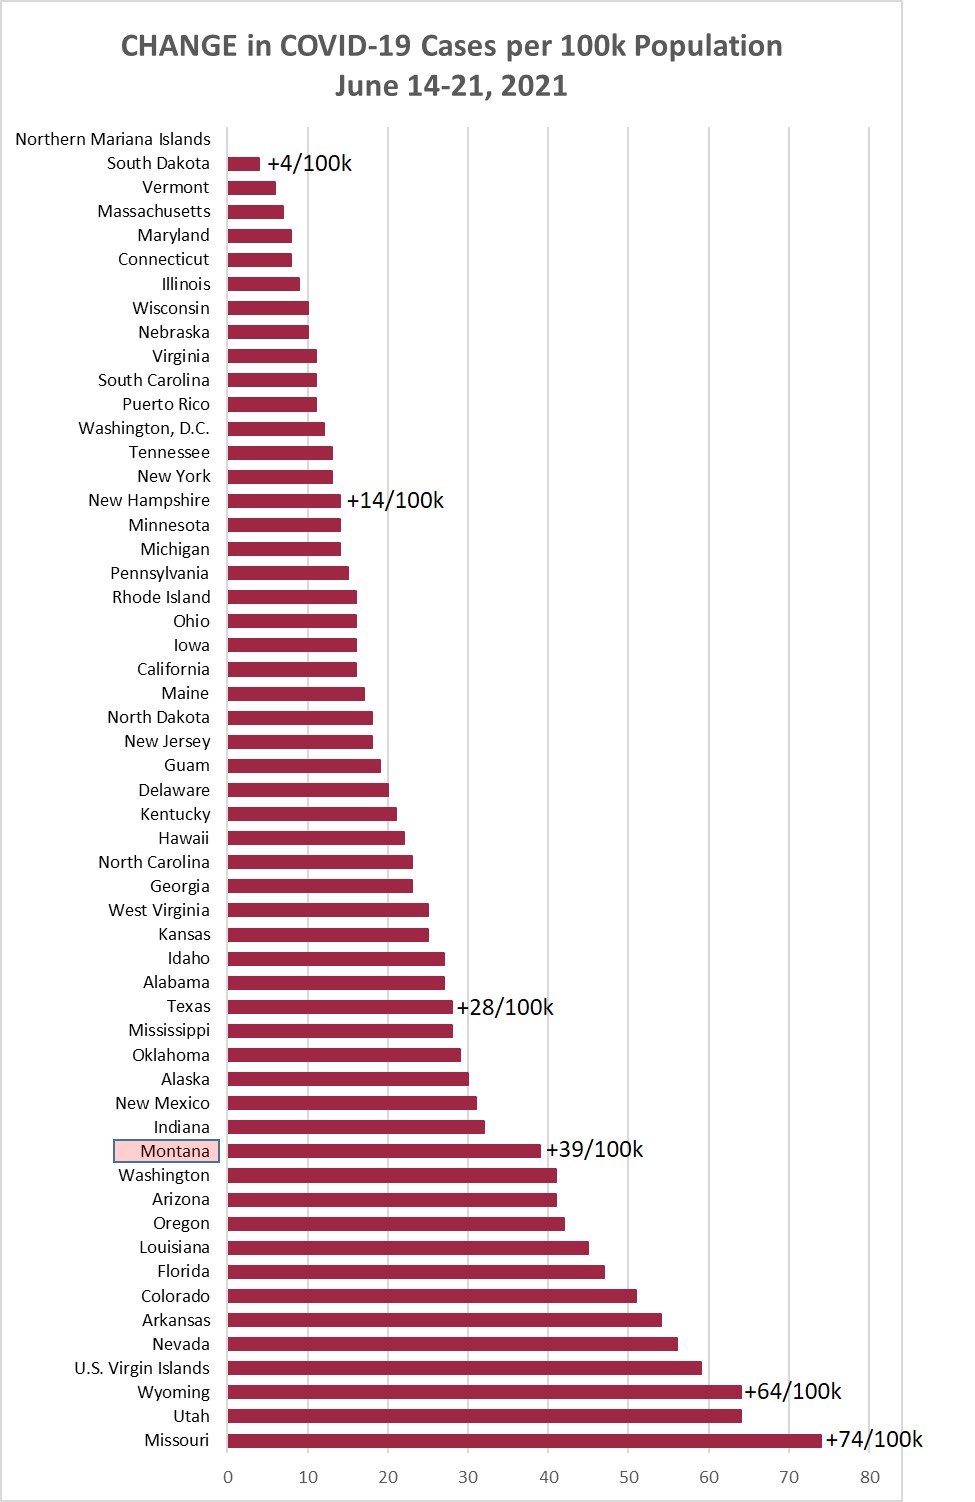
Chart 1 shows the change in cases per 100,000 population as of this morning (June
21, 2021) compared to the cases per 100,000 on June 14, 2021. Montana was up +39/100k
this week, compared to +46/100k the prior week, and +43/100k the week before that.
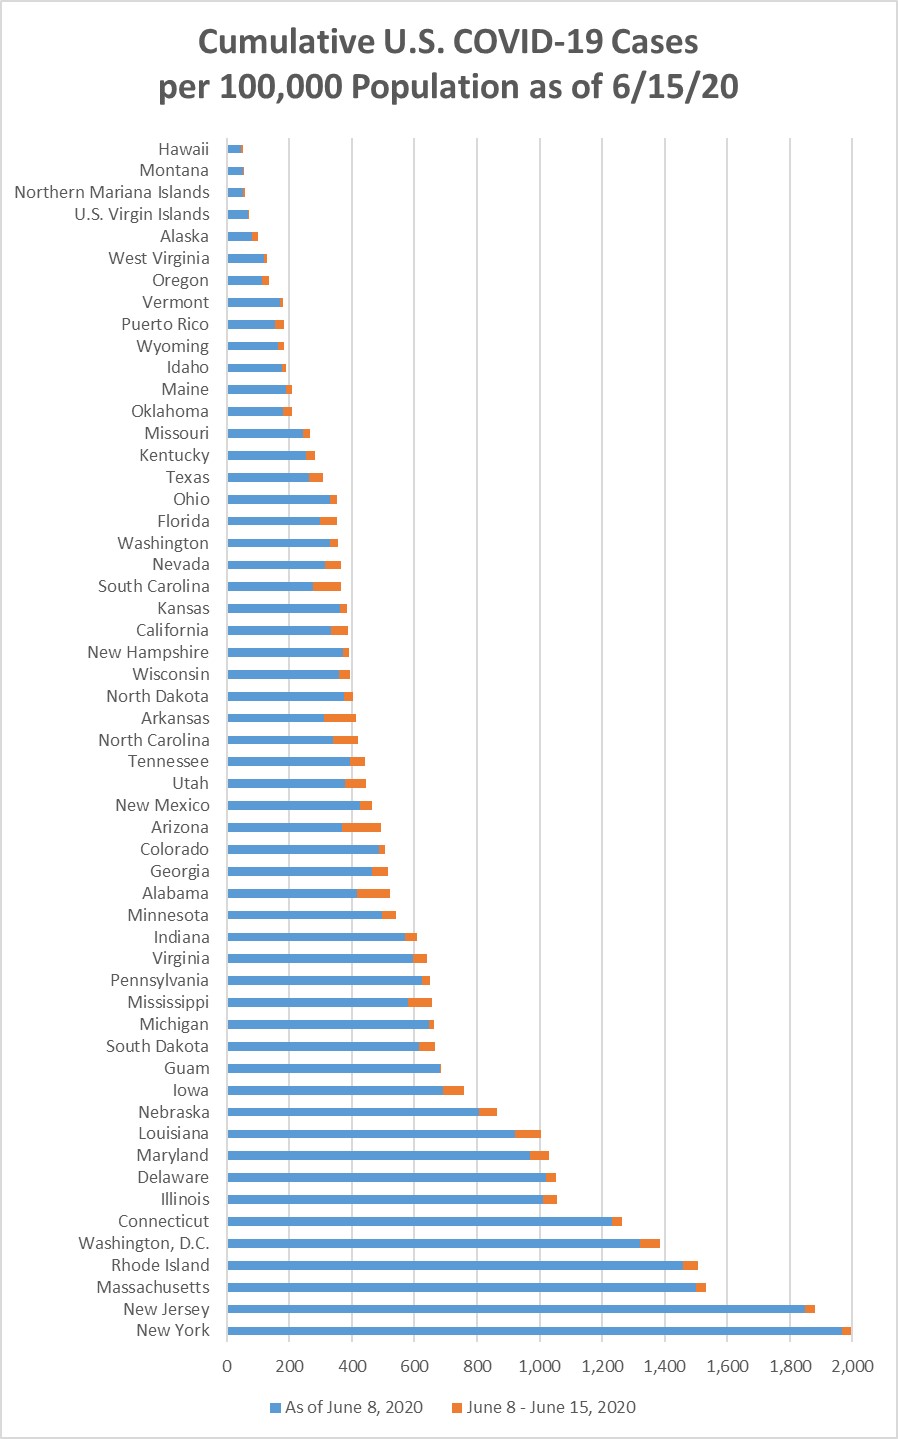
Chart 2 shows the same information as Chart 1, but with the overall cumulative cases
per 100k in each state to June 21. Montana was passed by Wyoming this week. MT now
30/55 (26th highest).
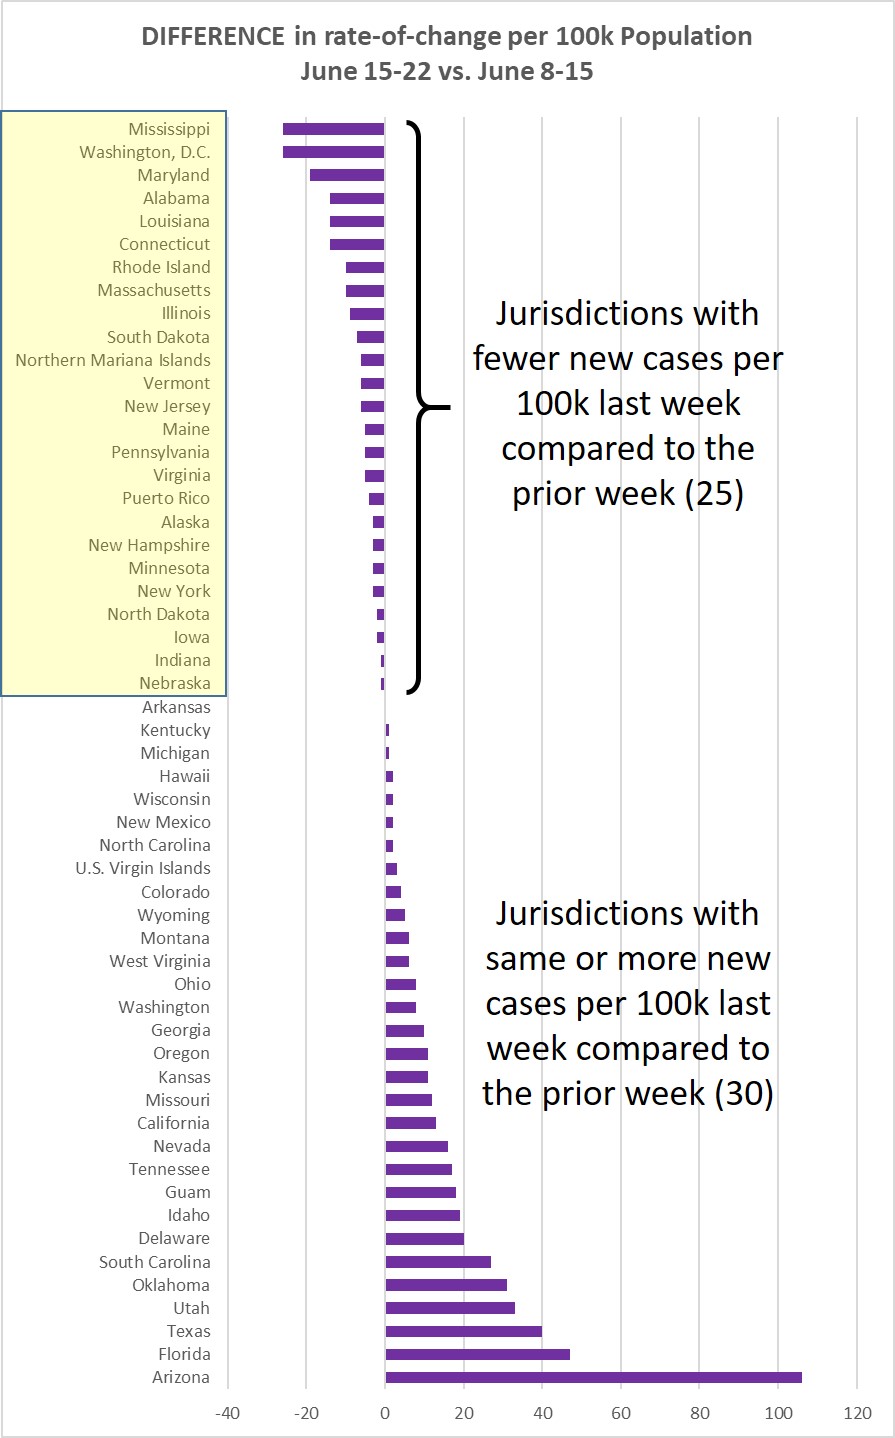
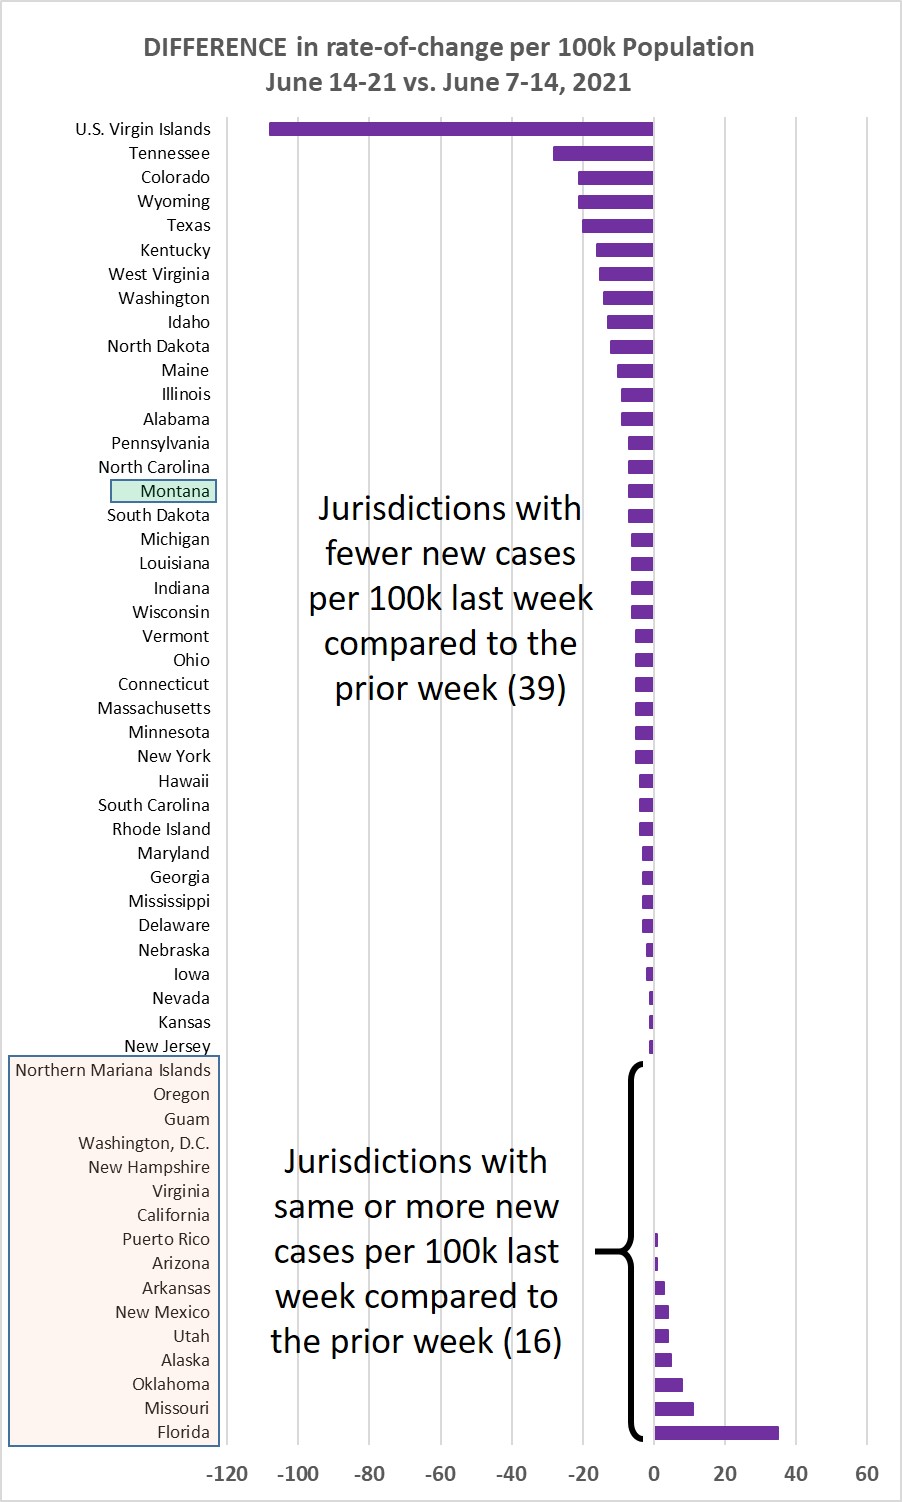
Chart 3 shows the difference in weekly new cases per 100k population for June 14-21,
vs. June 7-14, 2021. This past week 39/55 jurisdictions (70.9%) showed a lower rate
of new cases.
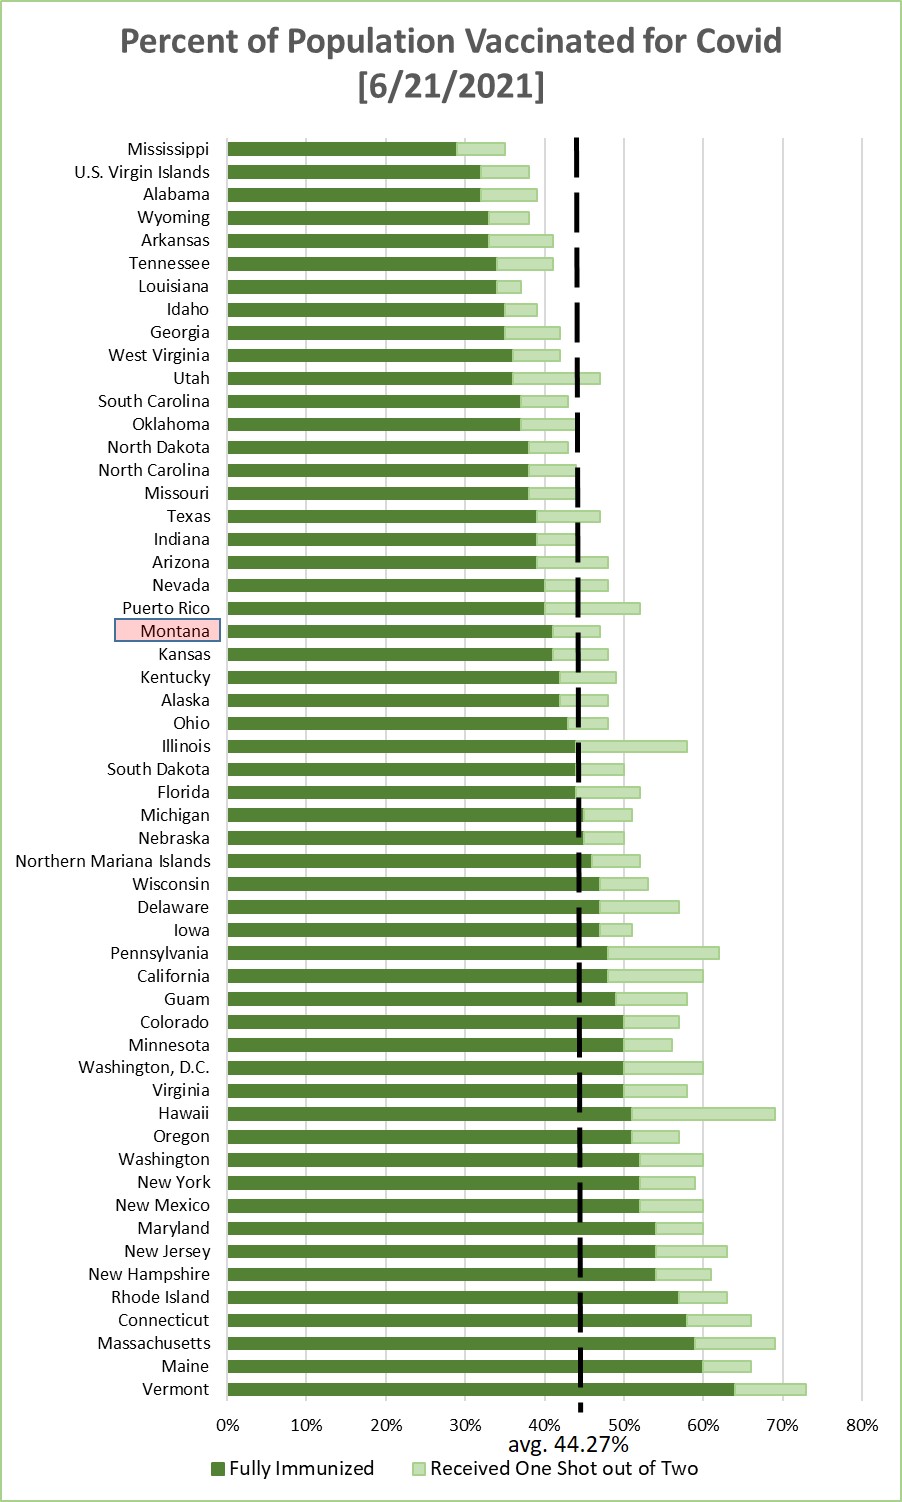
Chart 4 shows the percentage of the population in each jurisdiction having received
1 or 2 Covid-19 vaccination shots. This is sorted by the fraction that have received
2 shots--or one shot of the J&J vaccine. Average across the 55 jurisdictions is 44.27%
being fully immunized--a weekly increase of about 1.8%.

Monday, June 14, 2021
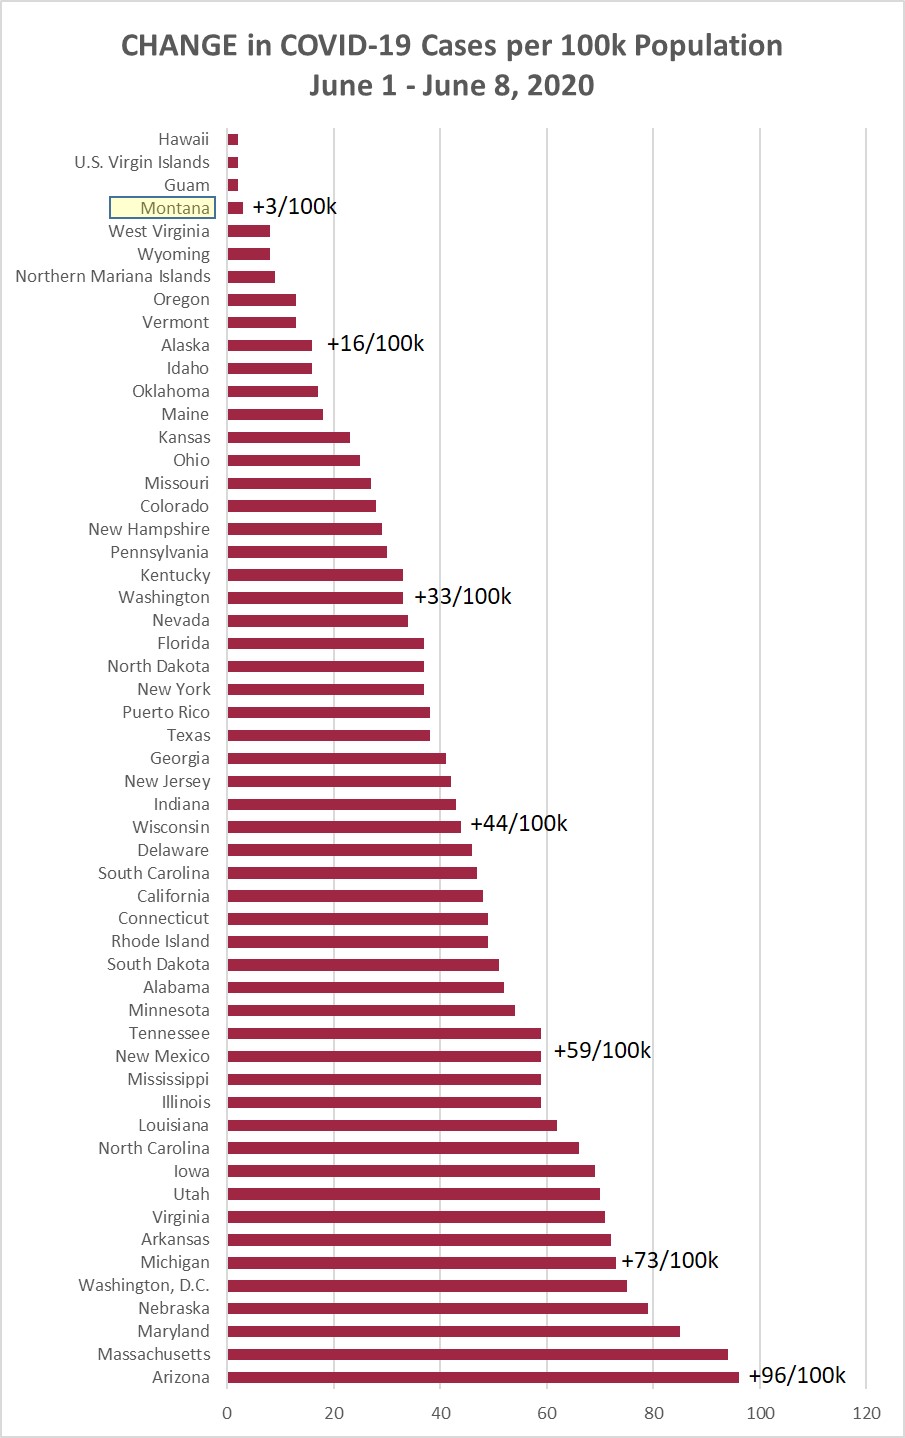
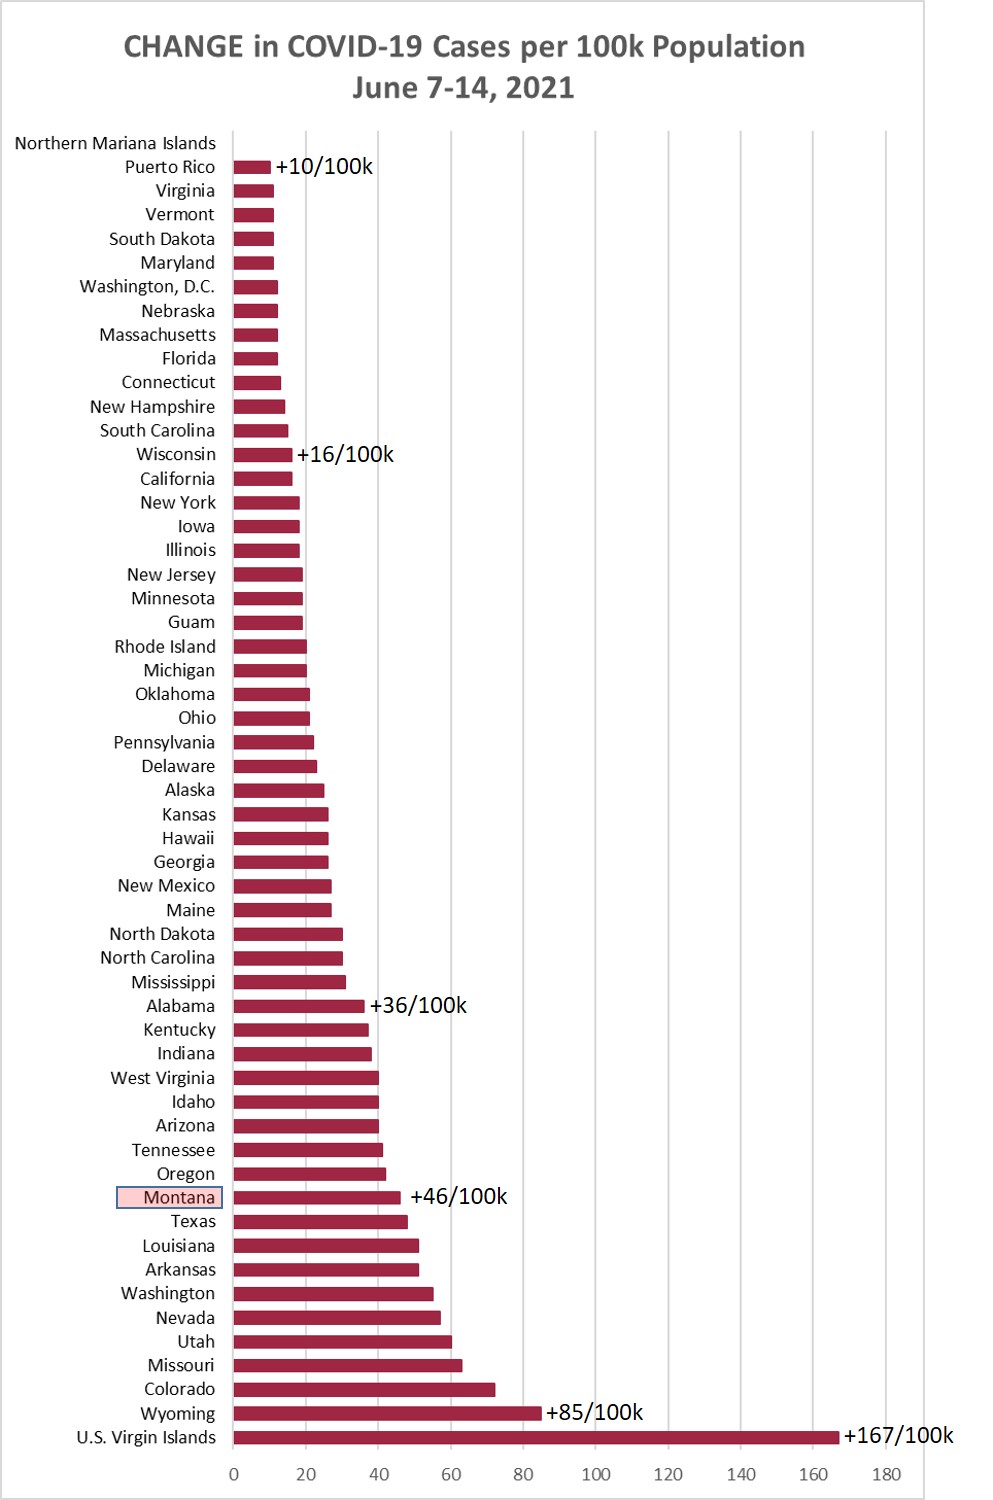
Chart 1 shows the change in cases per 100,000 population as of this morning (June
14, 2021) compared to the cases per 100,000 on June 7, 2021. Montana was up +46/100k
this week, compared to +43/100k the prior week, and +57/100k the week before that.
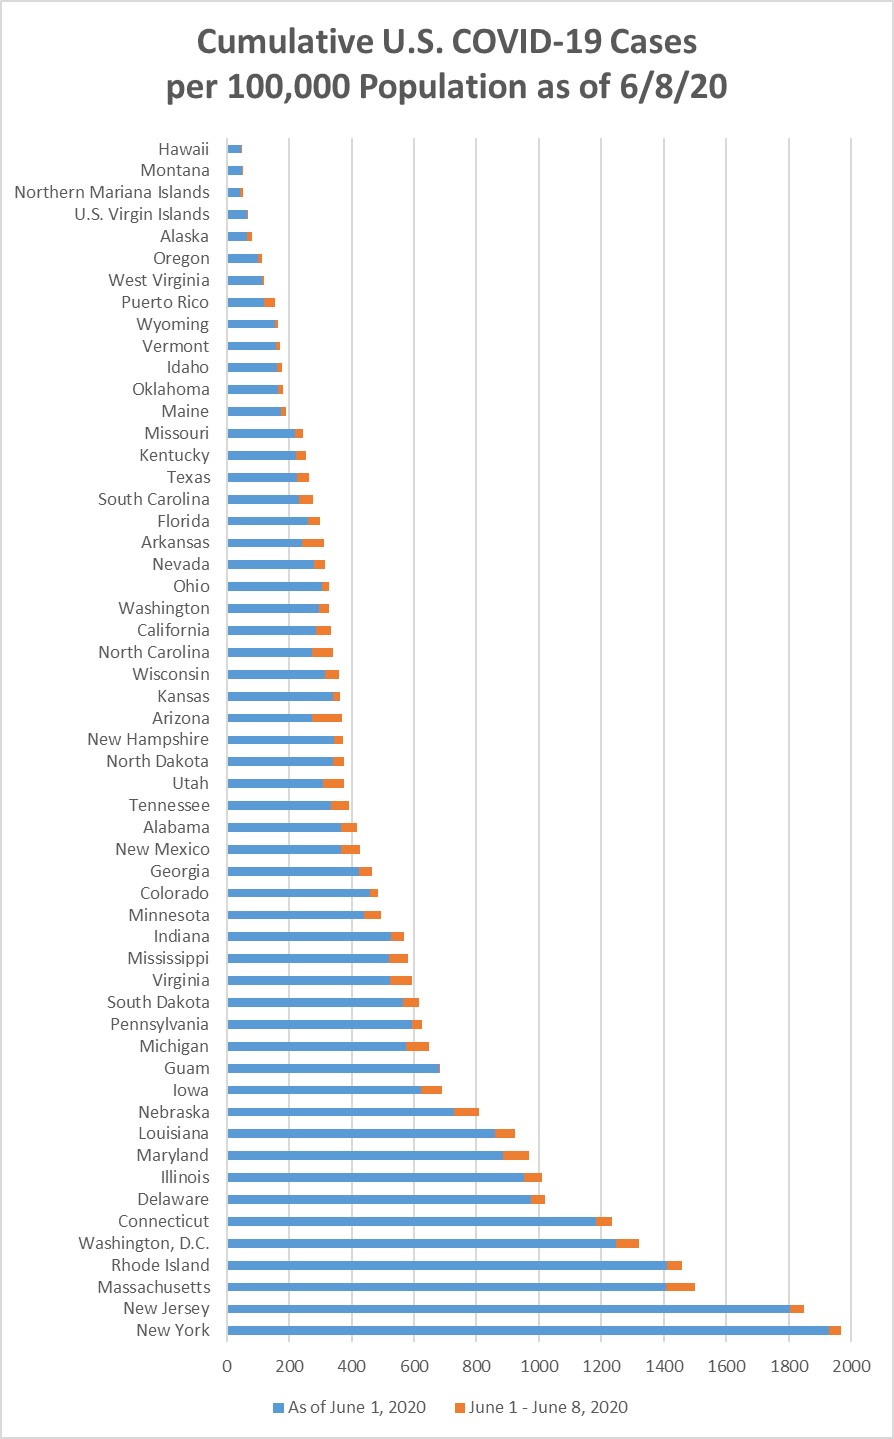
Chart 2 shows the same information as Chart 1, but with the overall cumulative cases
per 100k in each state to June 7. Montana stayed at 31/55 (25th highest), but Wyoming
is now tied for that position.
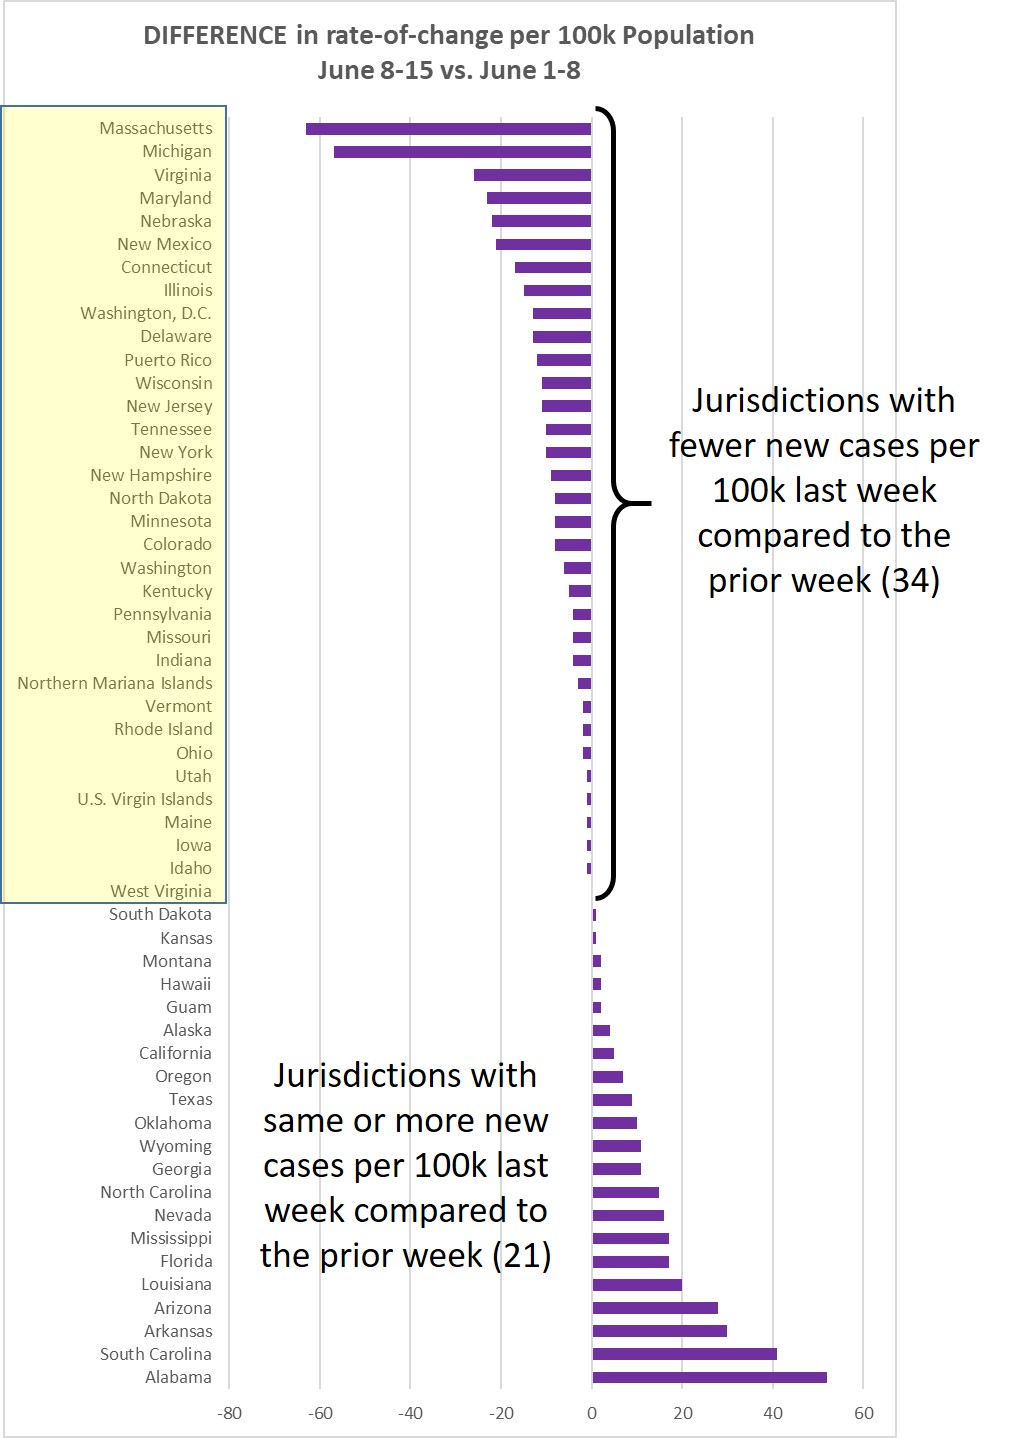
Chart 3 shows the difference in weekly new cases per 100k population for June 7-14,
vs. May 31-June 7, 2021. This past week 23/55 jurisdictions (41.8%) showed a higher
rate of new cases. Not done yet.
Chart 4 shows the percentage of the population in each jurisdiction having received
1 or 2 Covid-19 vaccination shots. This is sorted by the fraction that have received
2 shots--or one shot of the J&J vaccine. Average across the 55 jurisdictions is 42.45%
being fully immunized--a weekly increase of about 0.92%.


Monday, June 7, 2021
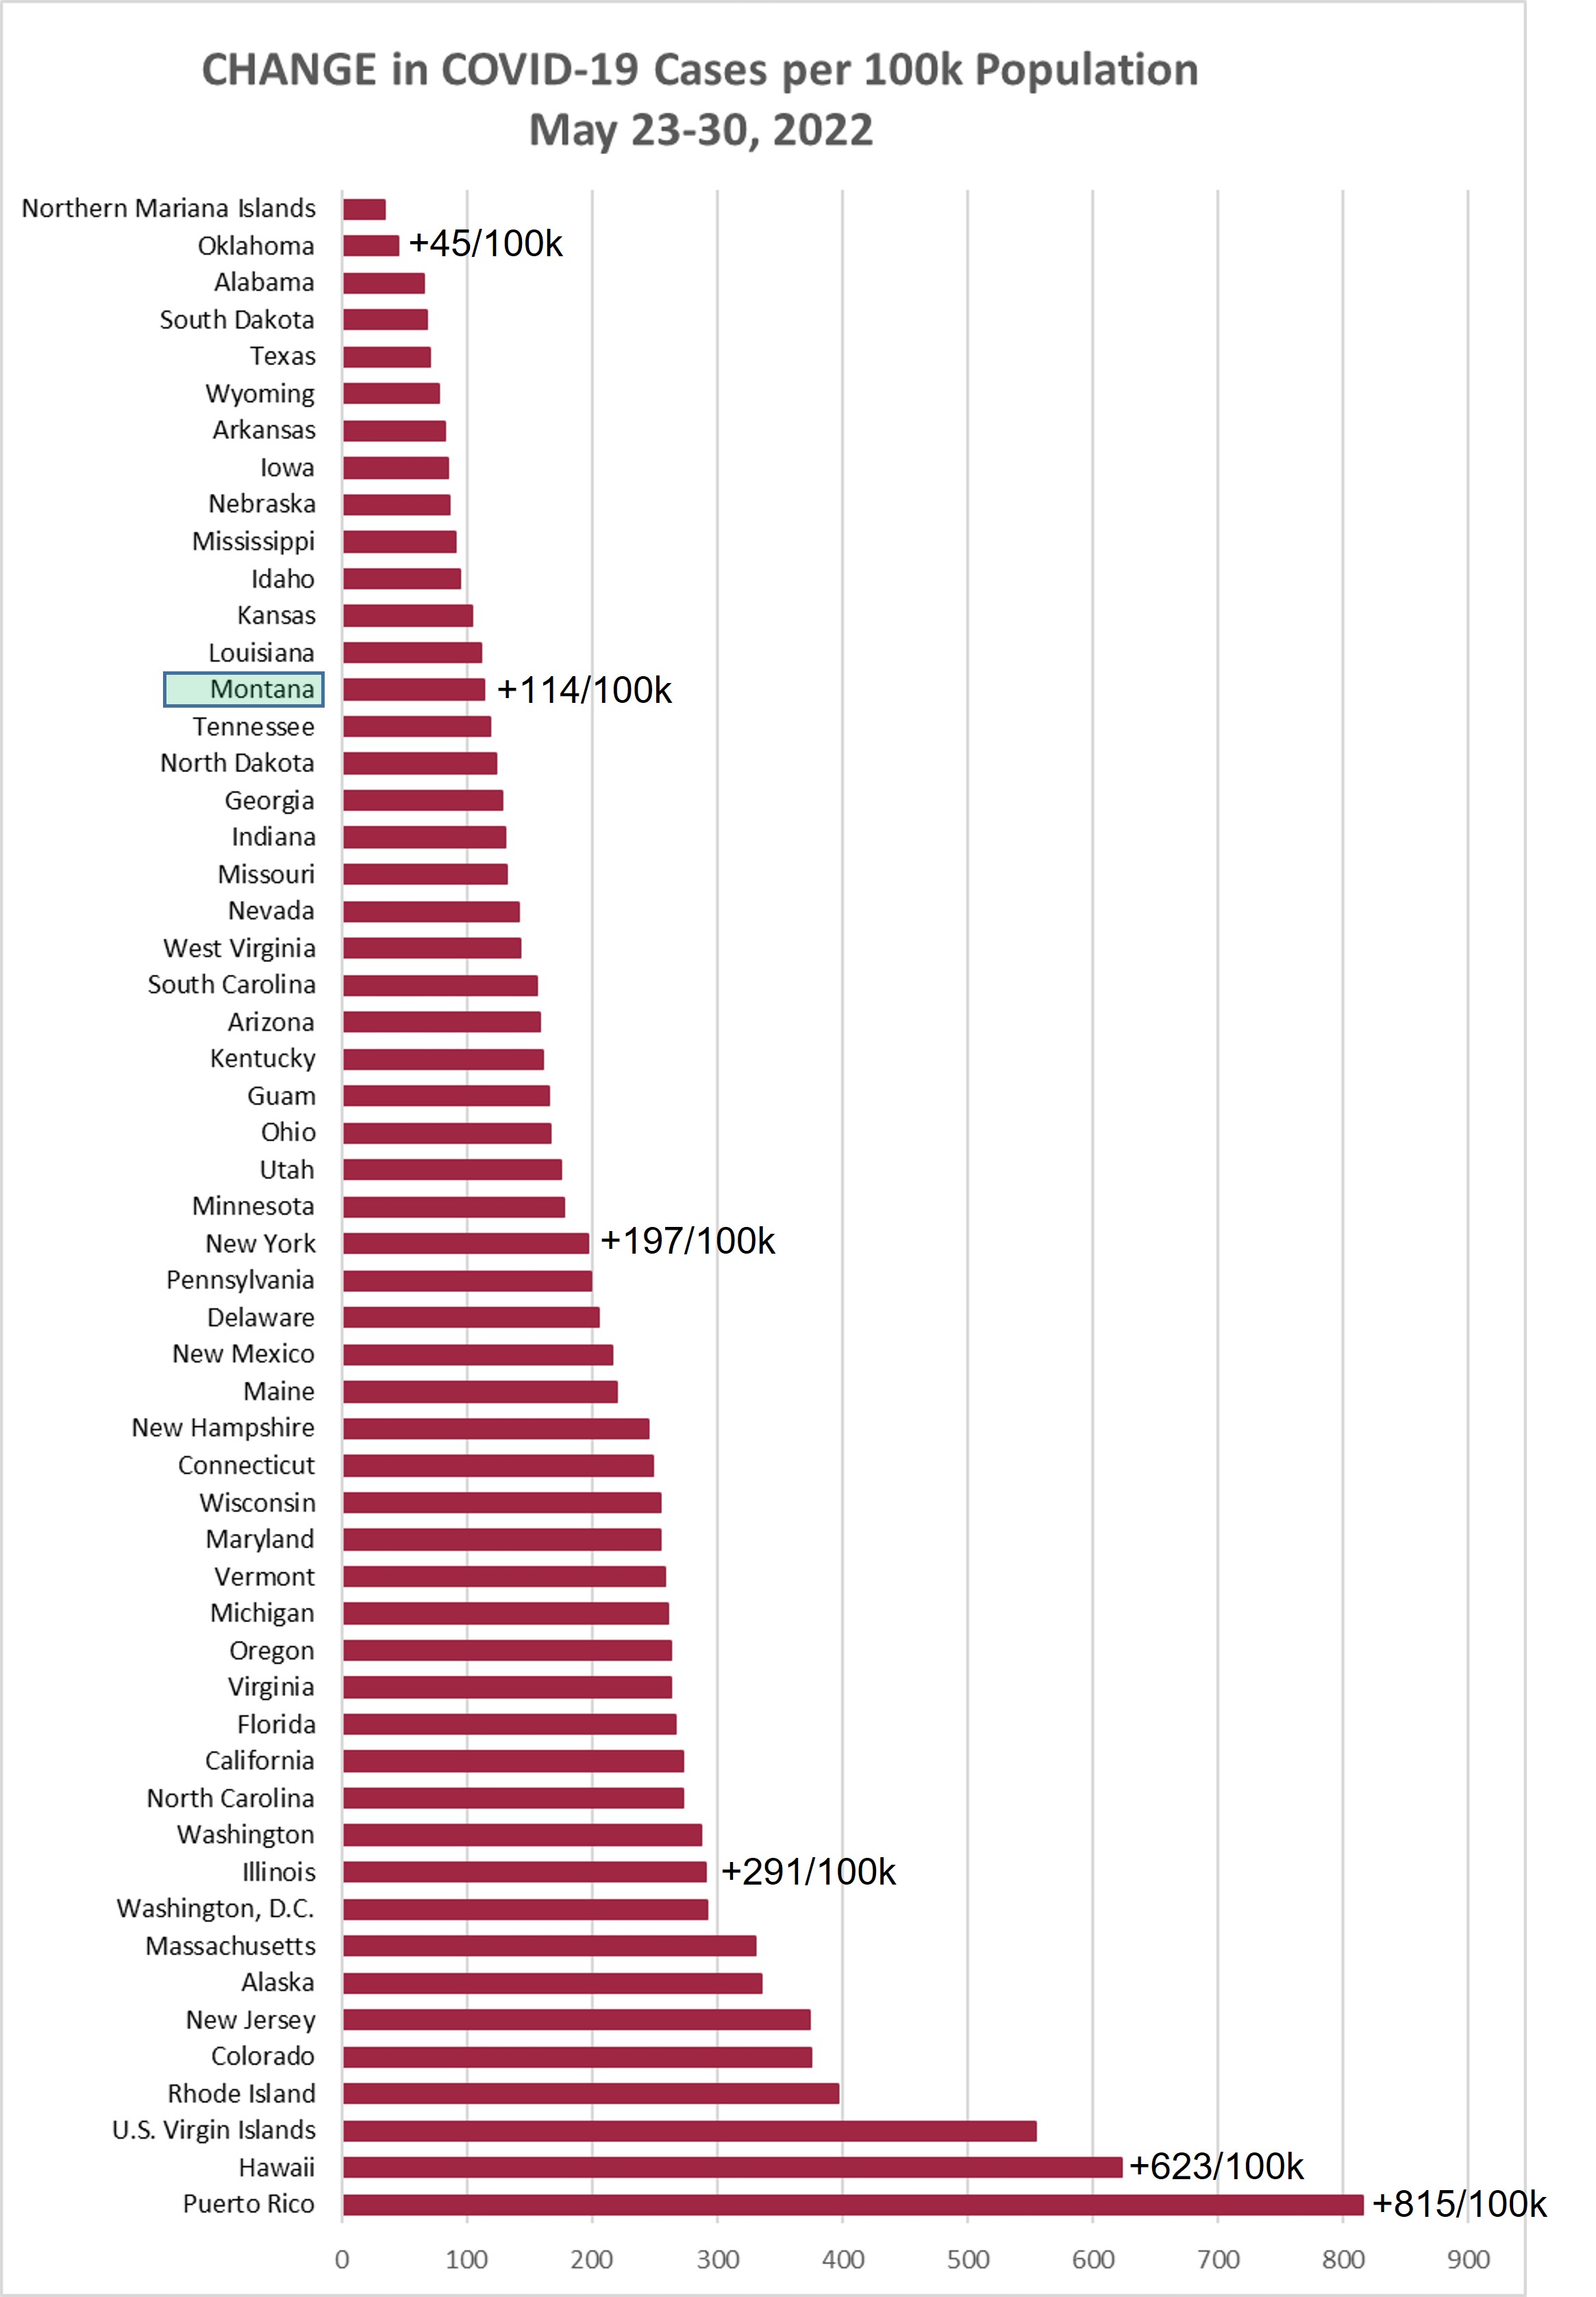
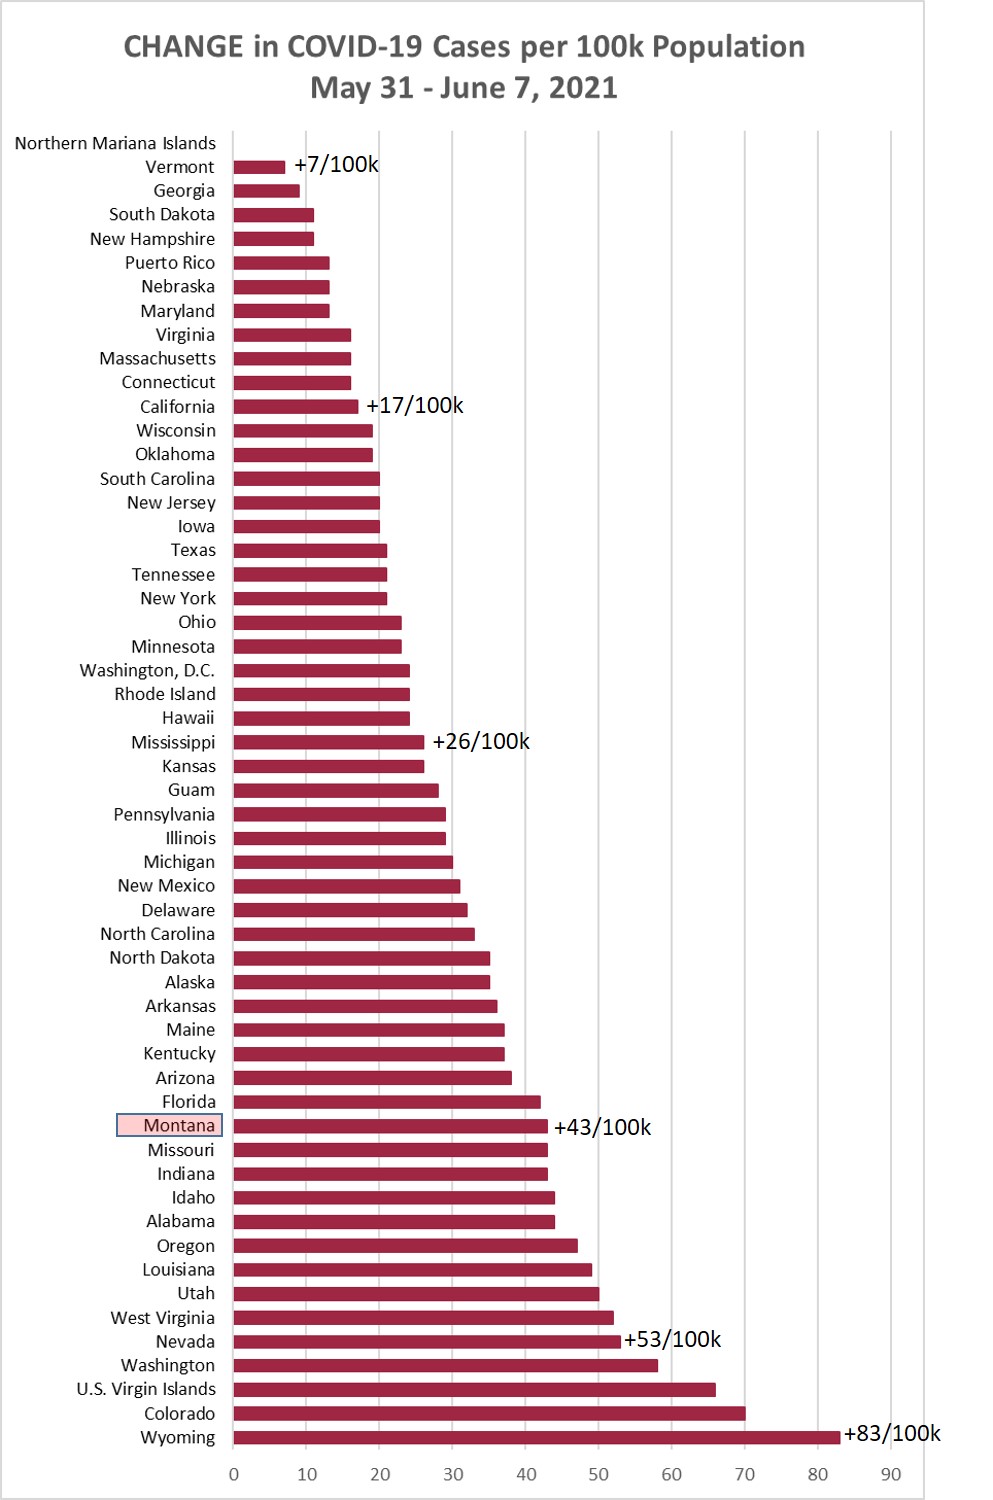
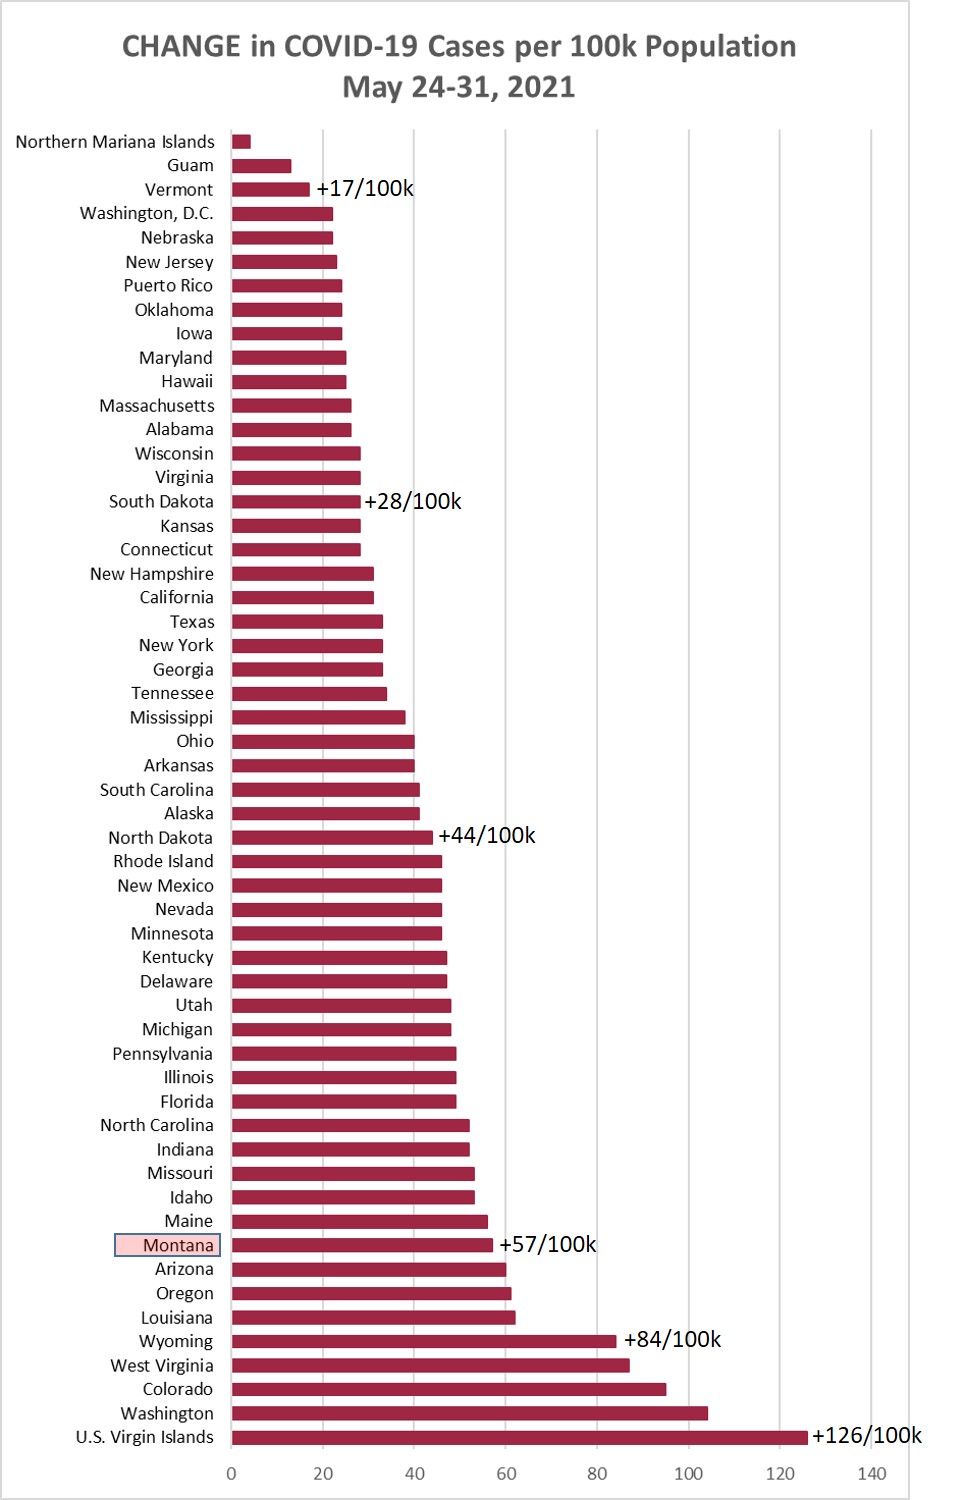
Chart 1 shows the change in cases per 100,000 population as of this morning (June
7, 2021) compared to the cases per 100,000 on May 31, 2021. Montana was up +43/100k
this week, compared to +57/100k the prior week, and +49/100k the week before that.
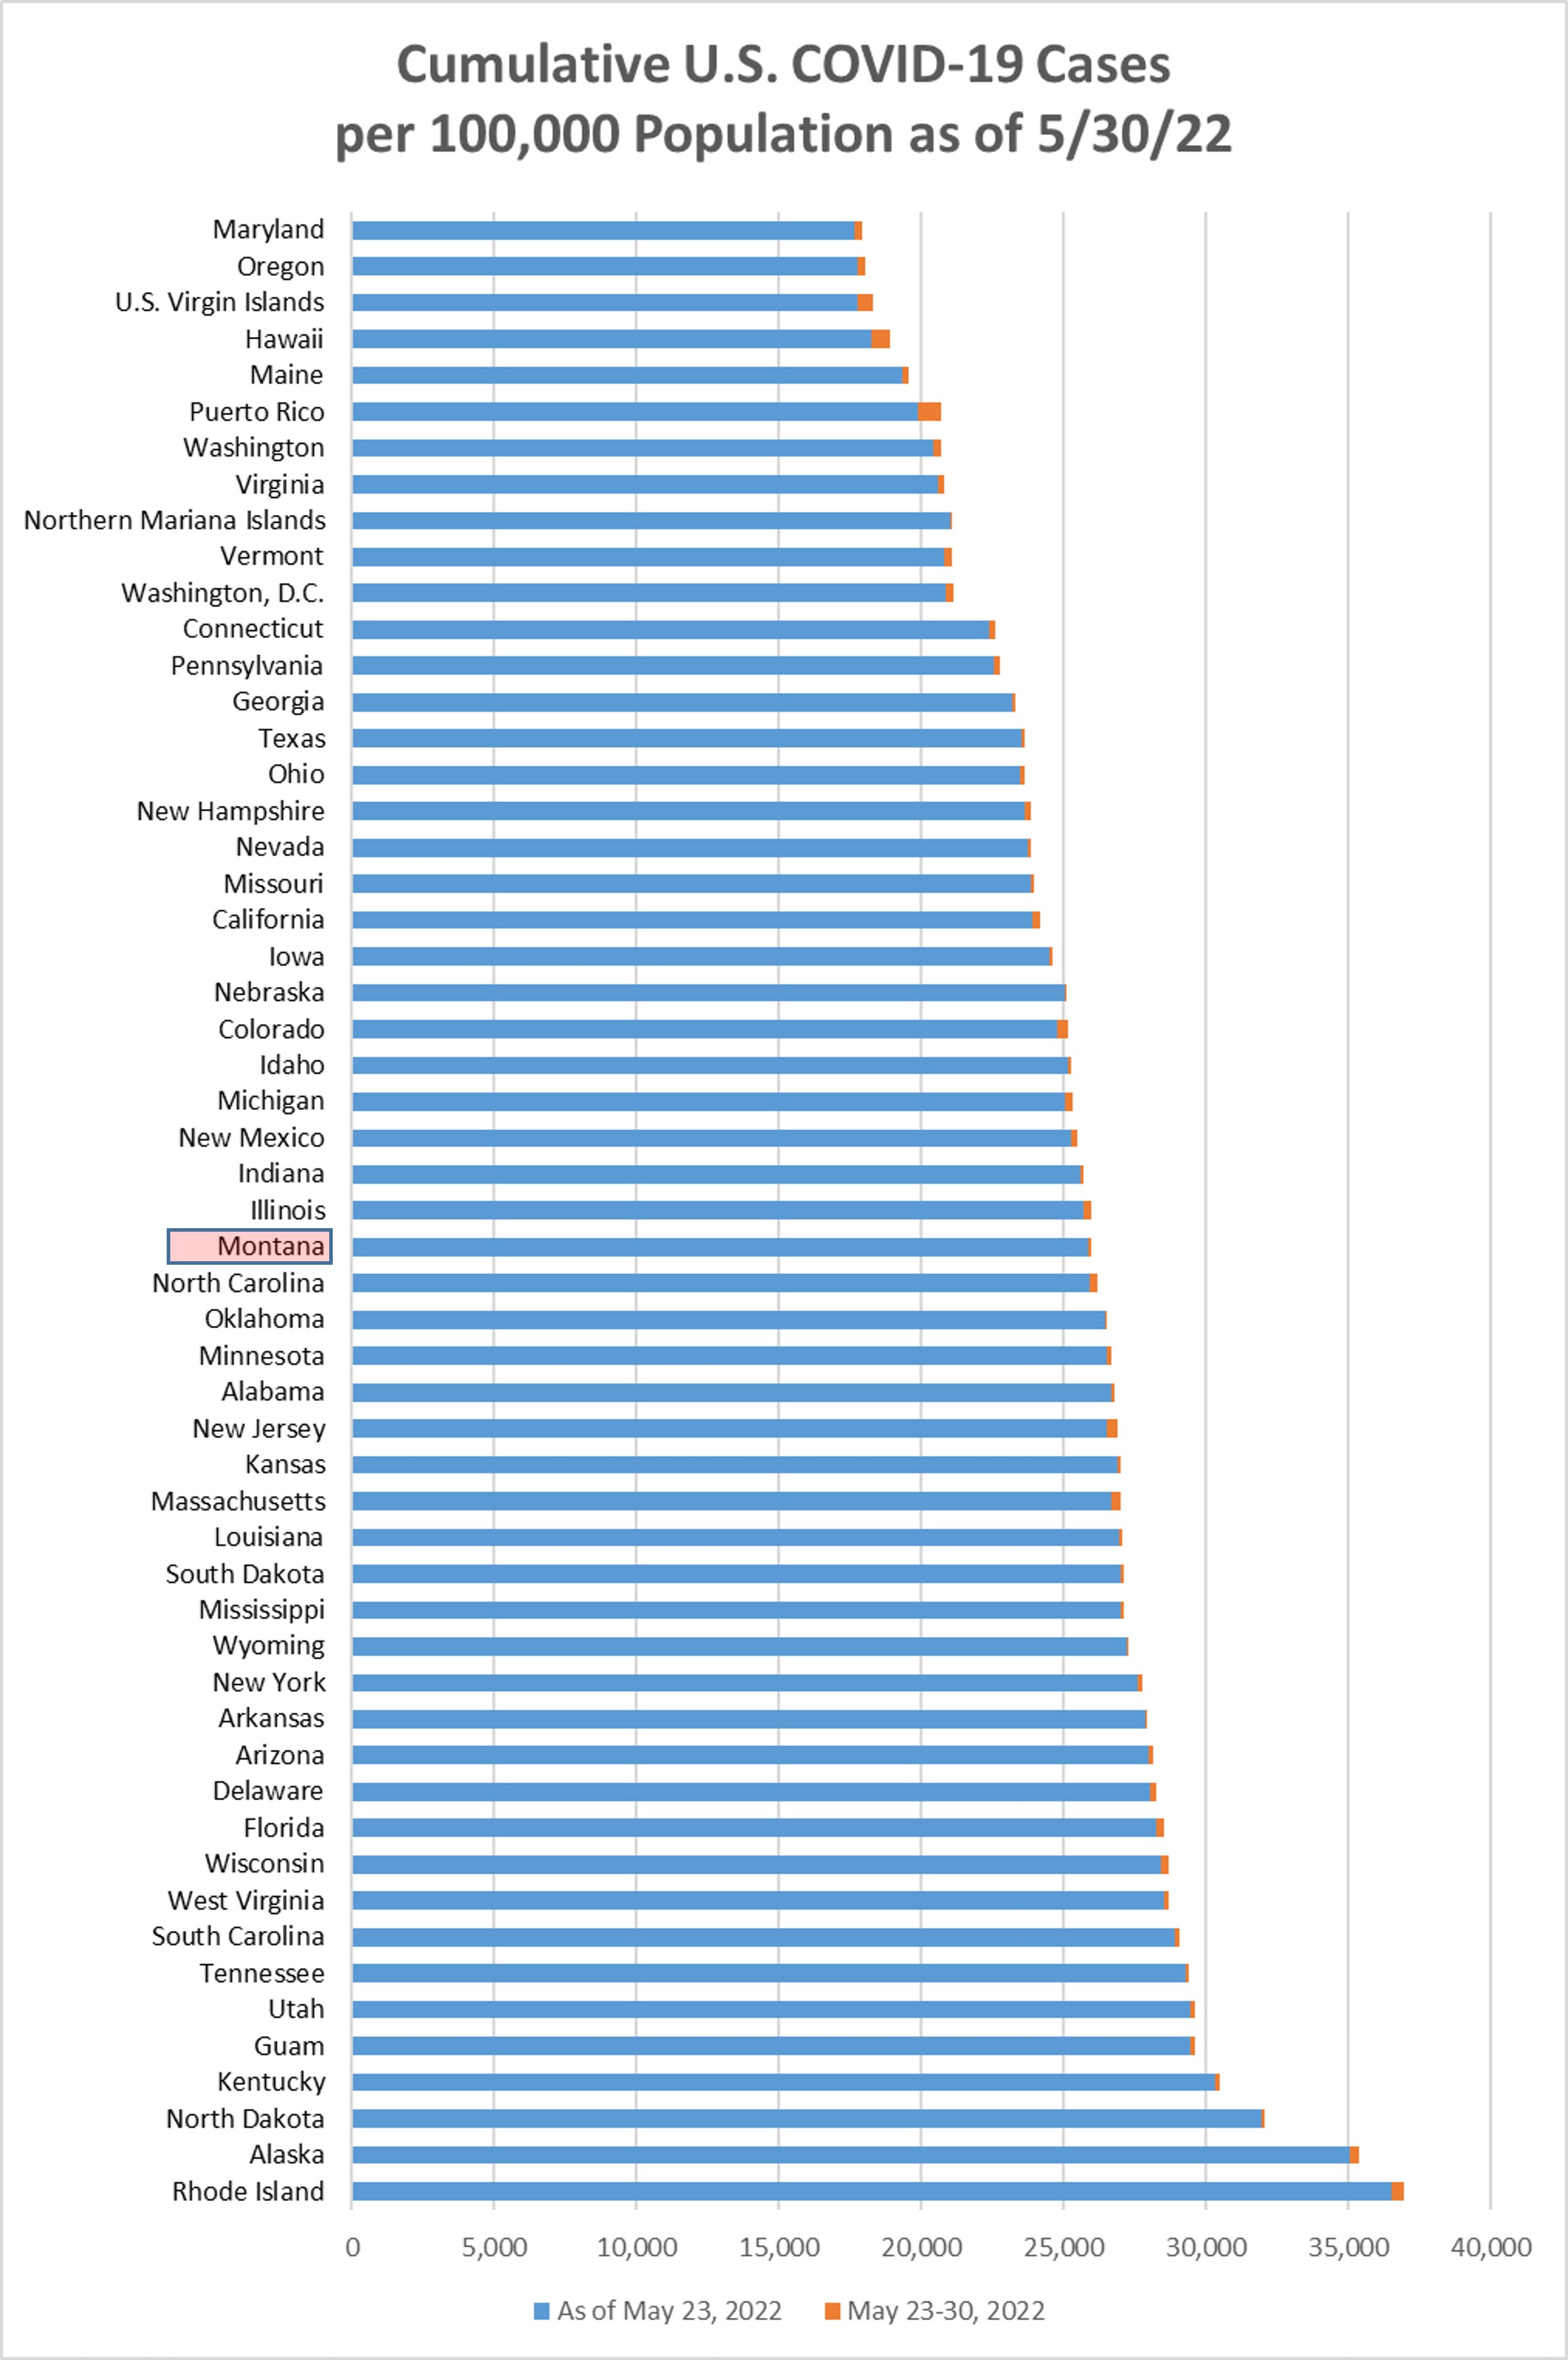
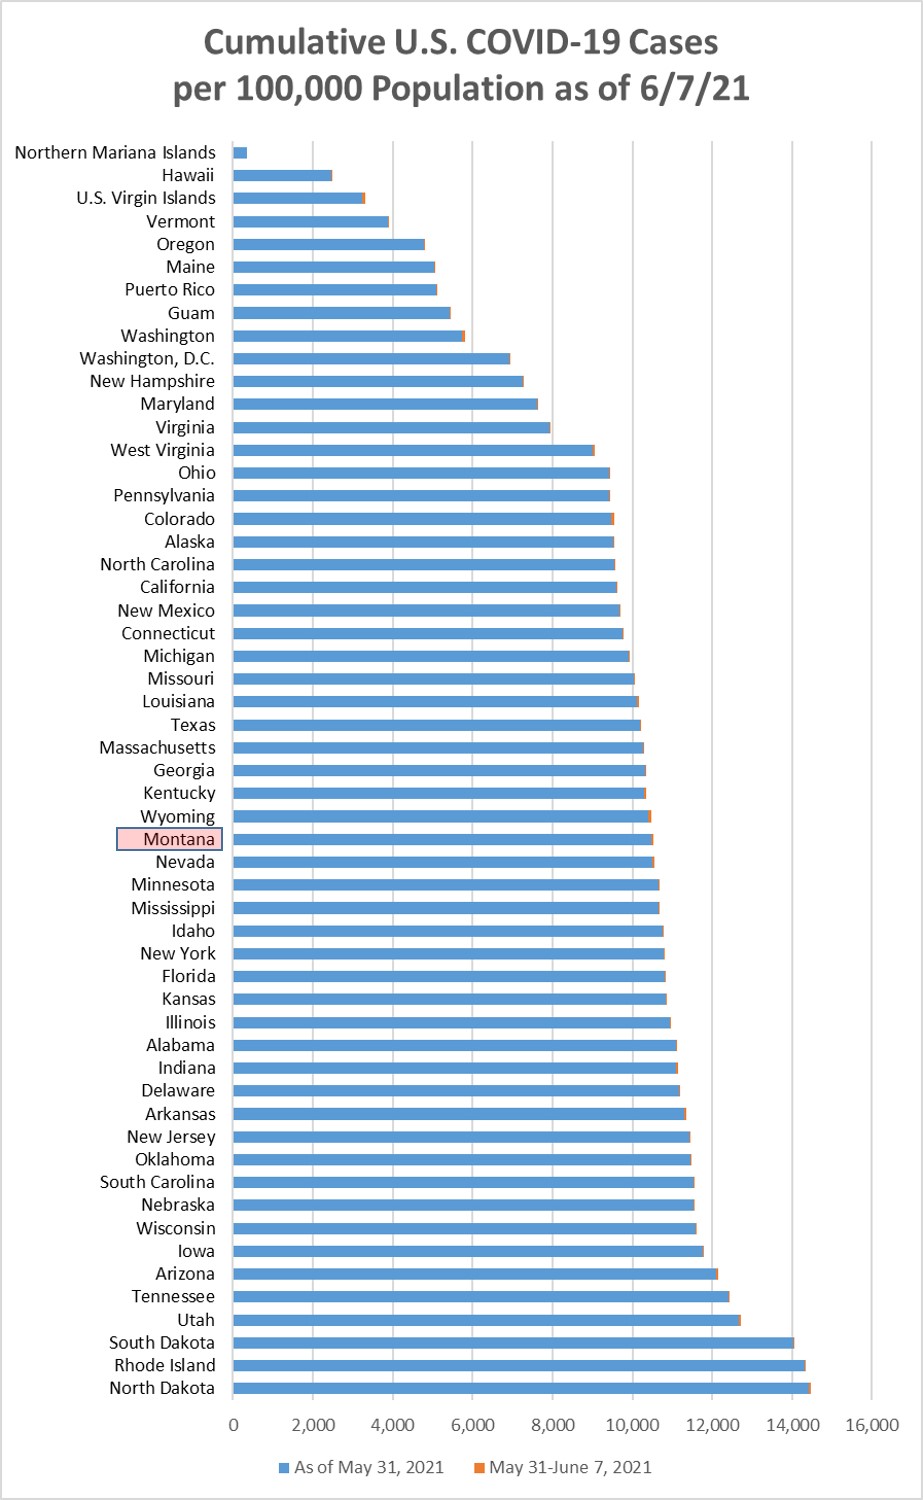
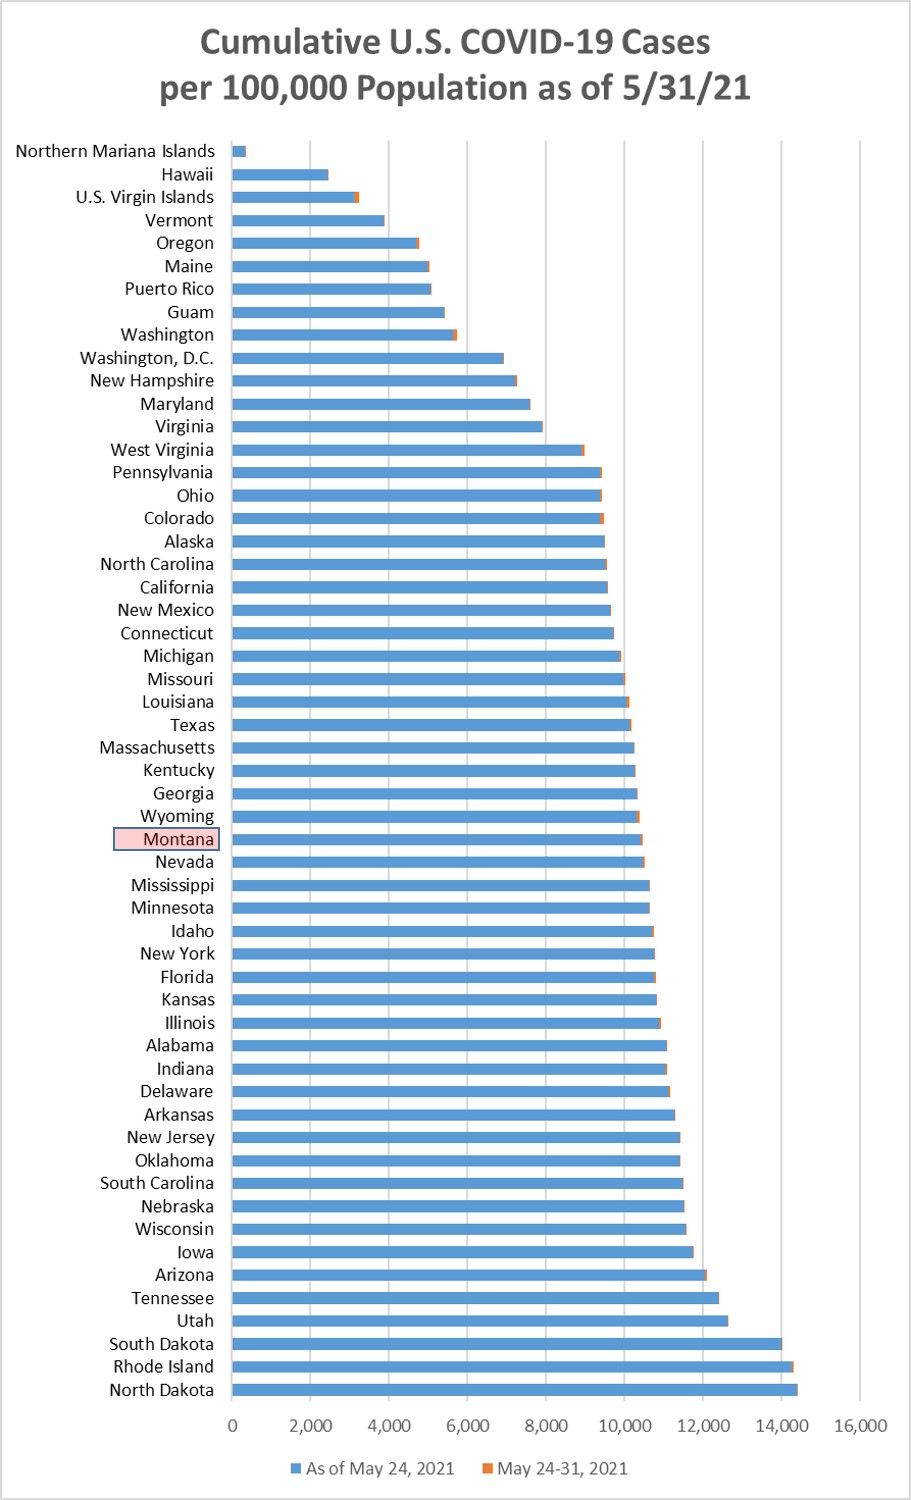
Chart 2 shows the same information as Chart 1, but with the overall cumulative cases
per 100k in each state to June 7. Montana stayed at 31/55 (25th highest).
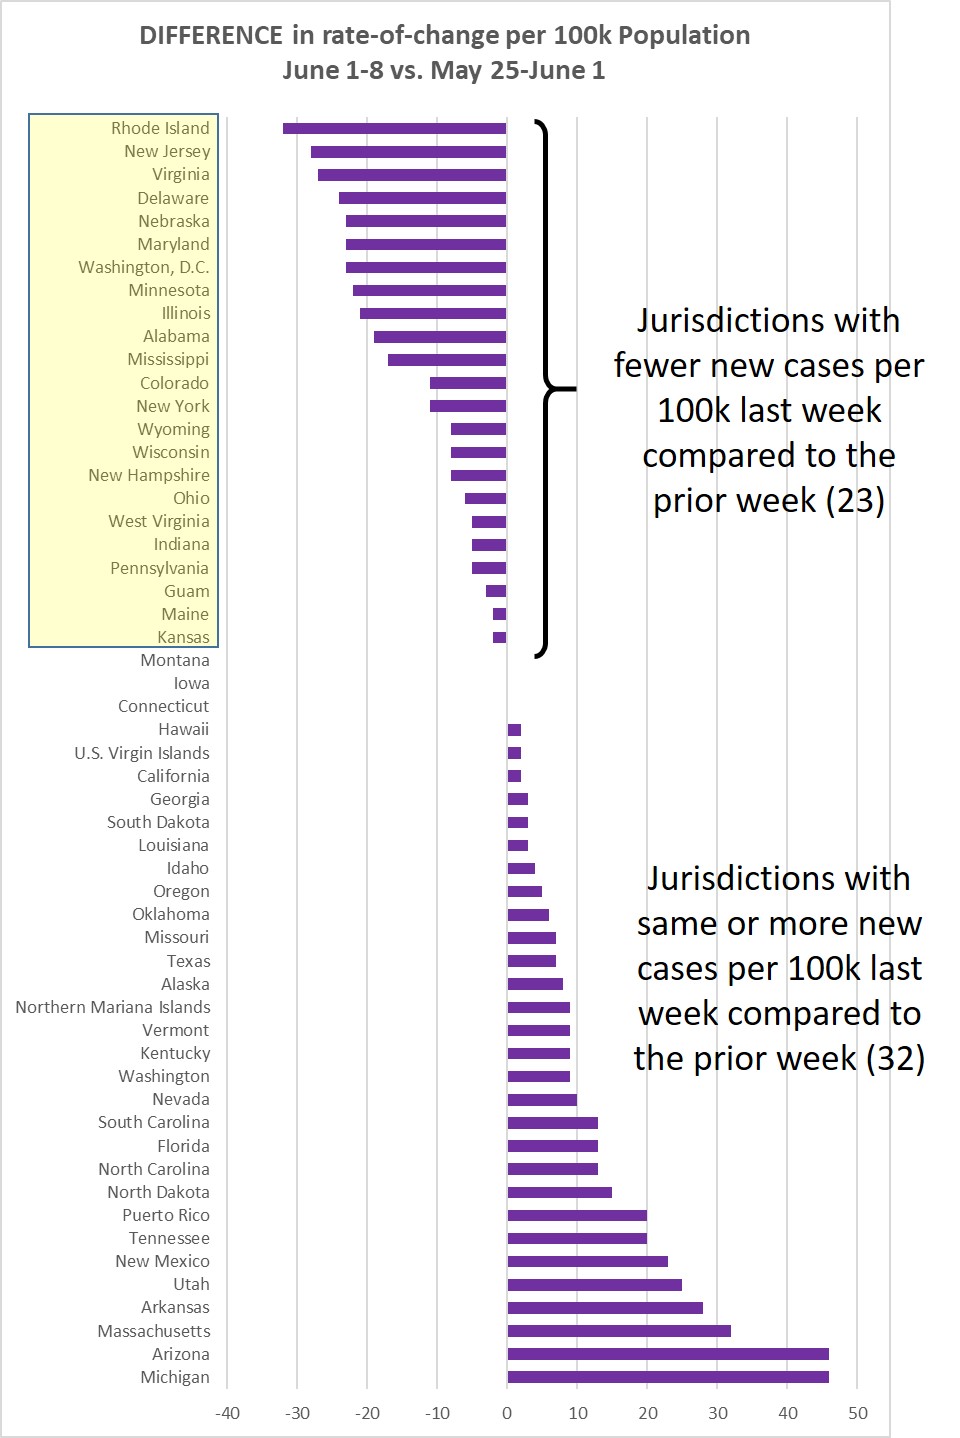
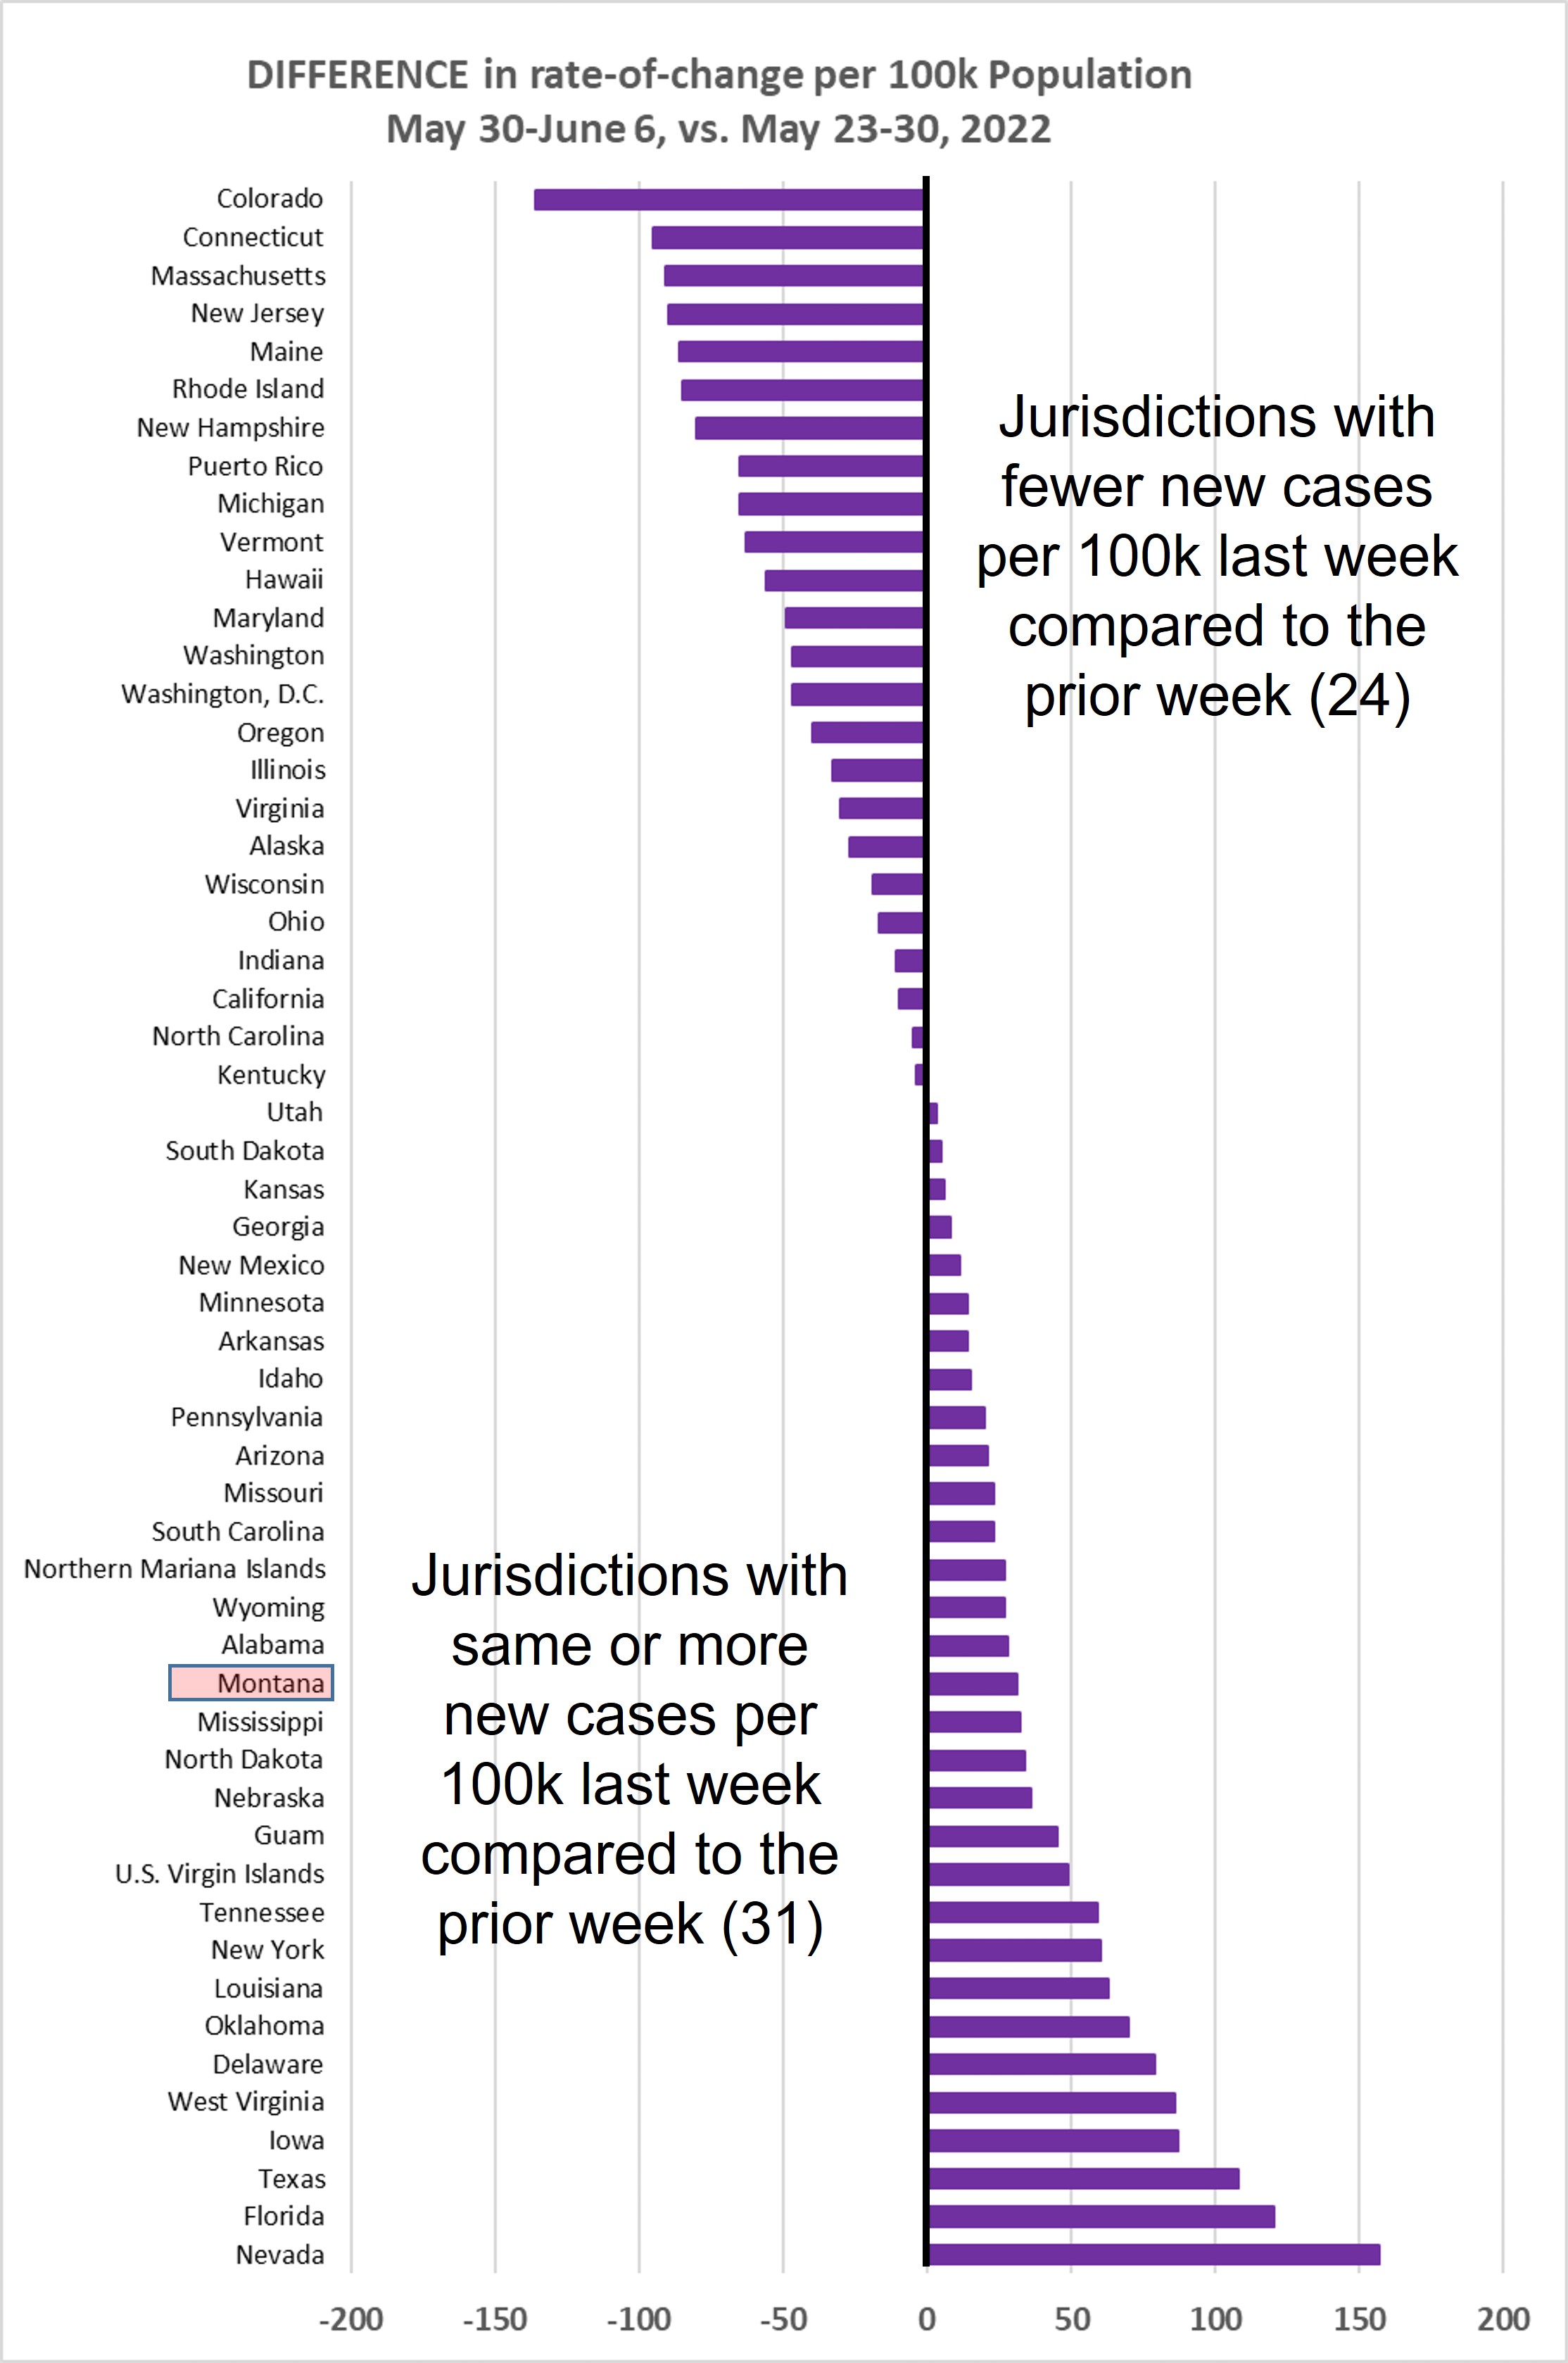
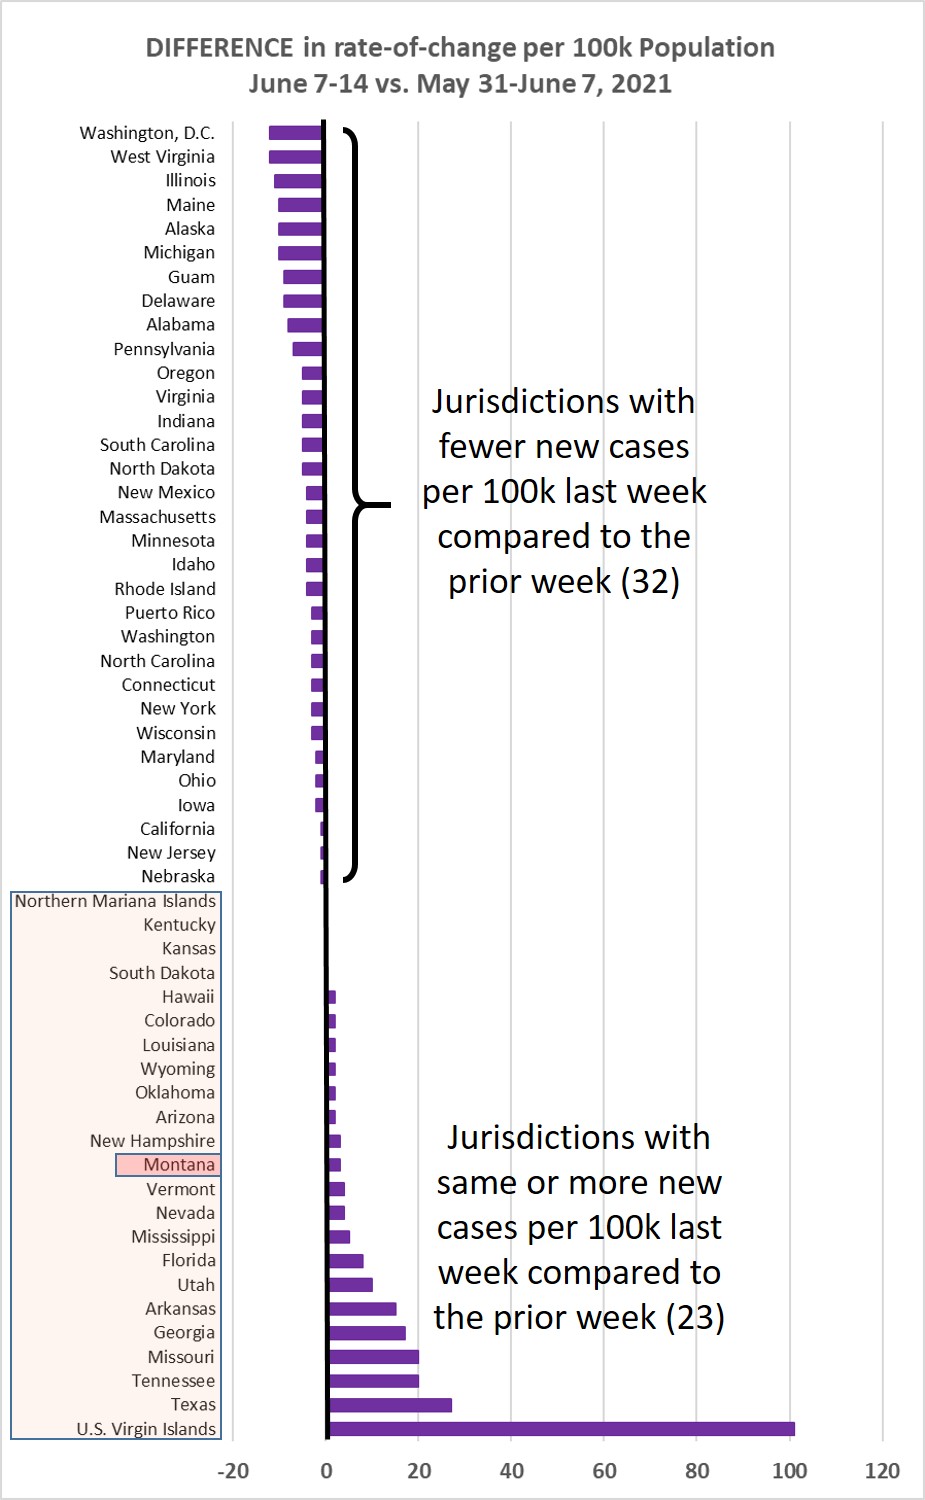
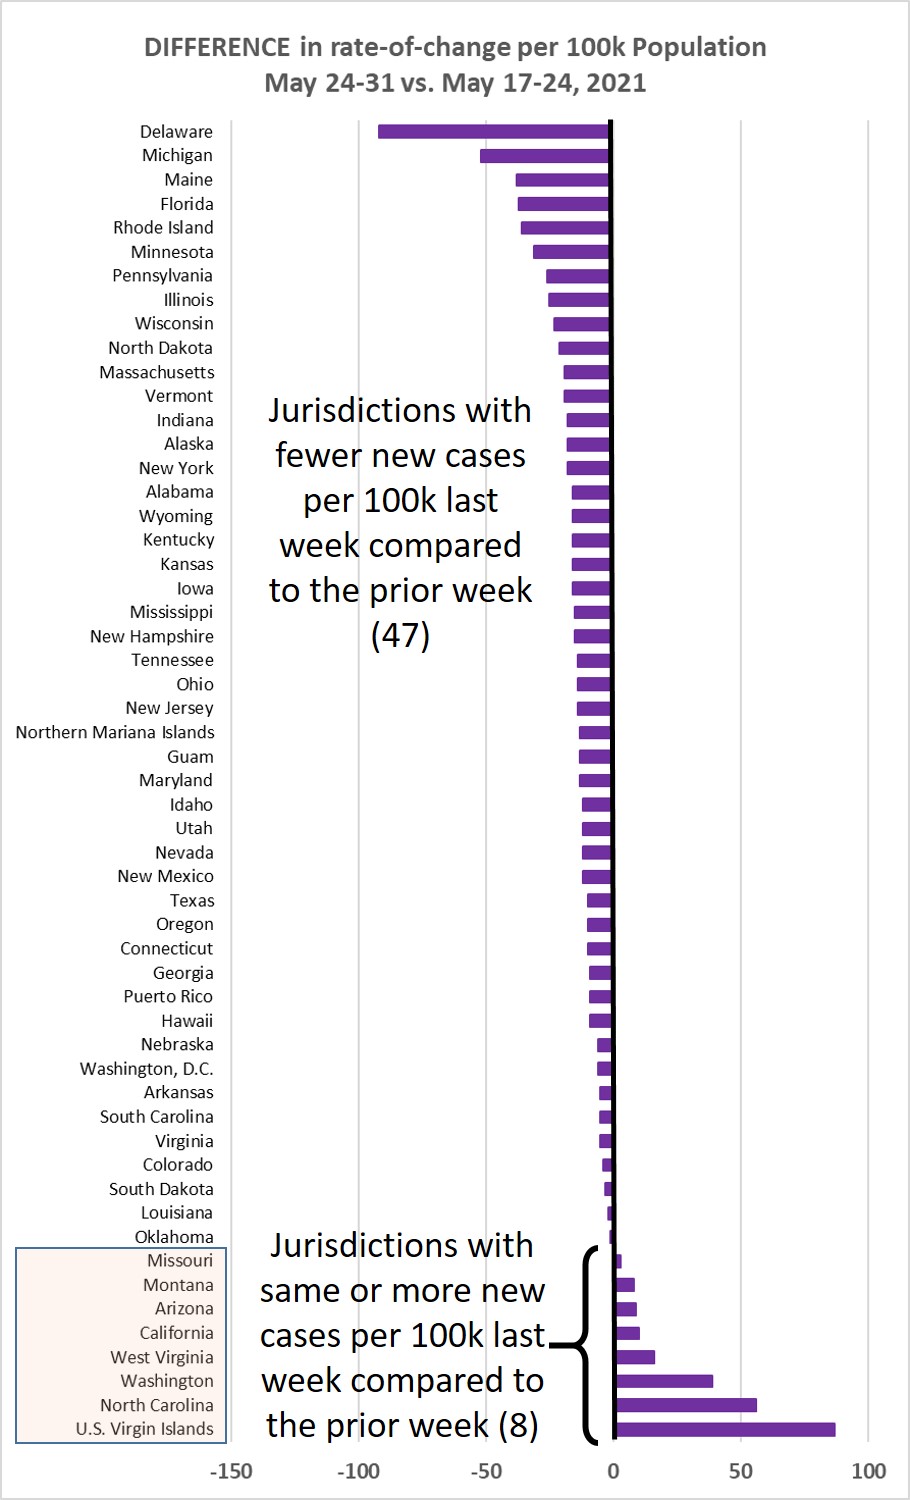
Chart 3 shows the difference in weekly new cases per 100k population for May 31-June
7, vs. May 24-31, 2021. This past week just 6/55 jurisdictions (10.9%) showed a higher
rate of new cases.
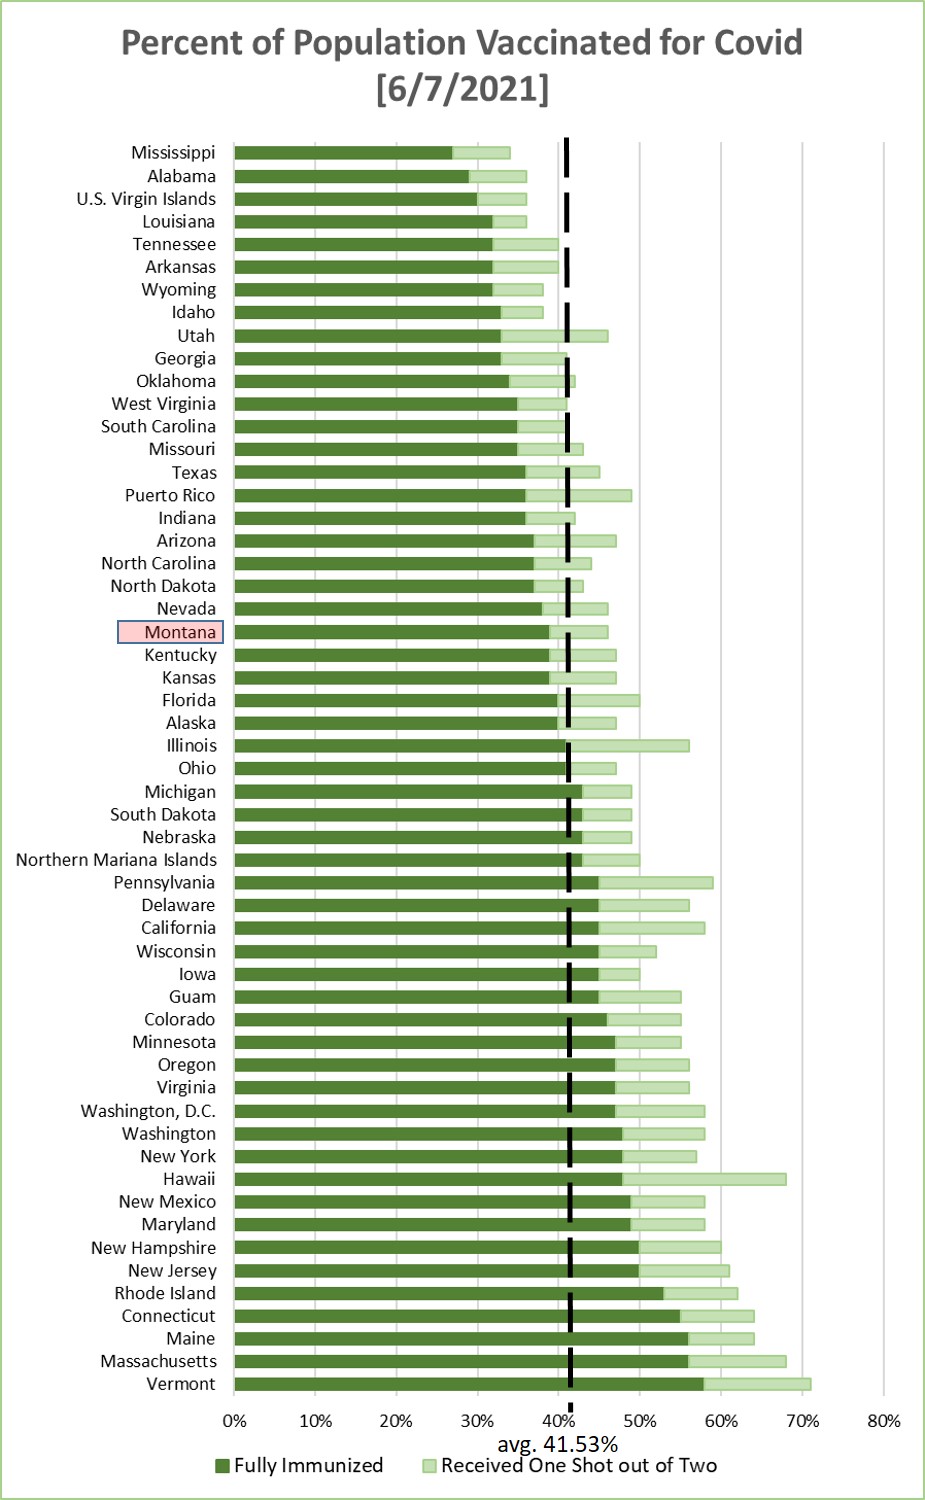
Chart 4 shows the percentage of the population in each jurisdiction having received
1 or 2 Covid-19 vaccination shots. This is sorted by the fraction that have received
2 shots--or one shot of the J&J vaccine. Average across the 55 jurisdictions is 41.53%
being fully immunized--a weekly increase of about 1.55%.
Monday, May 31, 2021
Memorial Day.

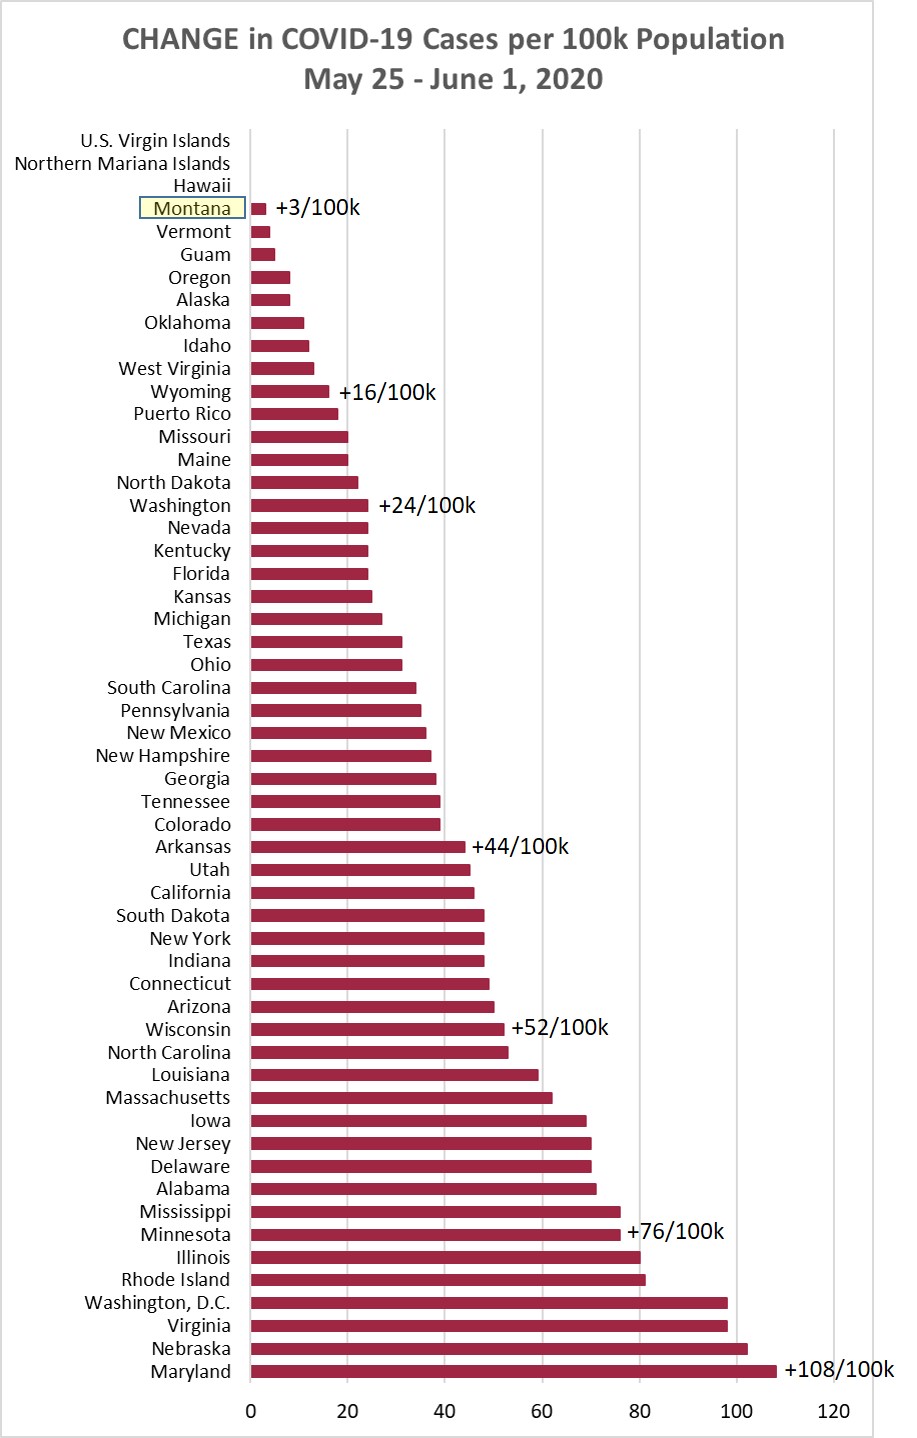
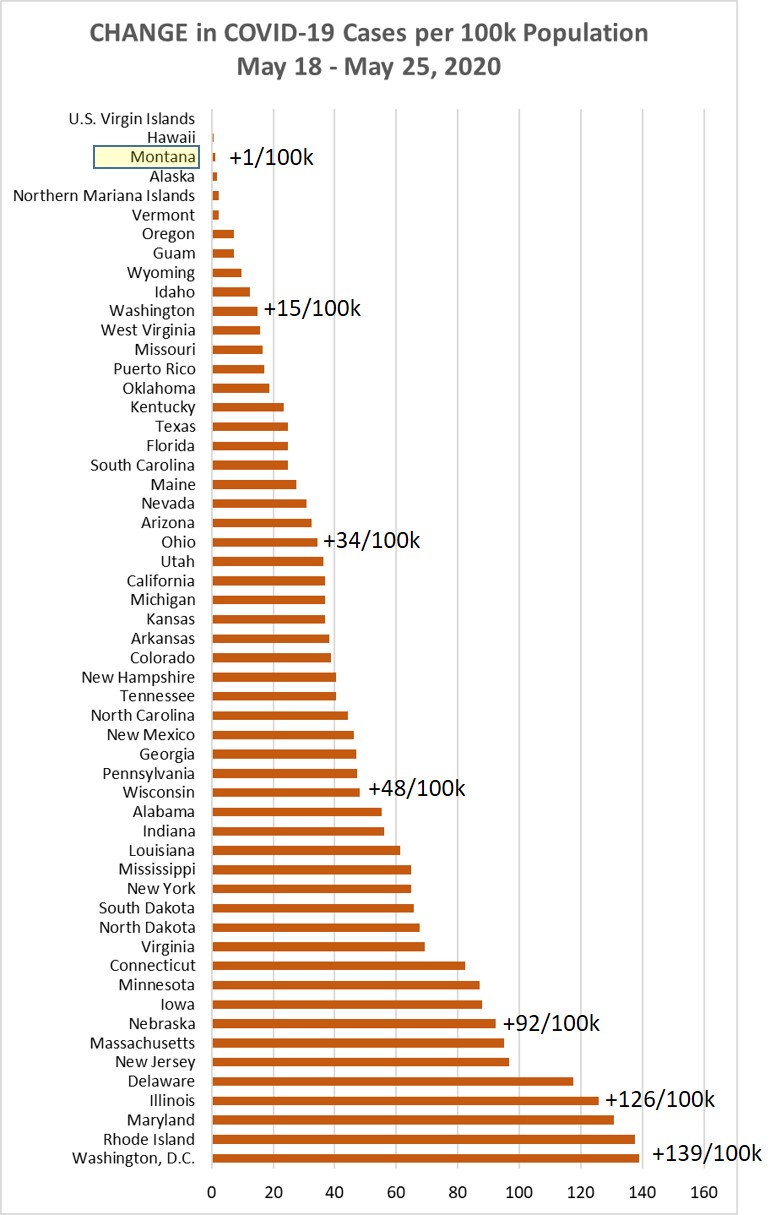
Chart 1 shows the change in cases per 100,000 population as of this morning (May 31,
2021) compared to the cases per 100,000 on May 24, 2021. Montana was up +57/100k this
week, compared to +49/100k the prior week, and +71/100k the week before that.
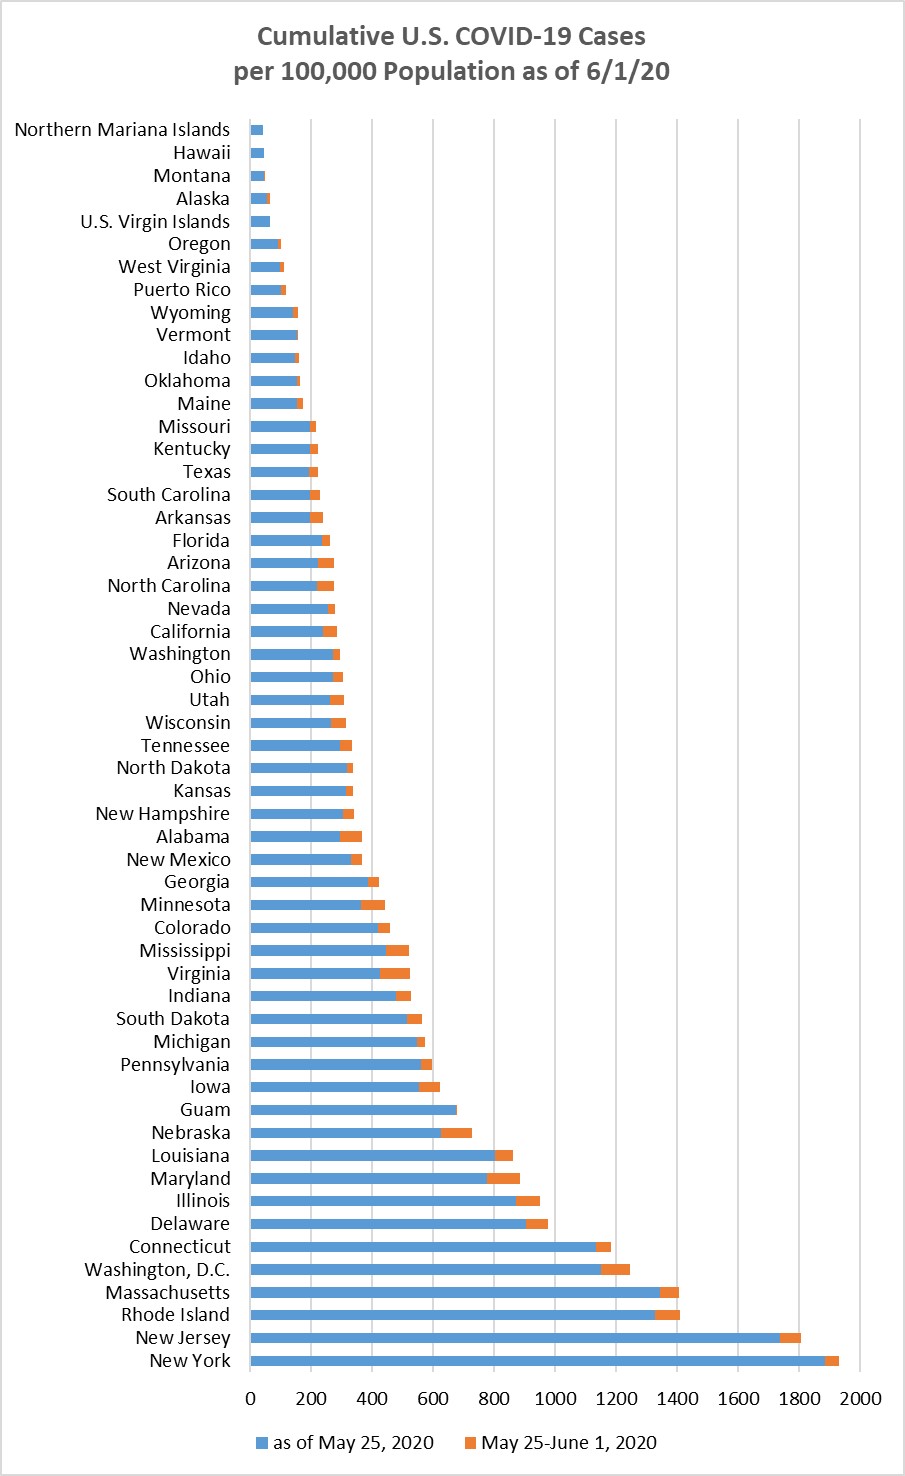
Chart 2 shows the same information as Chart 1, but with the overall cumulative cases
per 100k in each state to May 31. Montana stayed at 31/55 (25th highest).
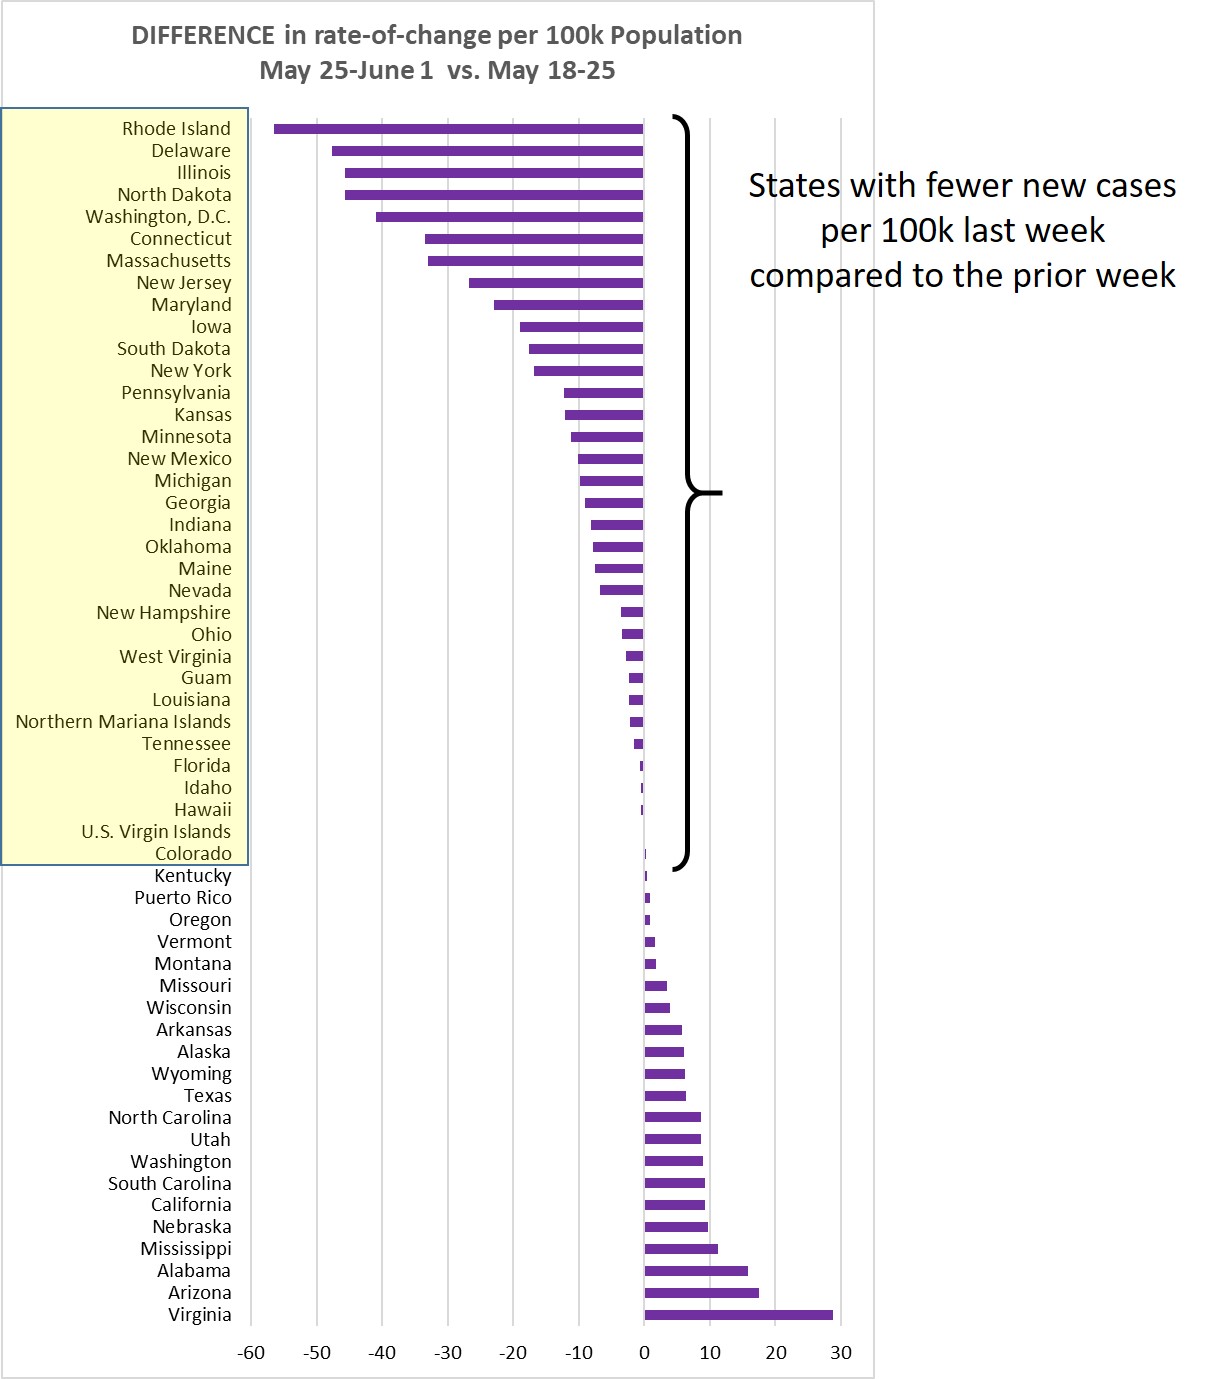
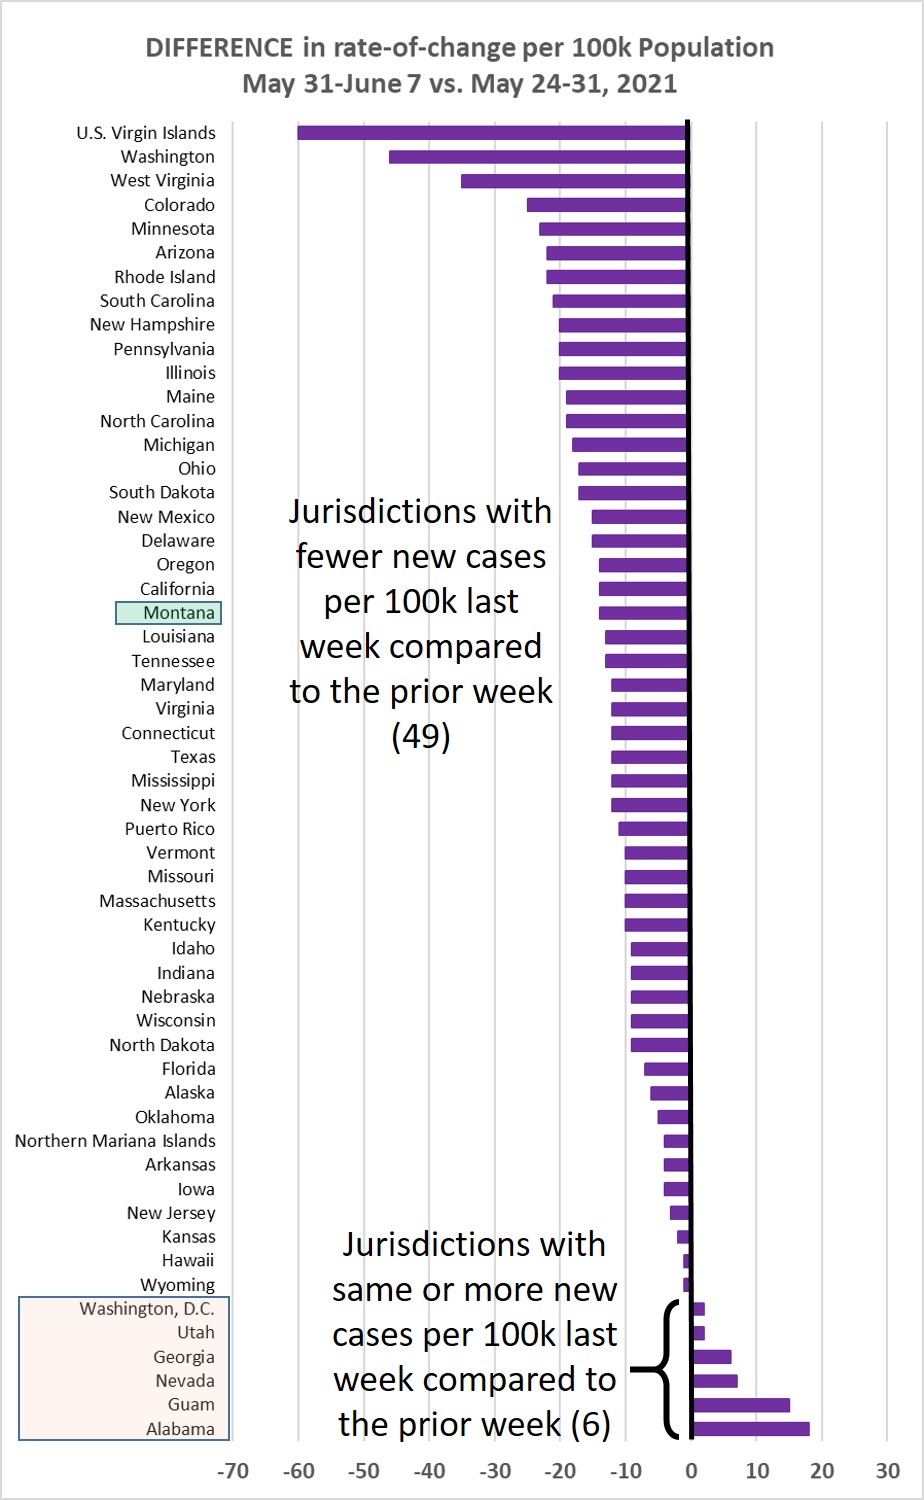
Chart 3 shows the difference in weekly new cases per 100k population for May 24-31,
vs. May 17-24, 2021. This past week 8/55 jurisdictions (14.5%) showed a higher rate
of new cases.
Chart 4 shows the percentage of the population in each jurisdiction having received
1 or 2 Covid-19 vaccination shots. This is sorted by the fraction that have received
2 shots--or one shot of the J&J vaccine. Average across the 55 jurisdictions is 39.98%
being fully immunized--a weekly increase of about 1.1%.

Monday, May 24, 2021
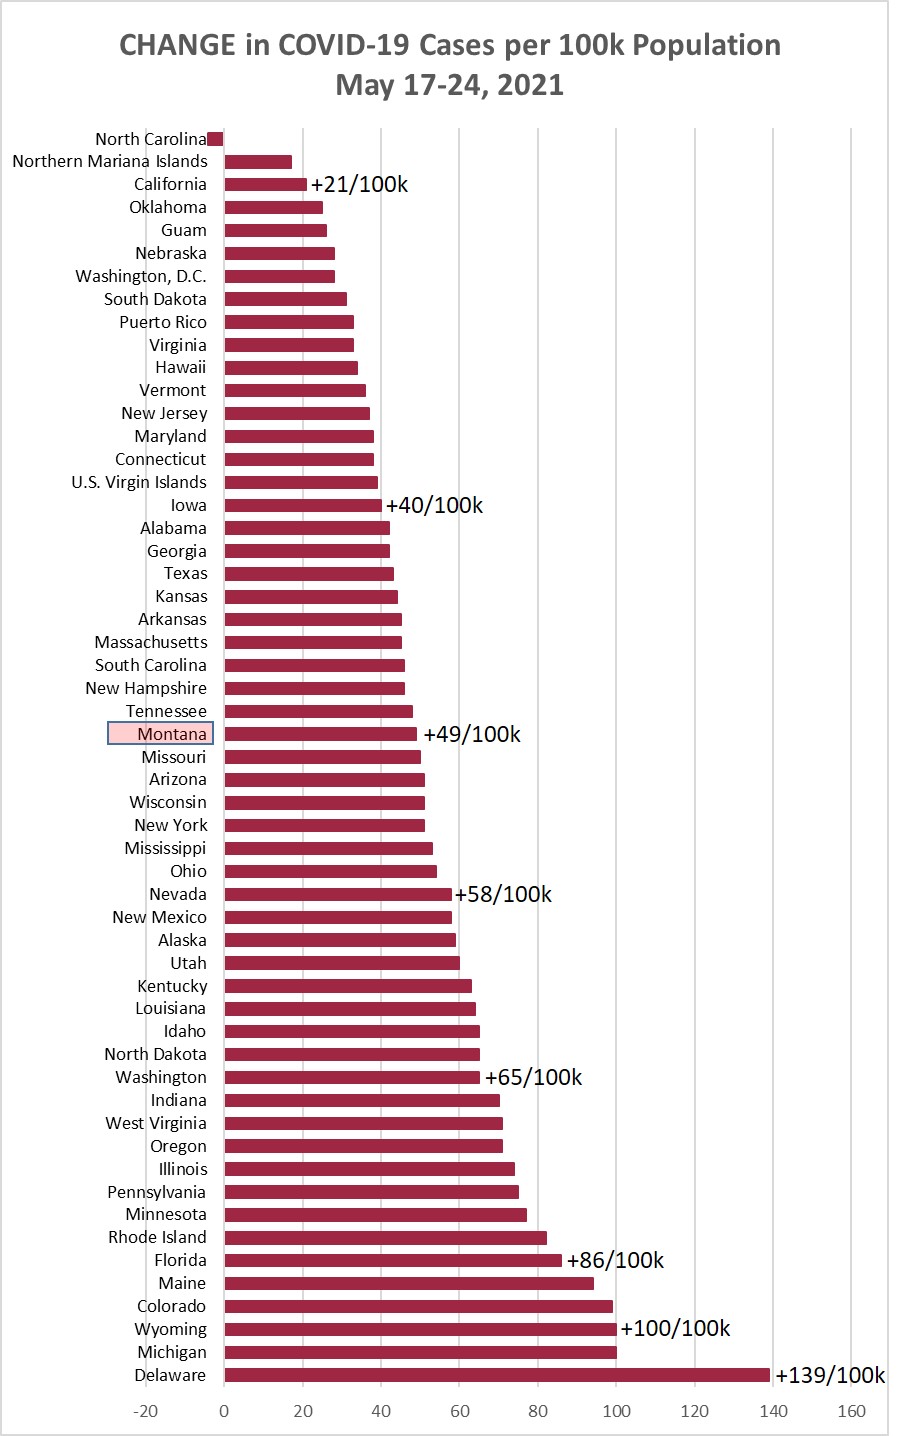
Chart 1 shows the change in cases per 100,000 population as of this morning (May 24,
2021) compared to the cases per 100,000 on May 17, 2021. North Carolina had a data
correction this week. Montana was up +49/100k this week, compared to +71/100k last
week.

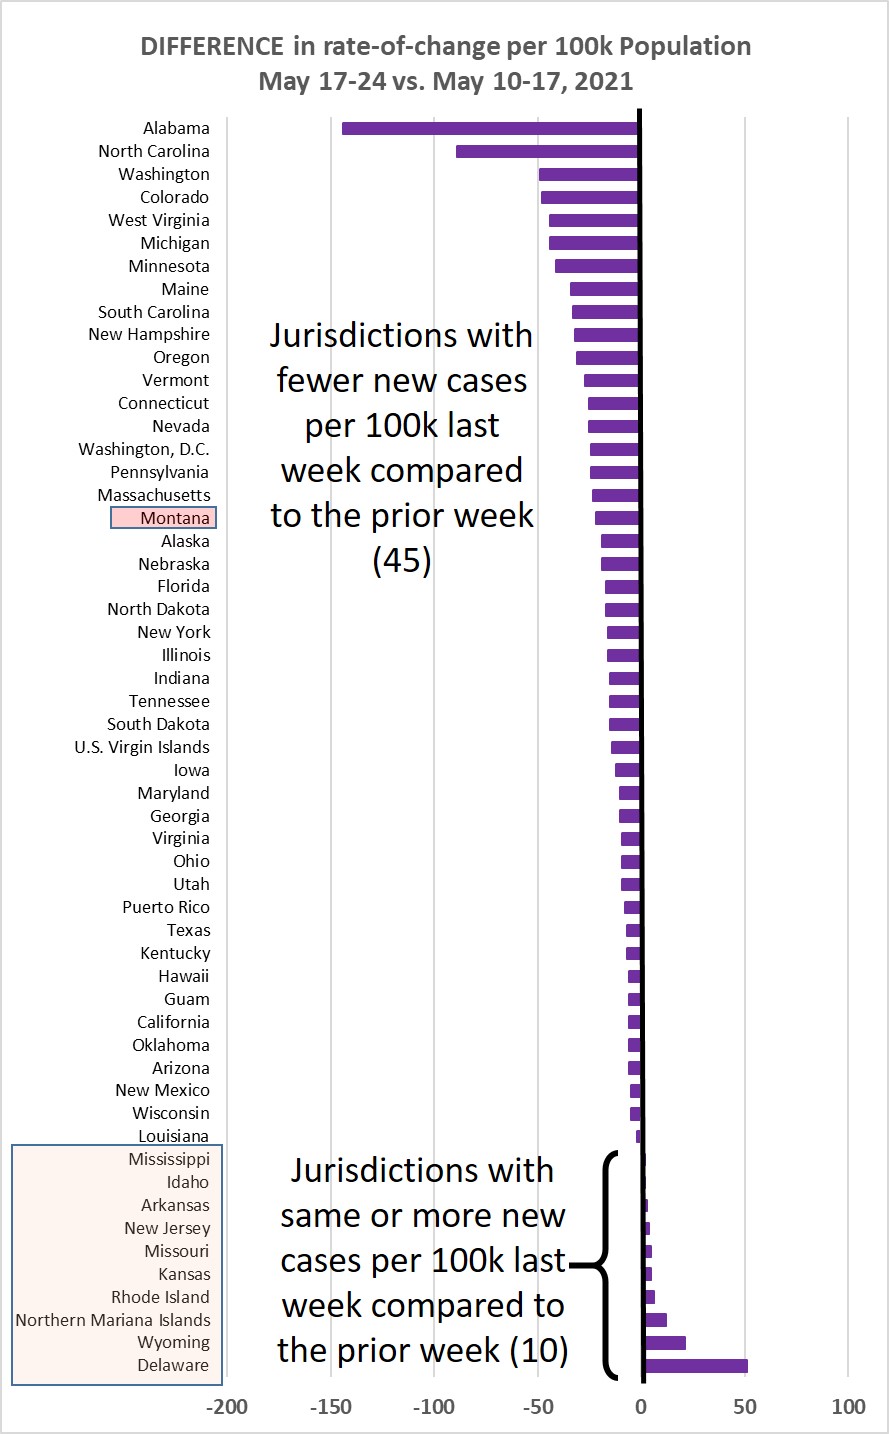
Chart 2 shows the same information as Chart 1, but with the overall cumulative cases
per 100k in each state to May 24. Montana stayed at 31/55 (25th highest).
Chart 3 shows the difference in weekly new cases per 100k population for May 17-24,
vs. May 10-17, 2021. This past week 10/55 jurisdictions (18.2%) showed a higher rate
of new cases. The swings in Alabama and North Carolina are due primarily to recent
data adjustments in those states.
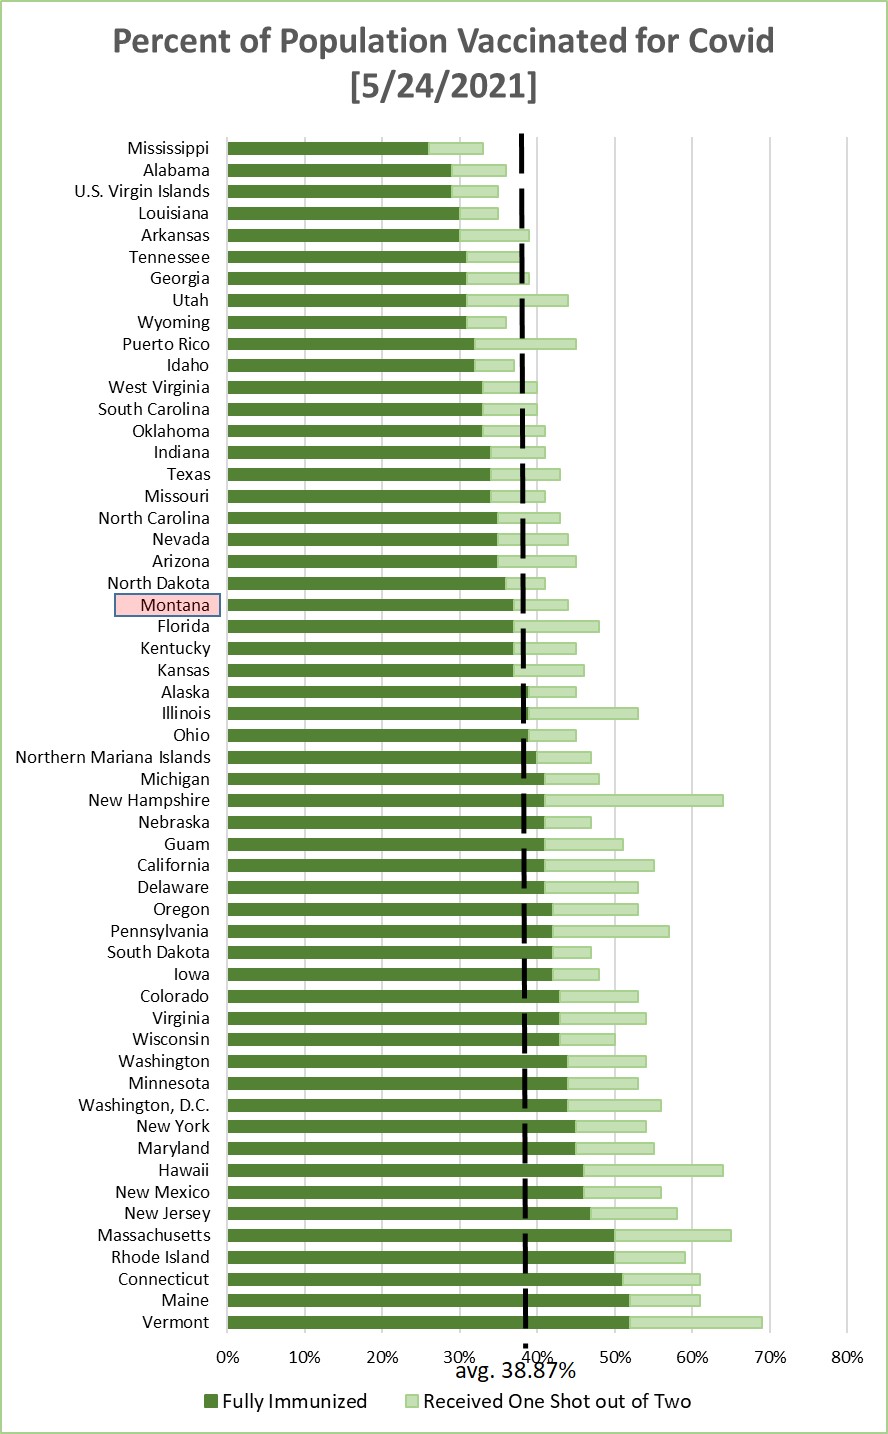
Chart 4 shows the percentage of the population in each jurisdiction having received
1 or 2 Covid-19 vaccination shots. This is sorted by the fraction that have received
2 shots--or one shot of the J&J vaccine. Average across the 55 jurisdictions is 38.9%
being fully immunized--a weekly increase of about 1.6%.

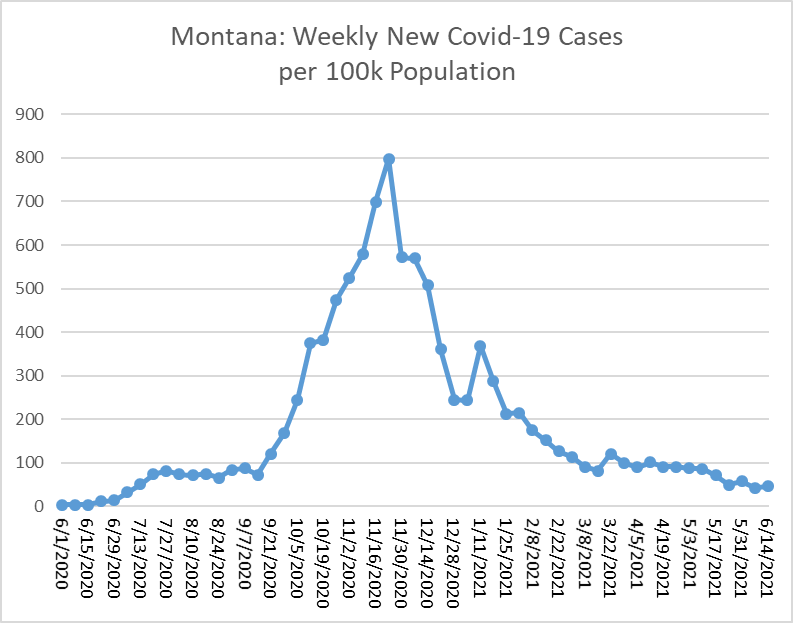
Montana Trend
Monday, May 17, 2021
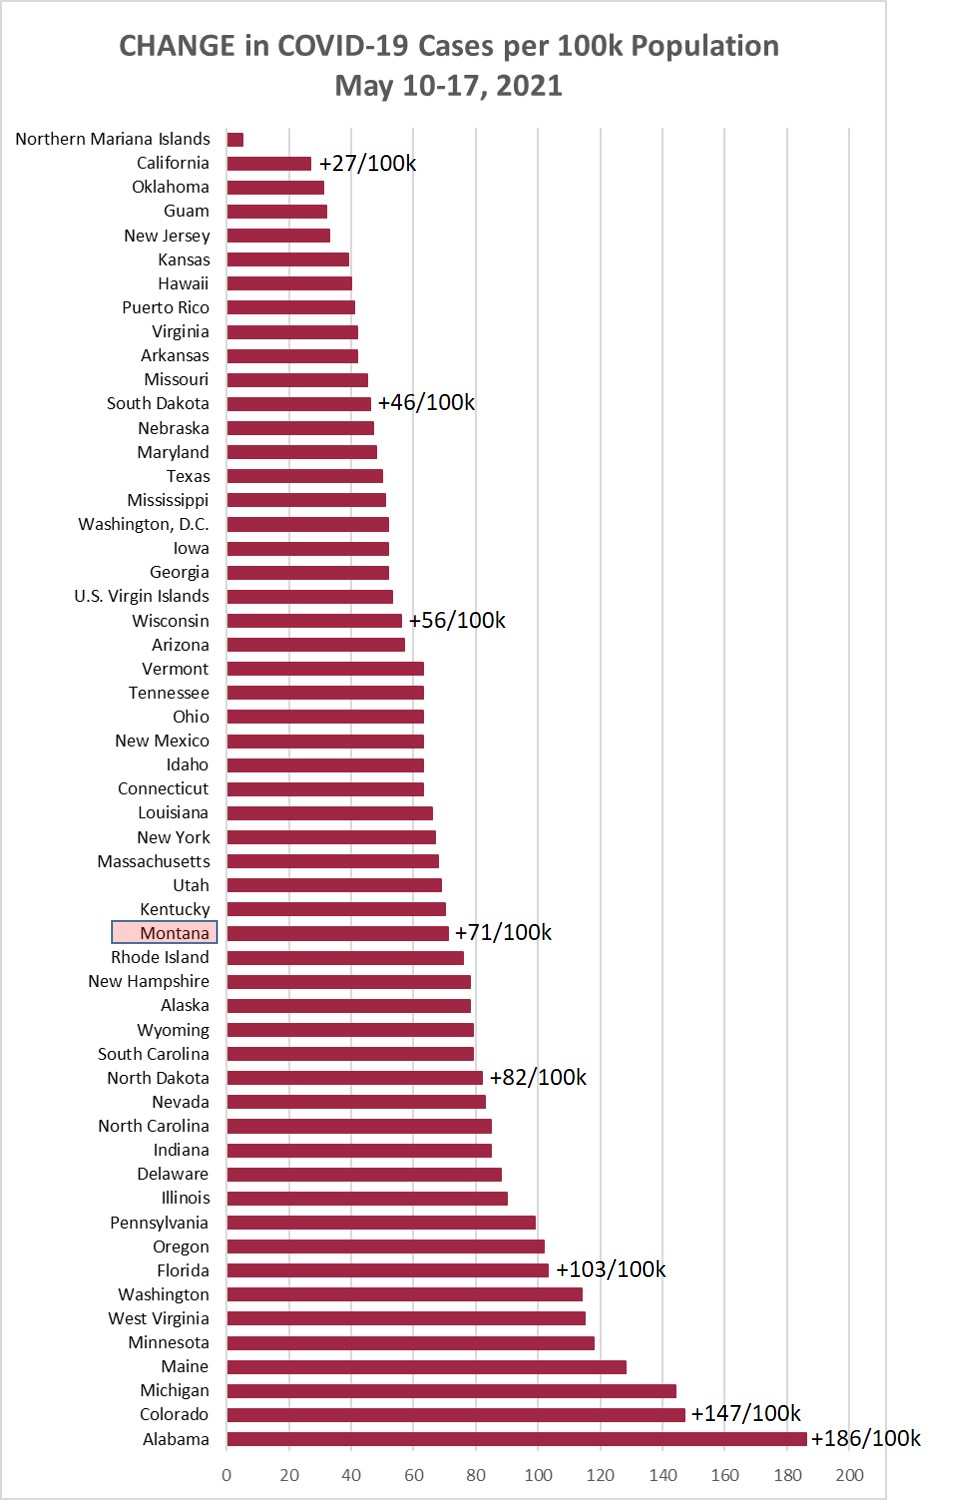
Chart 1 shows the change in cases per 100,000 population as of this morning (May 17,
2021) compared to the cases per 100,000 on May 10, 2021. Montana was up +71/100k this
week, compared to +86/100k last week.
Chart 2 shows the same information as Chart 1, but with the overall cumulative cases
per 100k in each state to May 17. Montana stayed at 31/55 (25th highest).
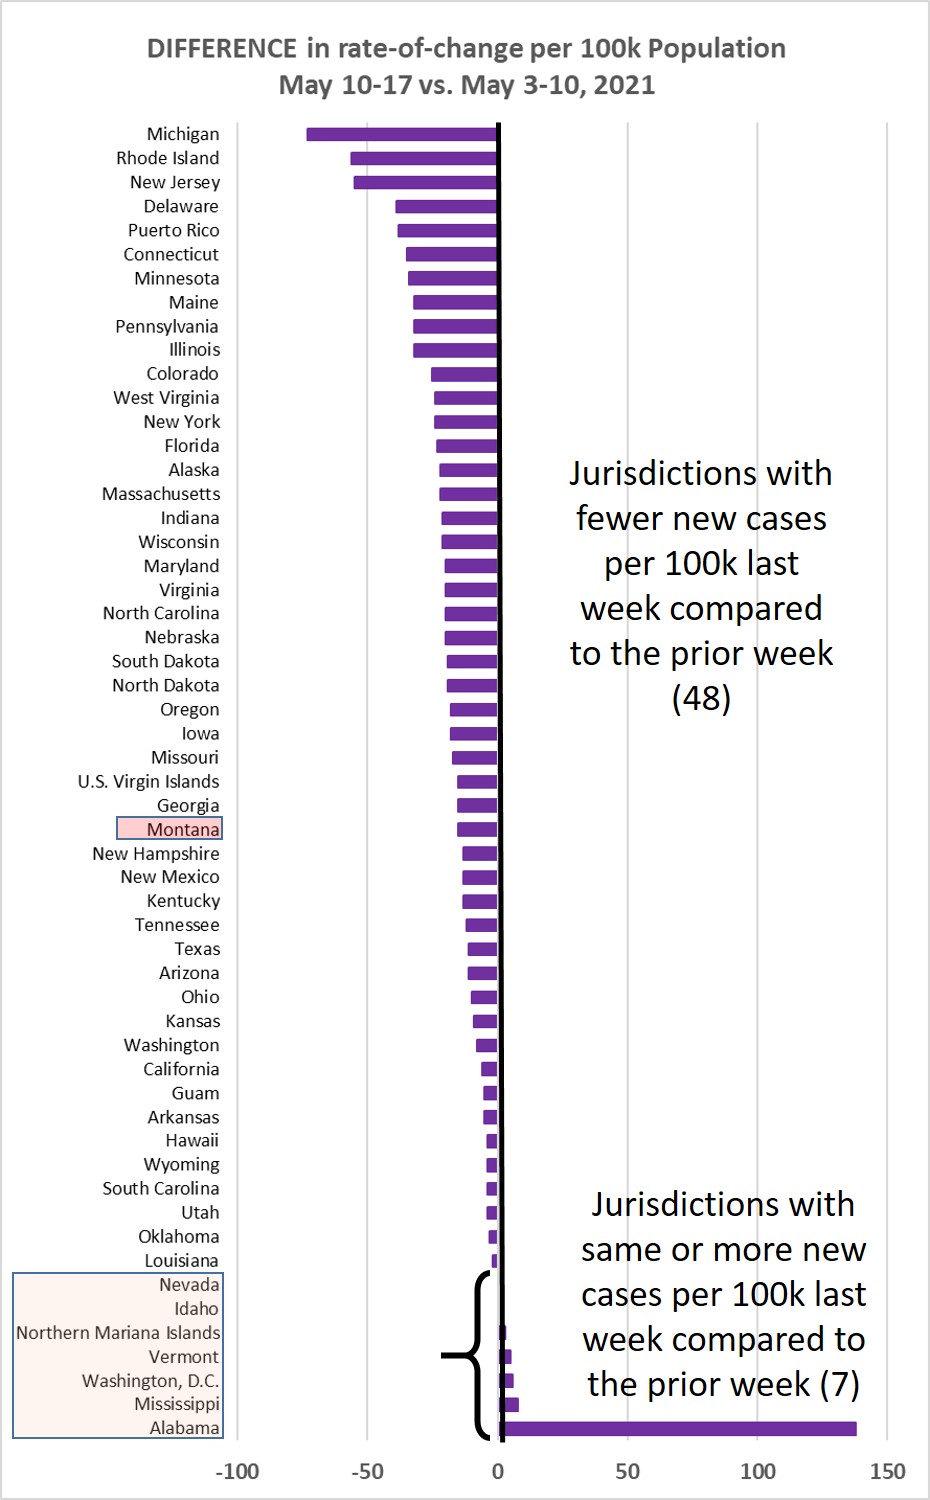
Chart 3 shows the difference in weekly new cases per 100k population for May 10-17,
vs. May 3-10, 2021. This past week only 7/55 jurisdictions (12.7%) showed a higher
rate of new cases, and the big blip in Alabama was due primarily to that state catching
up on some missing cases.
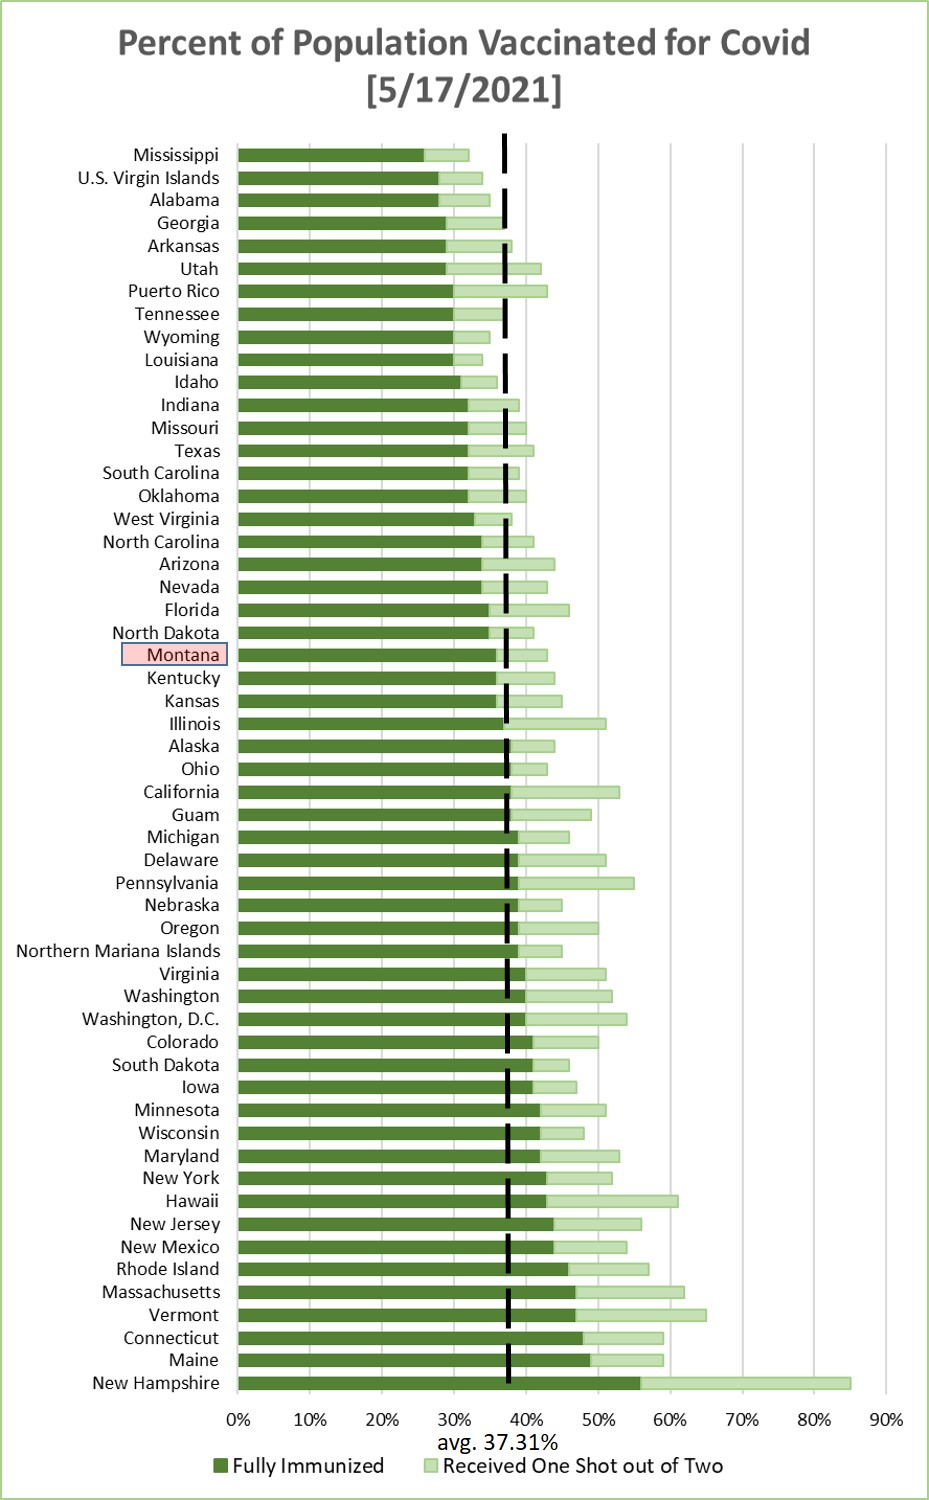
Chart 4 shows the percentage of the population in each jurisdiction having received
1 or 2 Covid-19 vaccination shots. This is sorted by the fraction that have received
2 shots--or one shot of the J&J vaccine. Average across the 55 jurisdictions is 37.3%
being fully immunized--a weekly increase of about 2.8%.

Monday, May 10, 2021
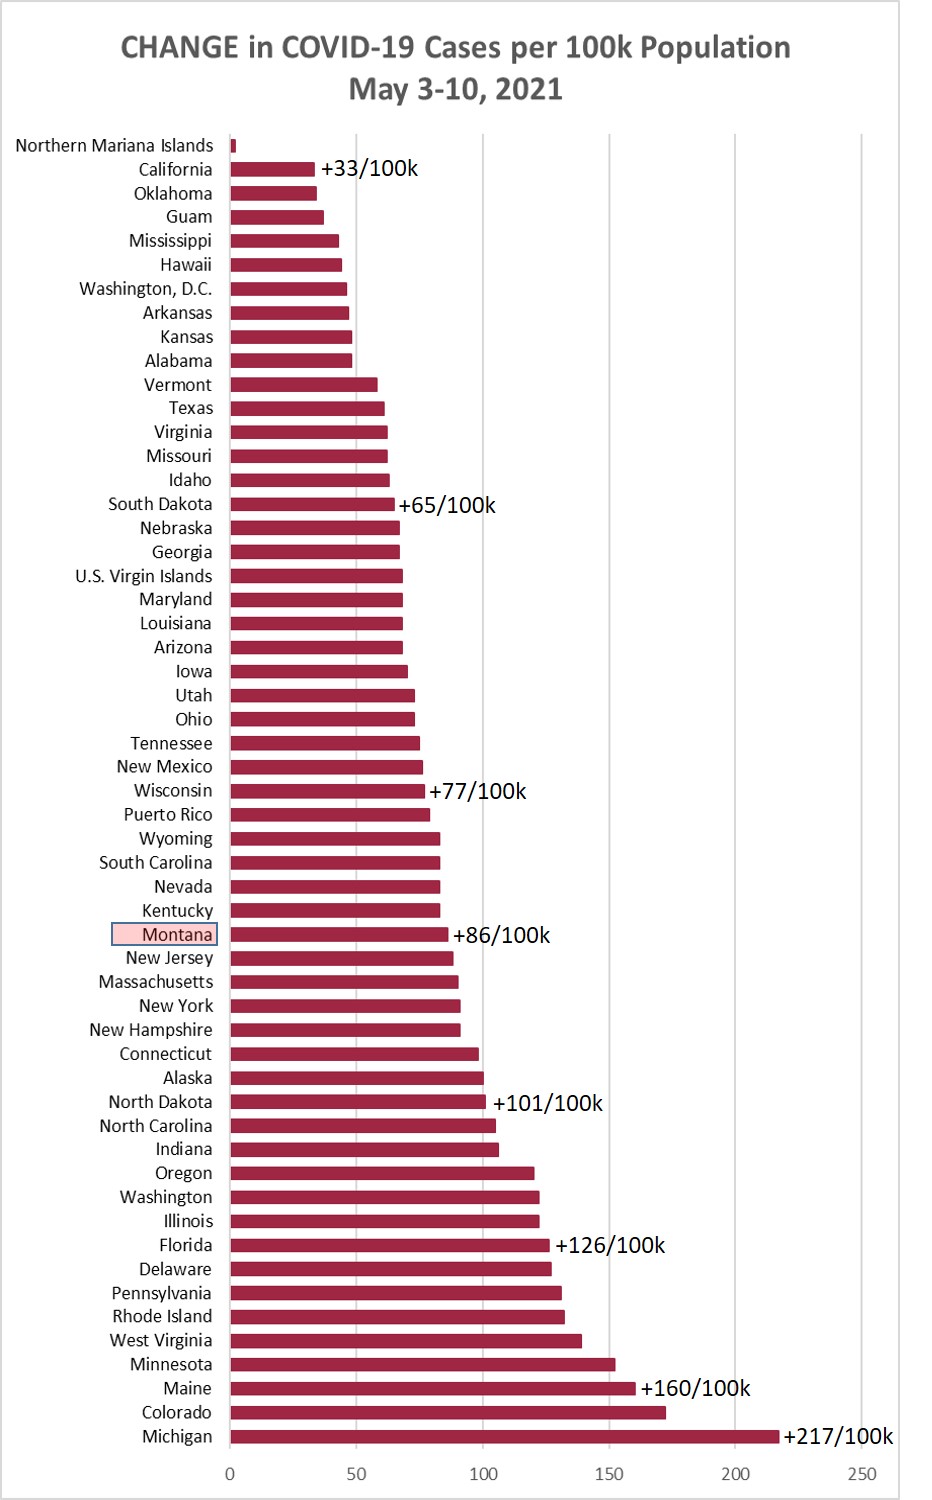
Chart 1 shows the change in cases per 100,000 population as of this morning (May 10,
2021) compared to the cases per 100,000 on May 3, 2021. Montana was up +86/100k this
week, compared to +87/100k last week.
Chart 2 shows the same information as Chart 1, but with the overall cumulative cases
per 100k in each state to May 10. Montana stayed at 31/55 (25th highest).
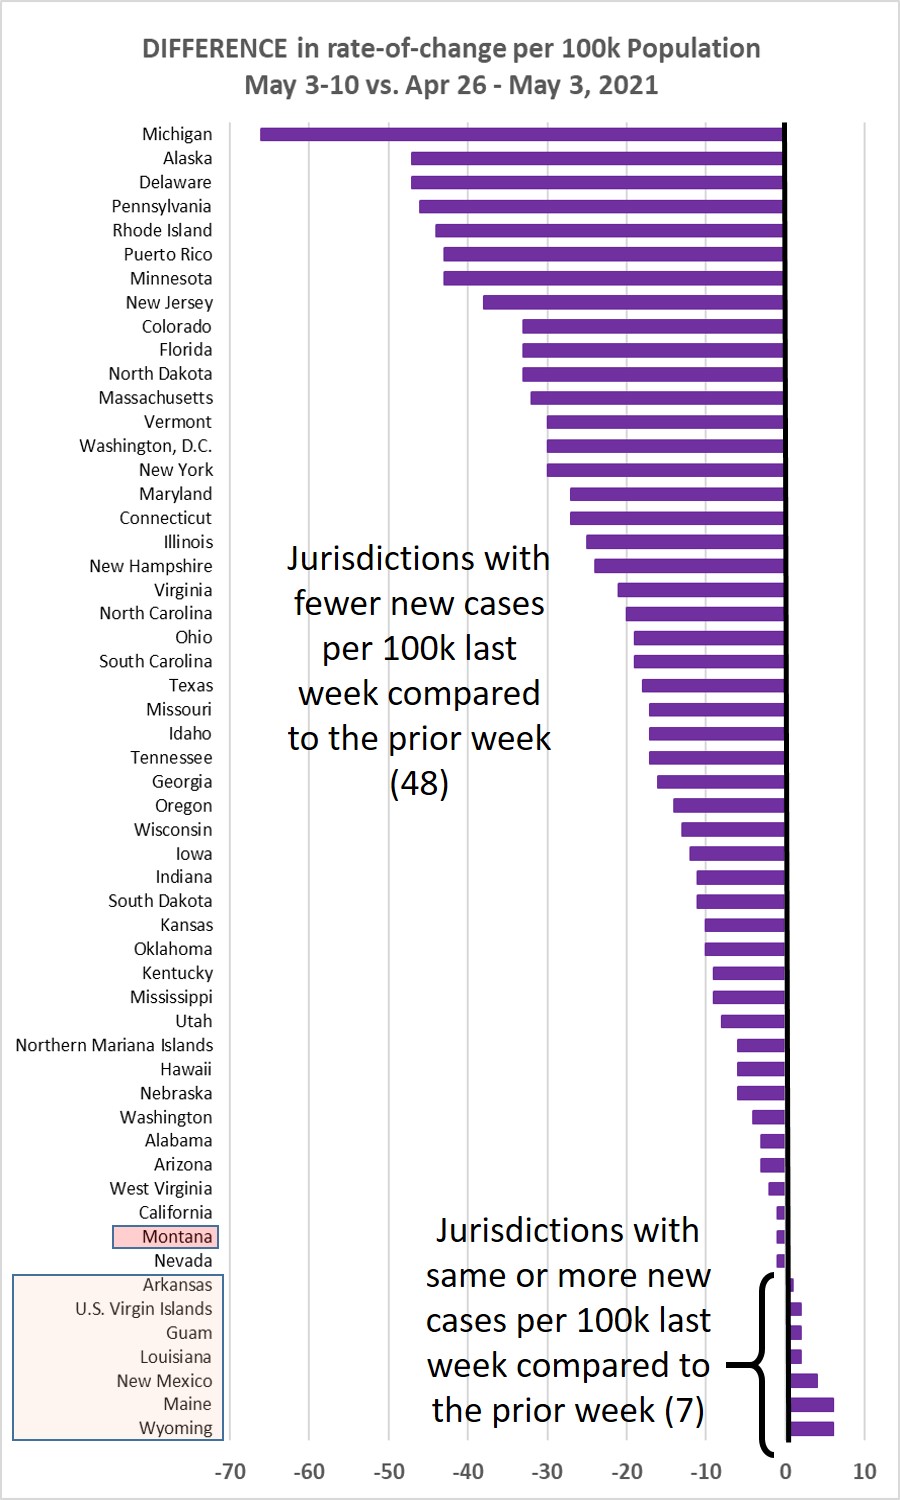
Chart 3 shows the difference in weekly new cases per 100k population for May 3-10,
vs. Apr. 26 - May 3, 2021. This past week only 7/55 jurisdictions (12.7%) showed a
higher rate of new cases, down from 34.5% increasing the prior week.
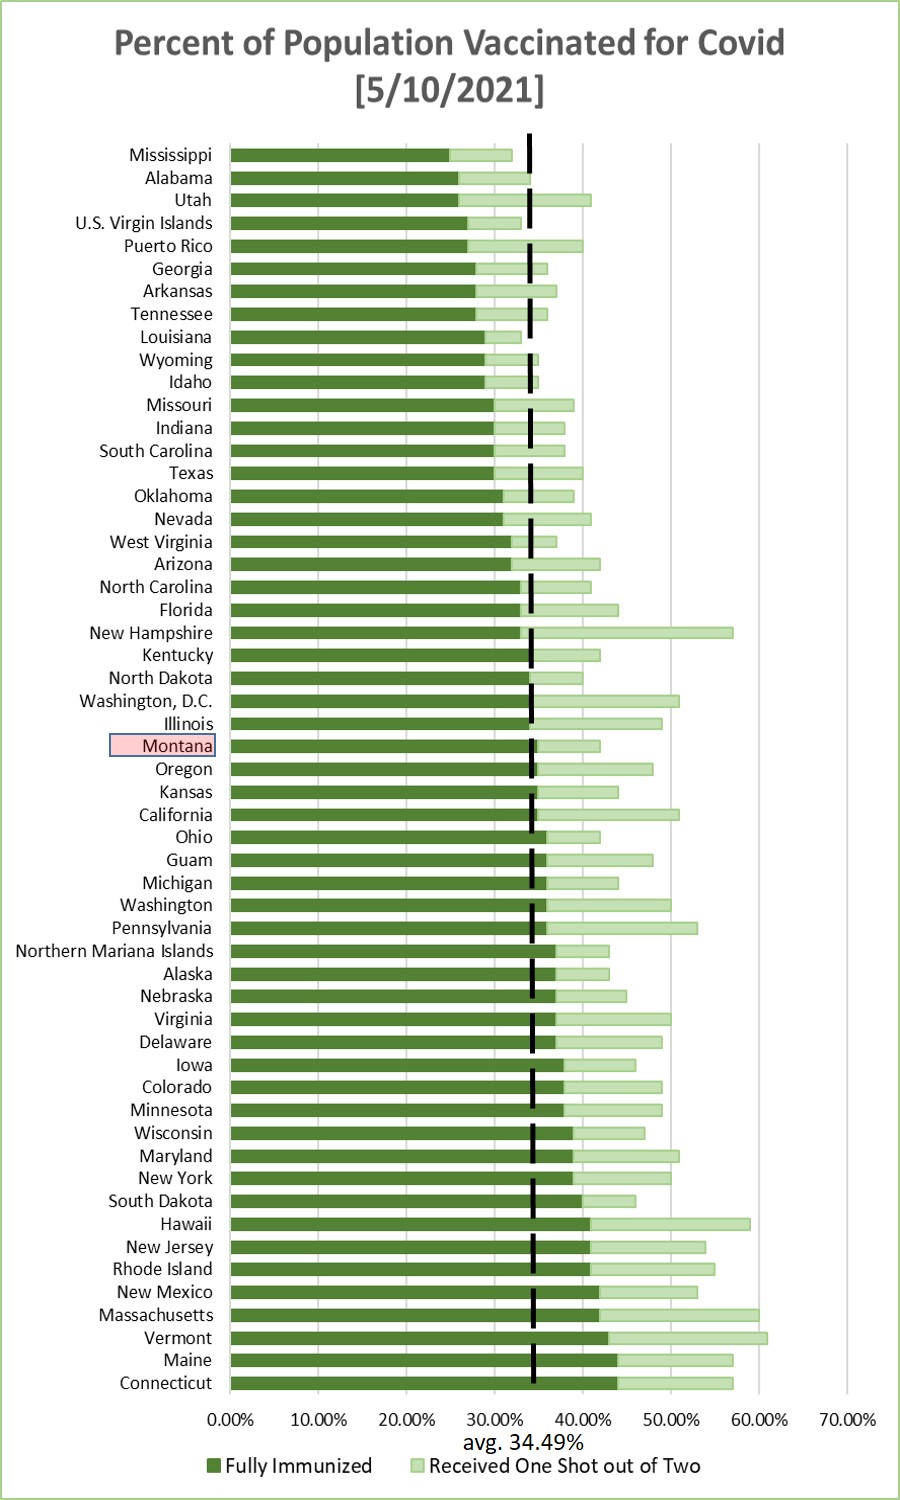
Chart 4 shows the percentage of the population in each jurisdiction having received
1 or 2 Covid-19 vaccination shots. This is sorted by the fraction that have received
2 shots--or one shot of the J&J vaccine. Average across the 55 jurisdictions is 34.49%
being fully immunized--a weekly increase of about 2.6%.

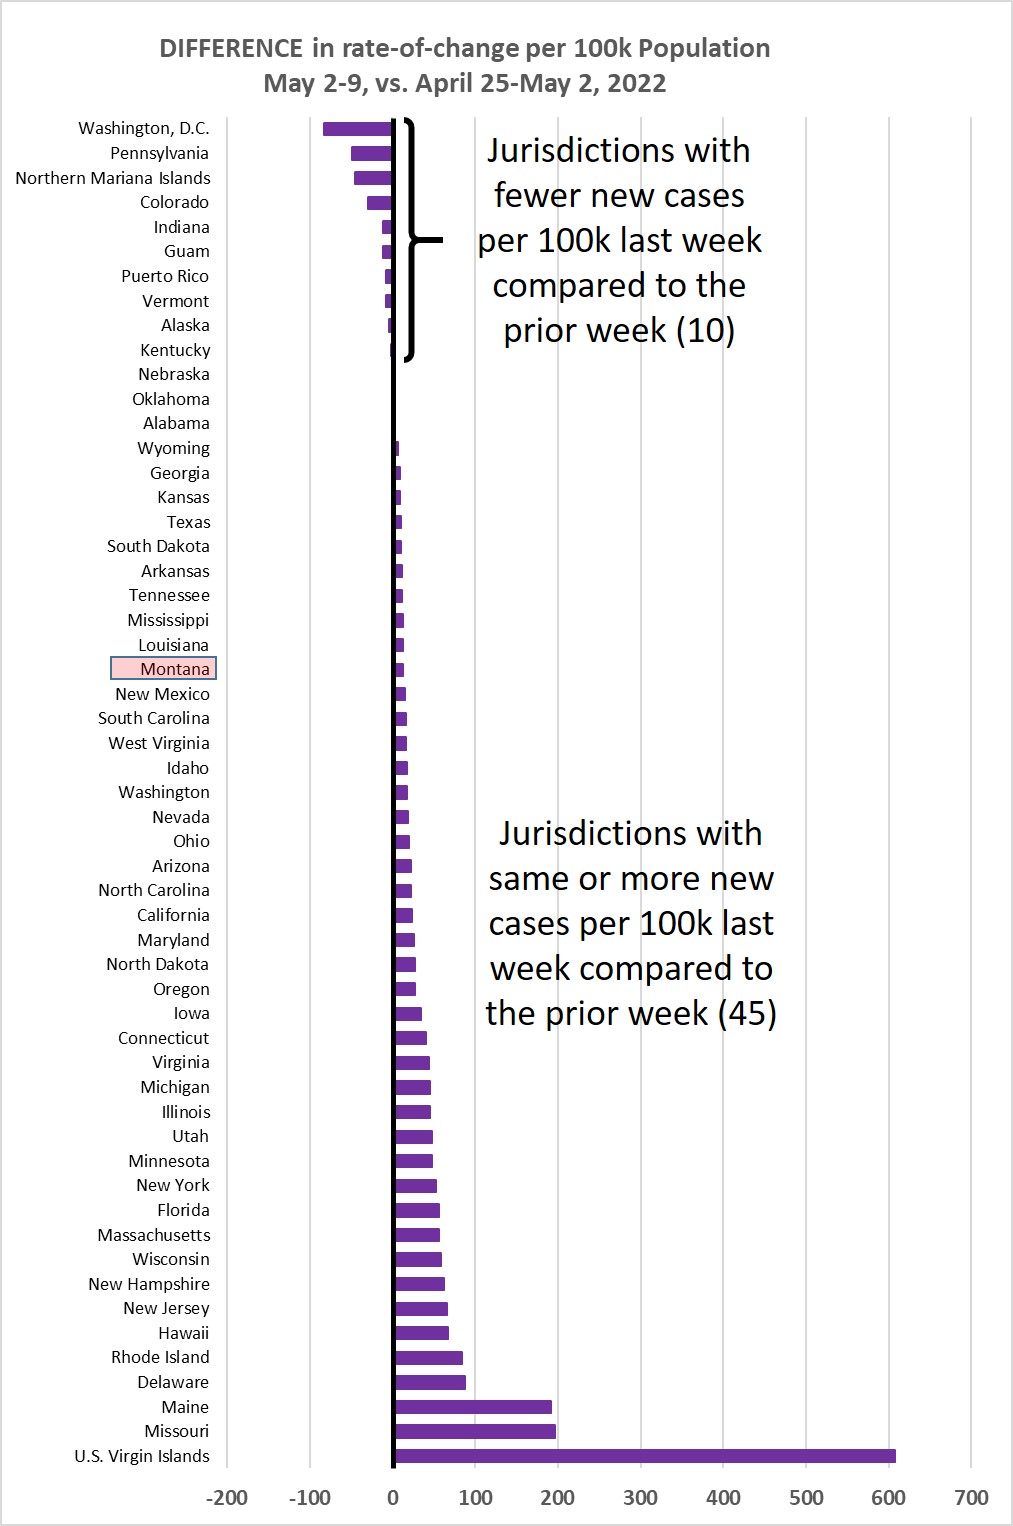
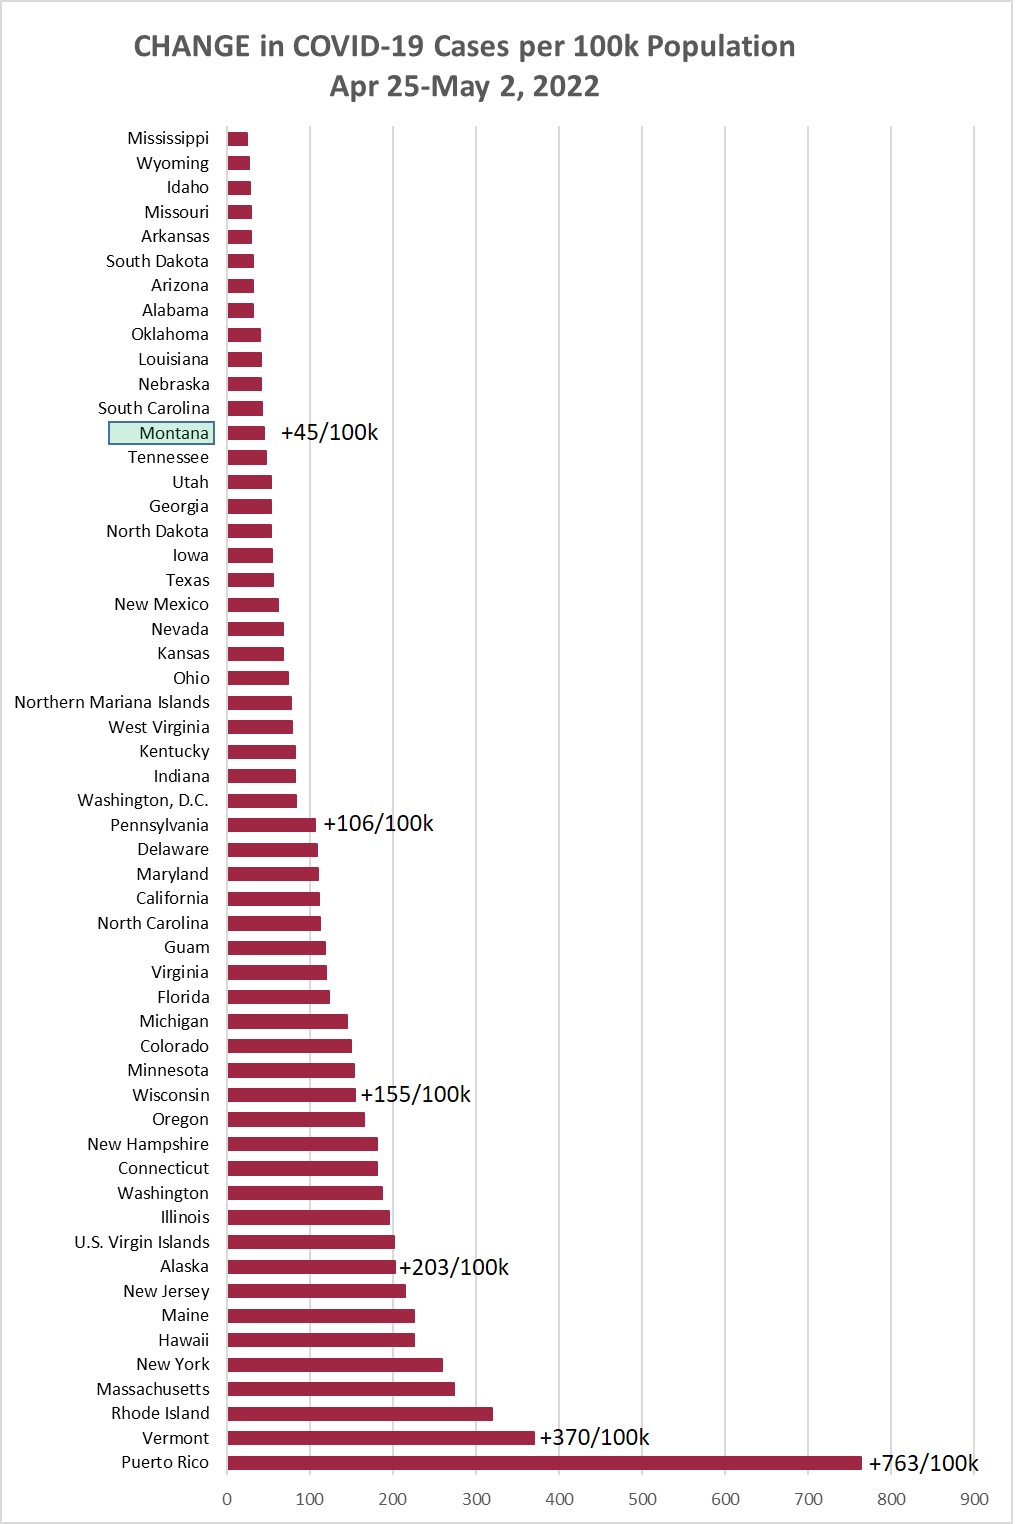
Monday, May 3, 2021
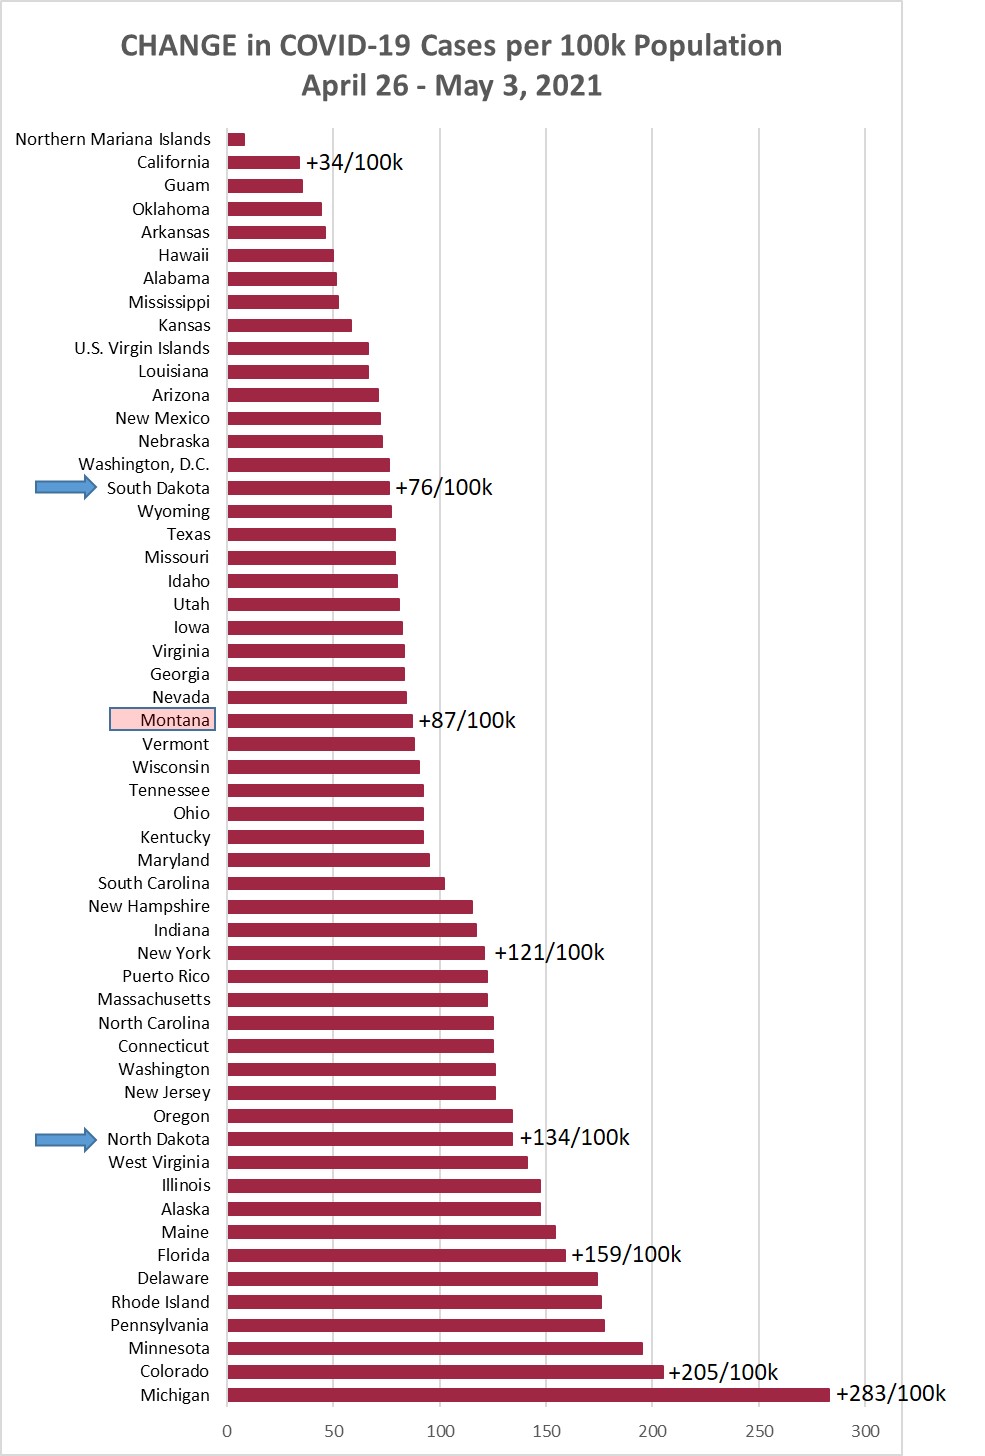
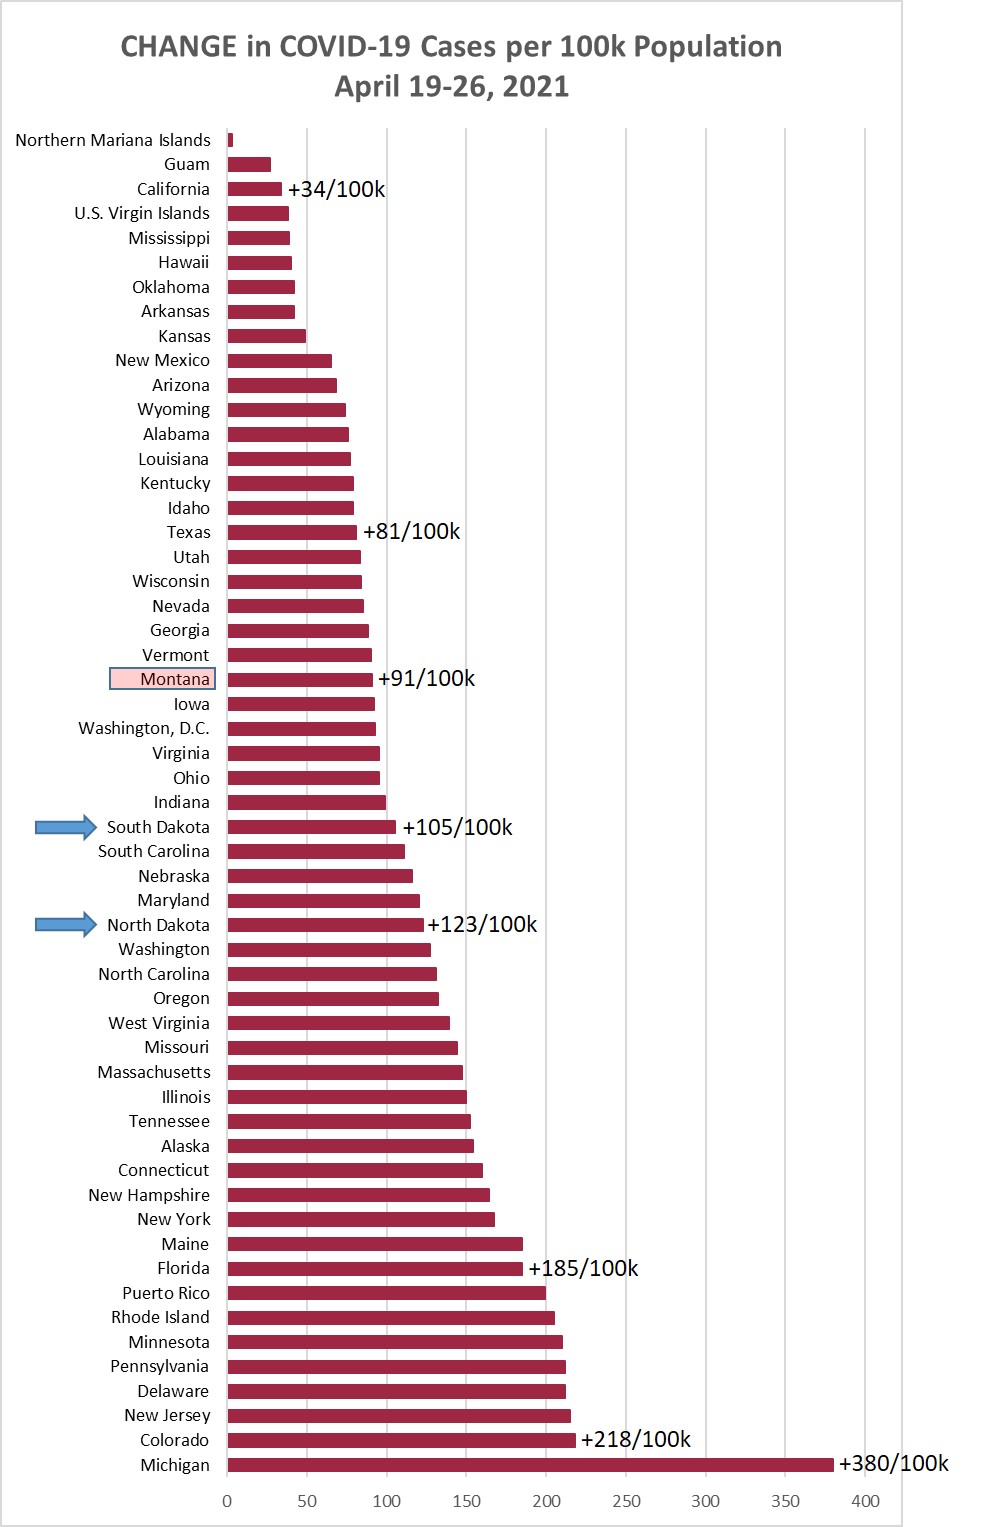
Chart 1 shows the change in cases per 100,000 population as of this morning (May 3,
2021) compared to the cases per 100,000 on April 26, 2021. Montana was up +87/100k
this week, down slightly from +91/100k last week.
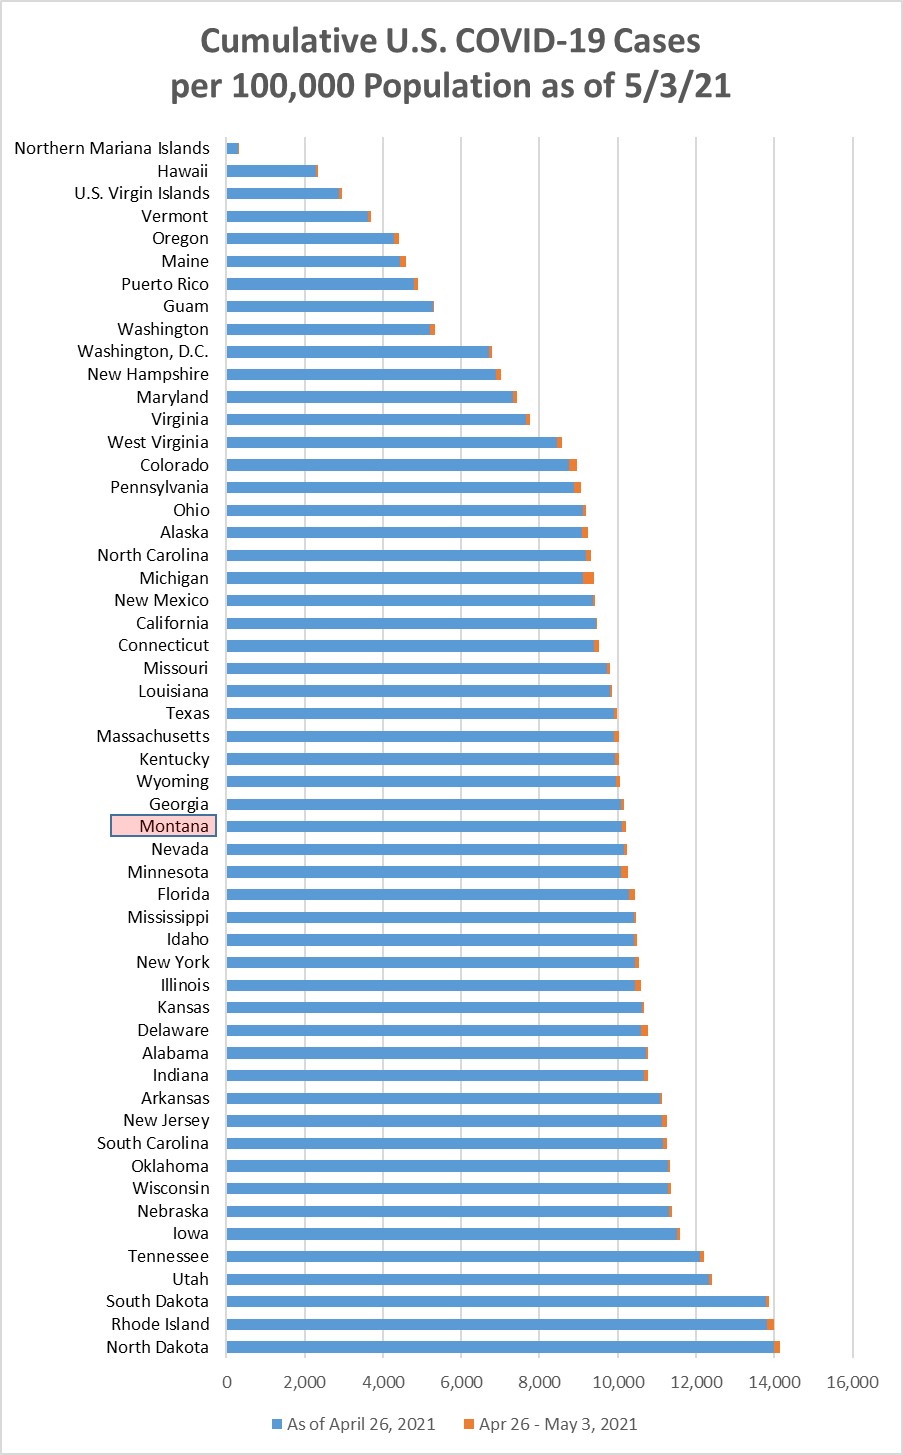
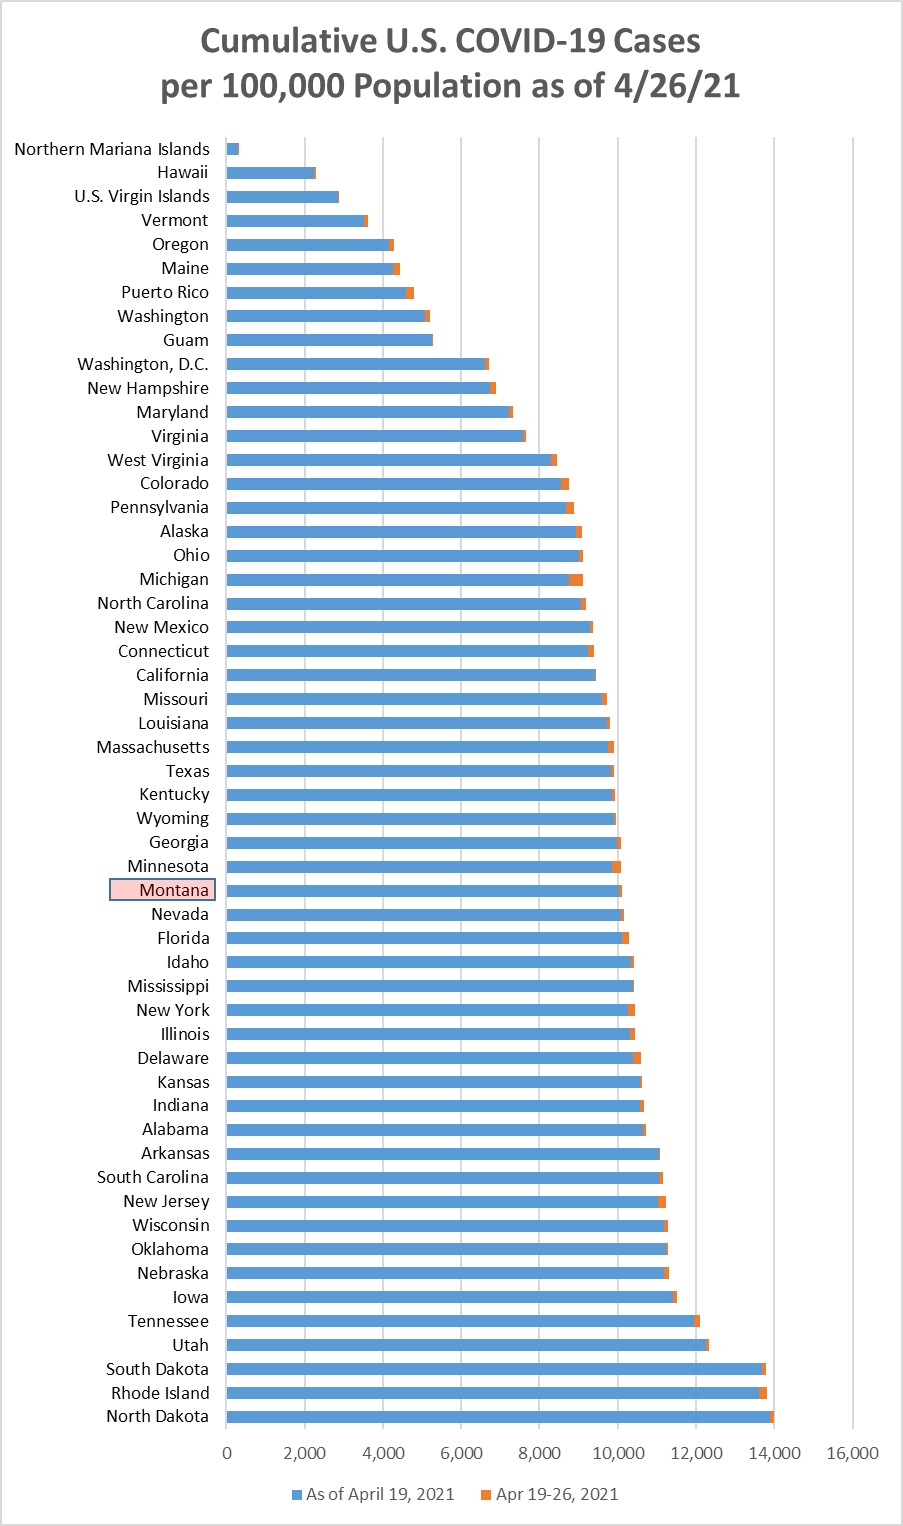
Chart 2 shows the same information as Chart 1, but with the overall cumulative cases
per 100k in each state to May 3. Montana moved down to 31/55 (25th highest), being
passed by Minnesota.
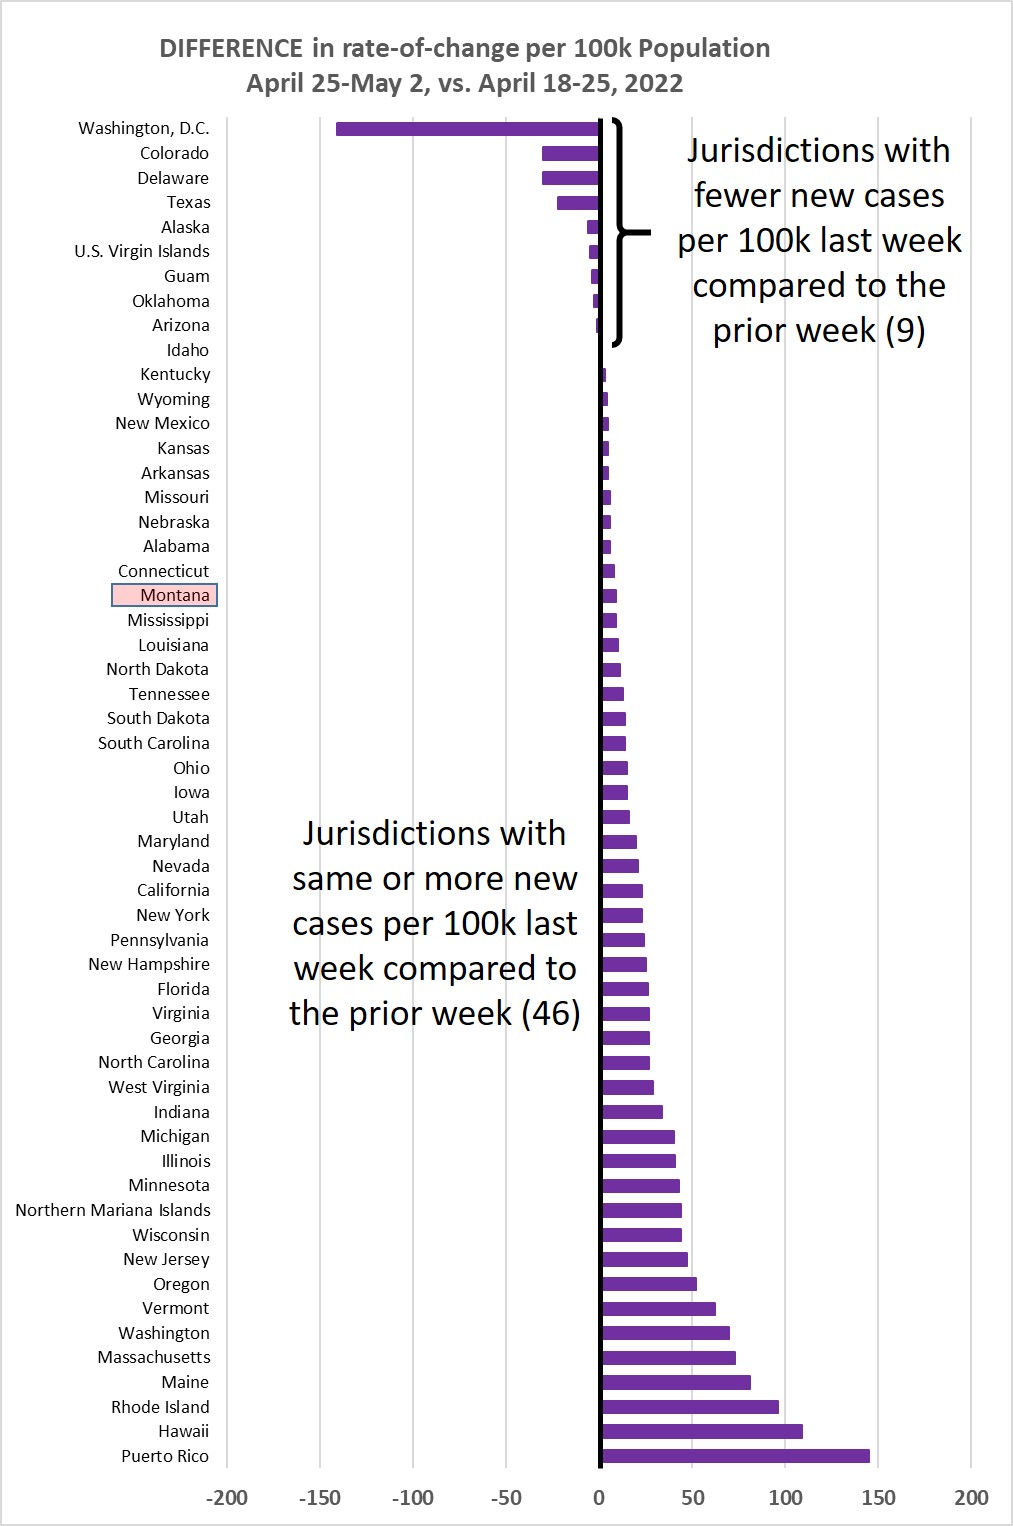
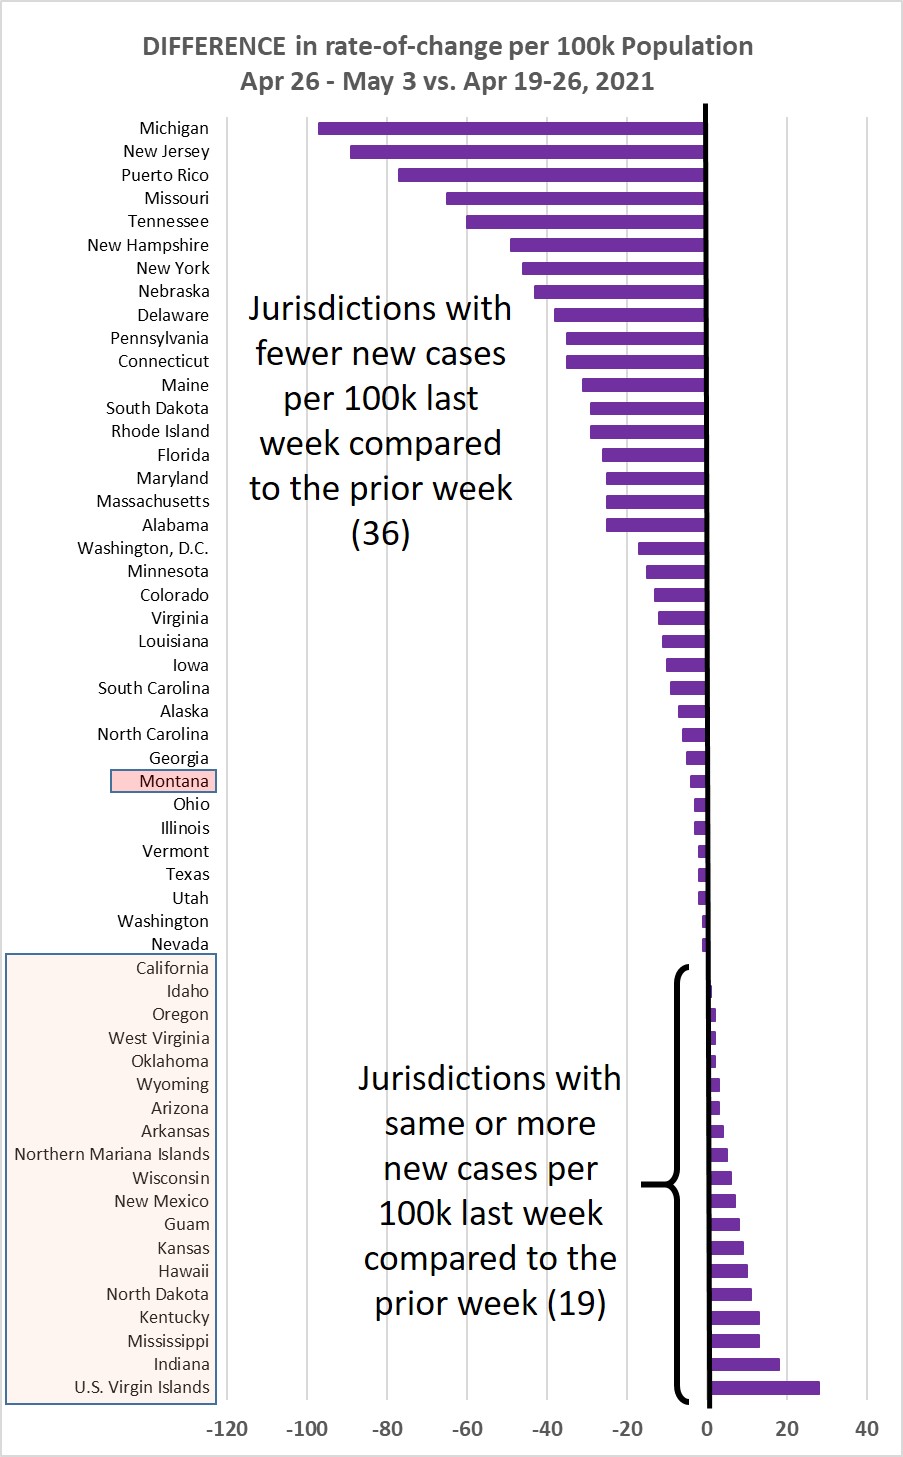
Chart 3 shows the difference in weekly new cases per 100k population for Apr. 26 -
May 3, vs. Apr. 19-26, 2021. This past week 19/55 jurisdictions (34.5%) showed a higher
rate of new cases, up from 27% increasing the prior week.
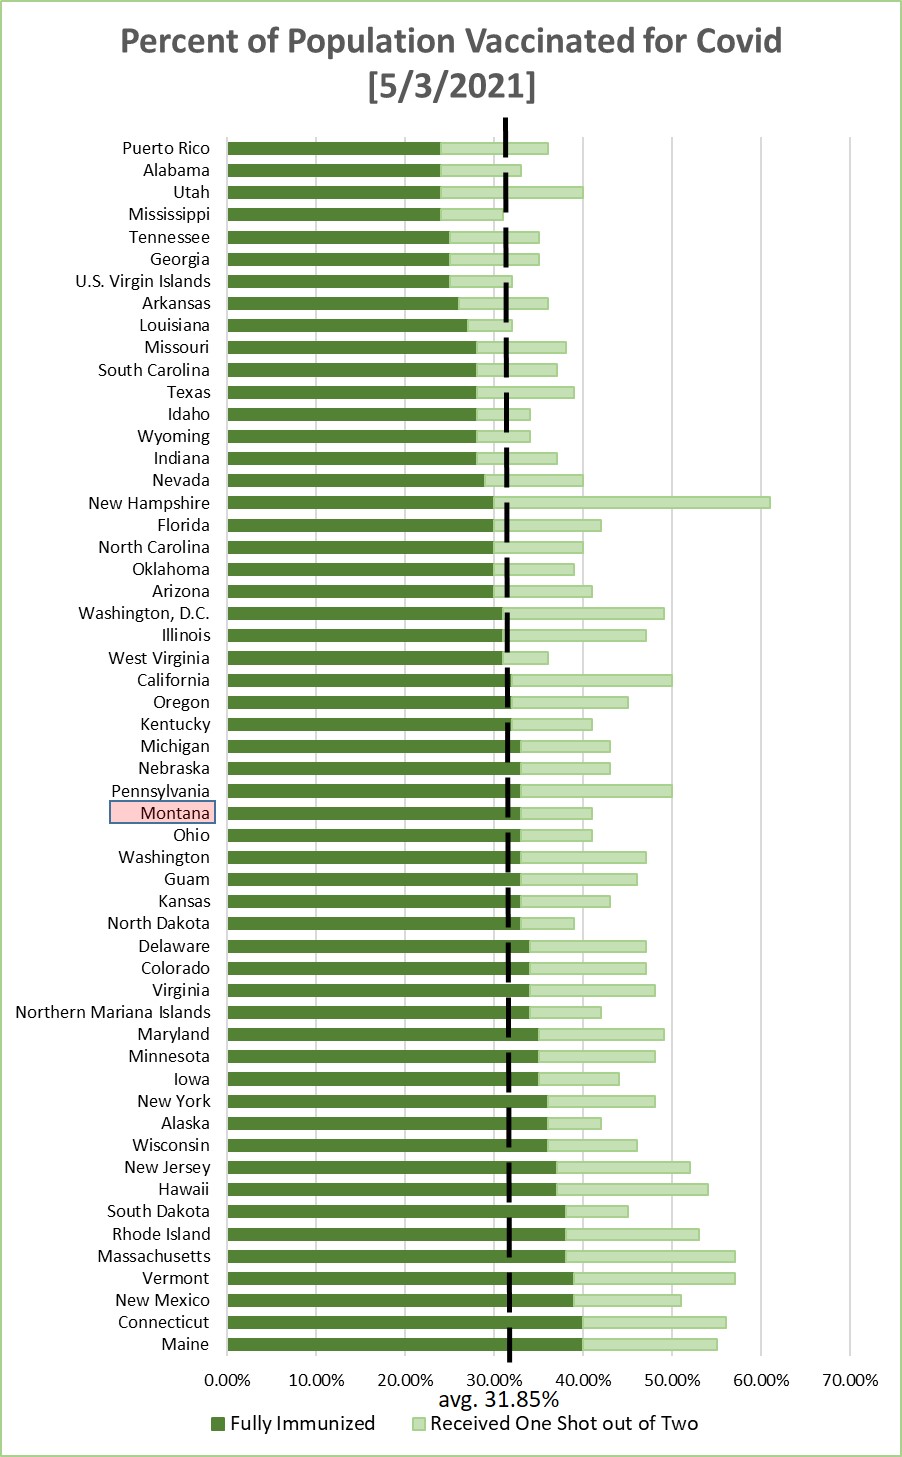
Chart 4 shows the percentage of the population in each jurisdiction having received
1 or 2 Covid-19 vaccination shots. This is sorted by the fraction that have received
2 shots--or one shot of the J&J vaccine. Average across the 55 jurisdictions is 31.85%
being fully immunized--a weekly increase of about 2.9%.
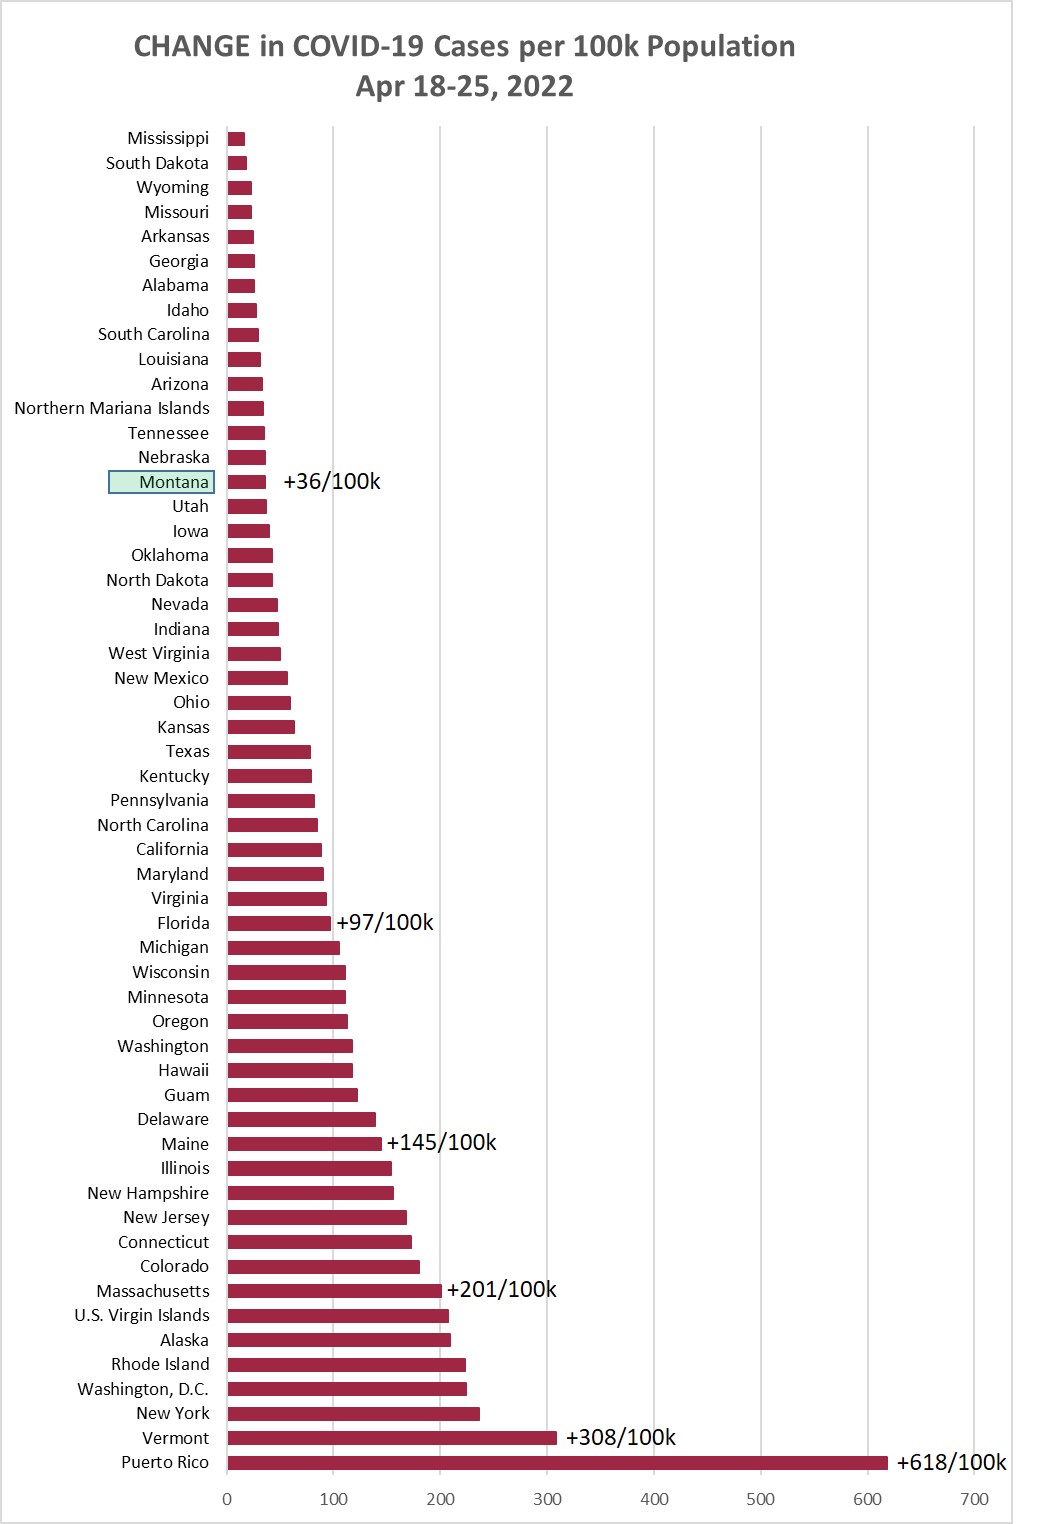
Monday, April 26, 2021
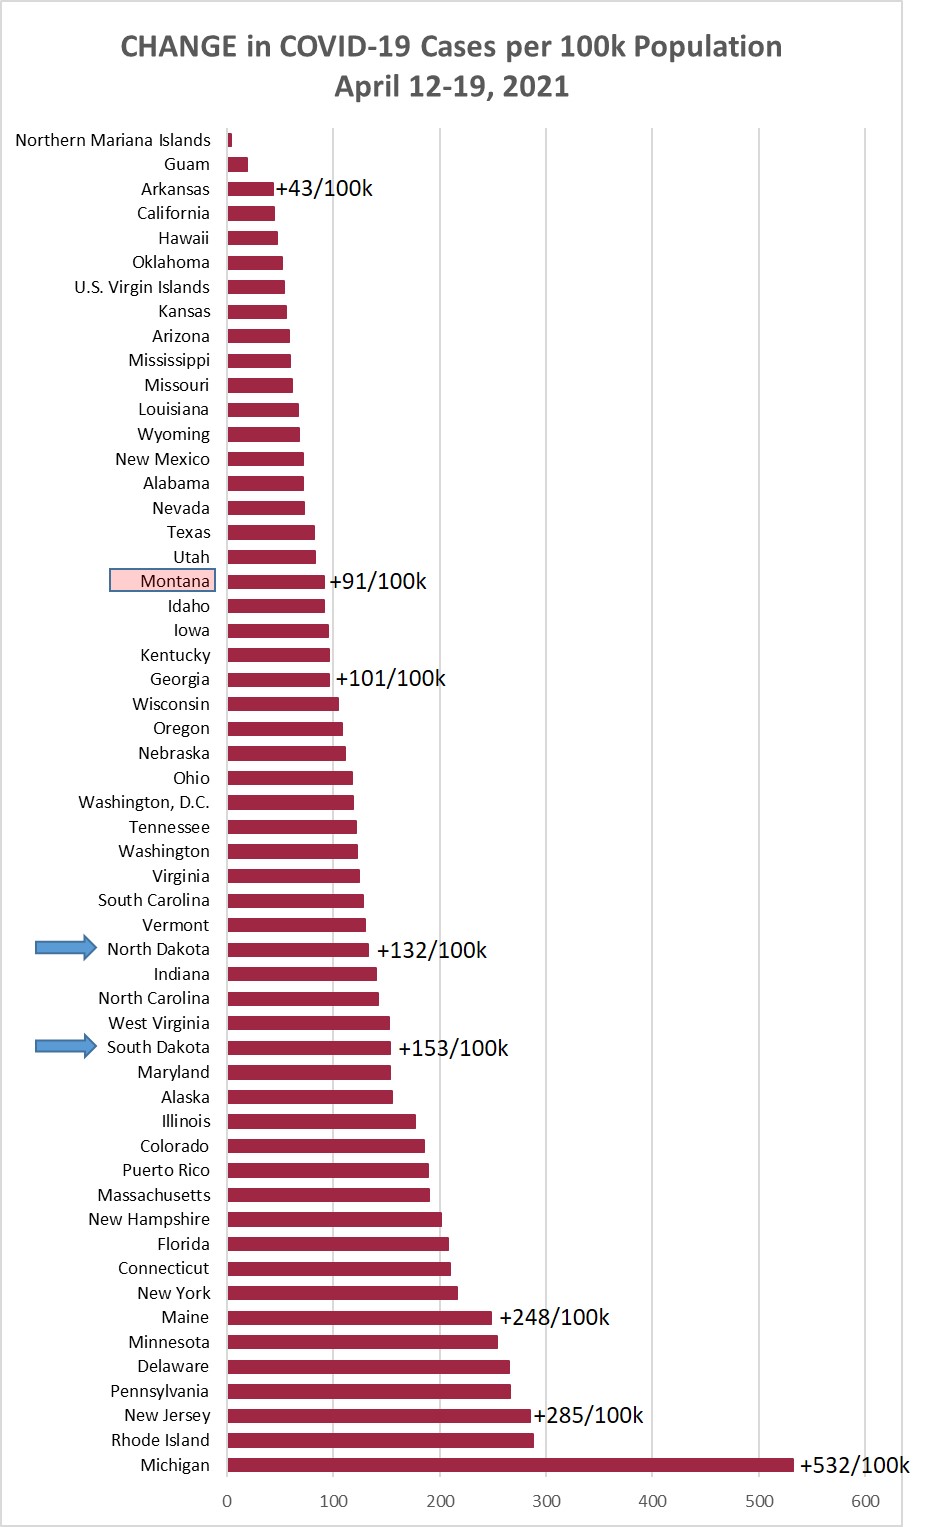
Chart 1 shows the change in cases per 100,000 population as of this morning (April
26, 2021) compared to the cases per 100,000 on April 12, 2021. Montana was up +91/100k
this week, same rate as last week.
Chart 2 shows the same information as Chart 1, but with the overall cumulative cases
per 100k in each state to April 26. Montana remains at 32/55 (24th highest).
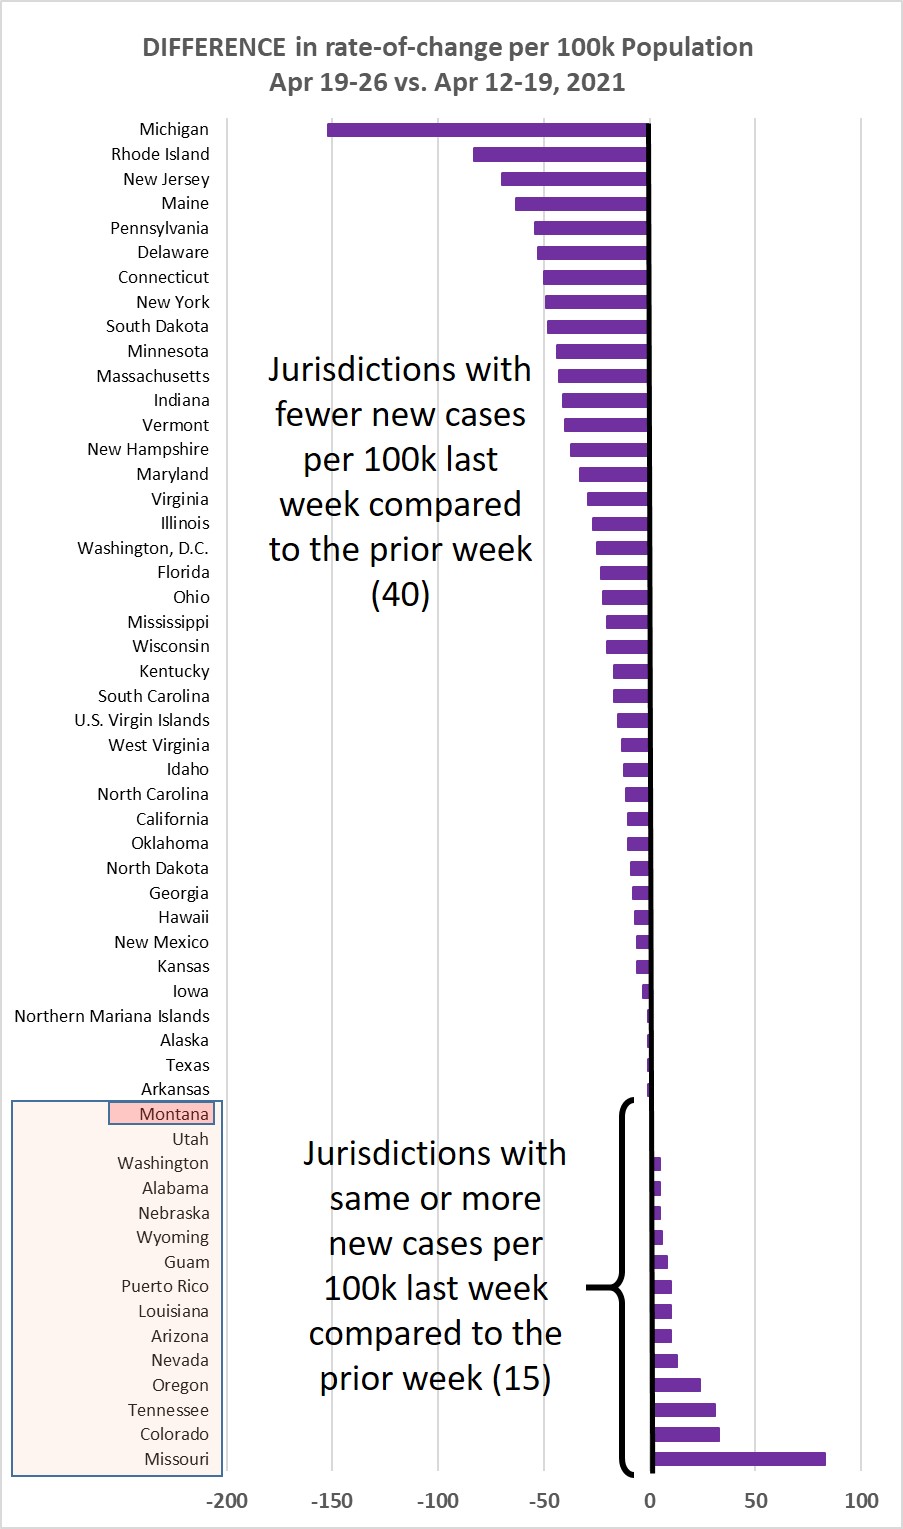
Chart 3 shows the difference in weekly new cases per 100k population for Apr. 19-26,
vs. Apr. 12-19, 2021. This past week only 15/55 jurisdictions (27%) showed a higher
rate of new cases, down from 45% increasing the prior week.
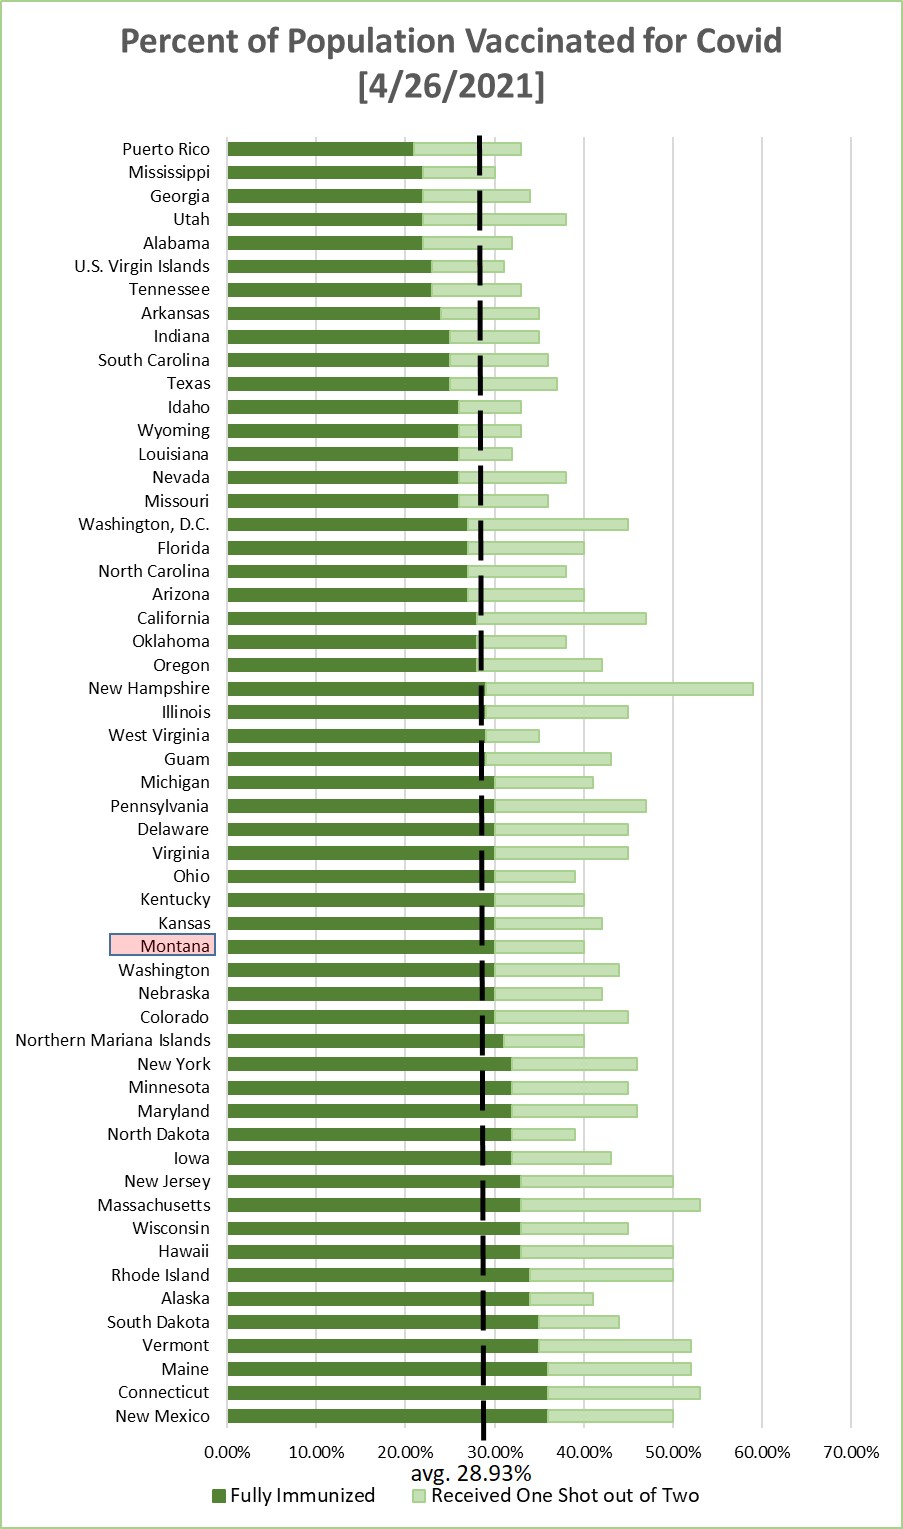
Chart 4 shows the percentage of the population in each jurisdiction having received
1 or 2 Covid-19 vaccination shots. This is sorted by the fraction that have received
2 shots--or one shot of the J&J vaccine. Average across the 55 jurisdictions is 28.93%
being fully immunized--a weekly increase of about 3%.
Monday, April 19, 2021
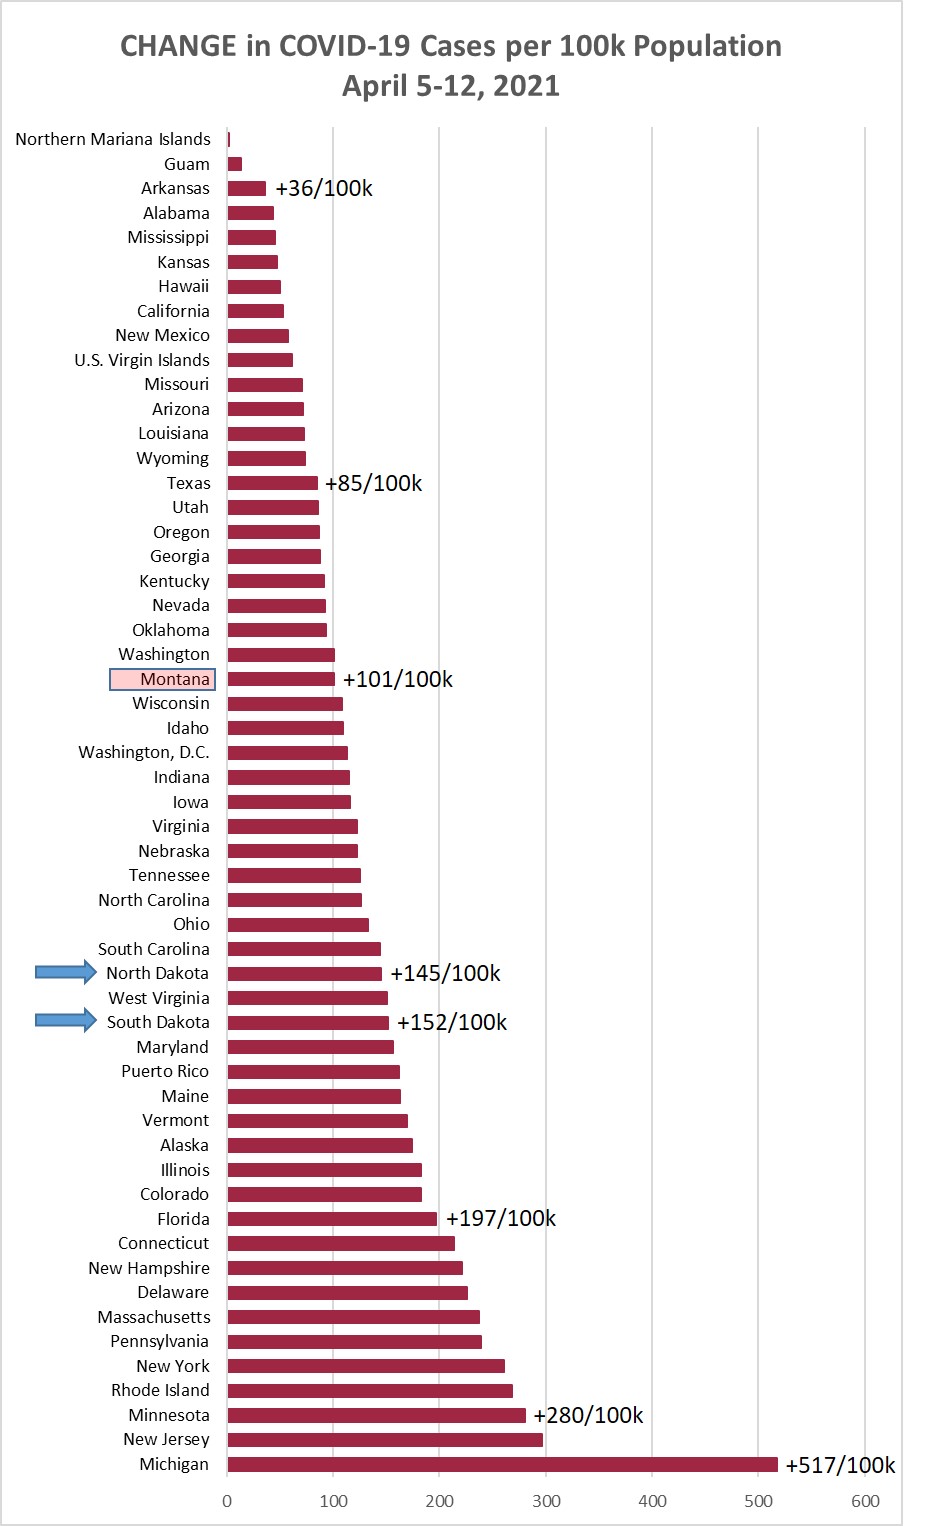
Chart 1 shows the change in cases per 100,000 population as of this morning (April
19, 2021) compared to the cases per 100,000 on April 12, 2021. Montana was up +91/100k
this week, compared to +101 last week, and +90 the week before that.
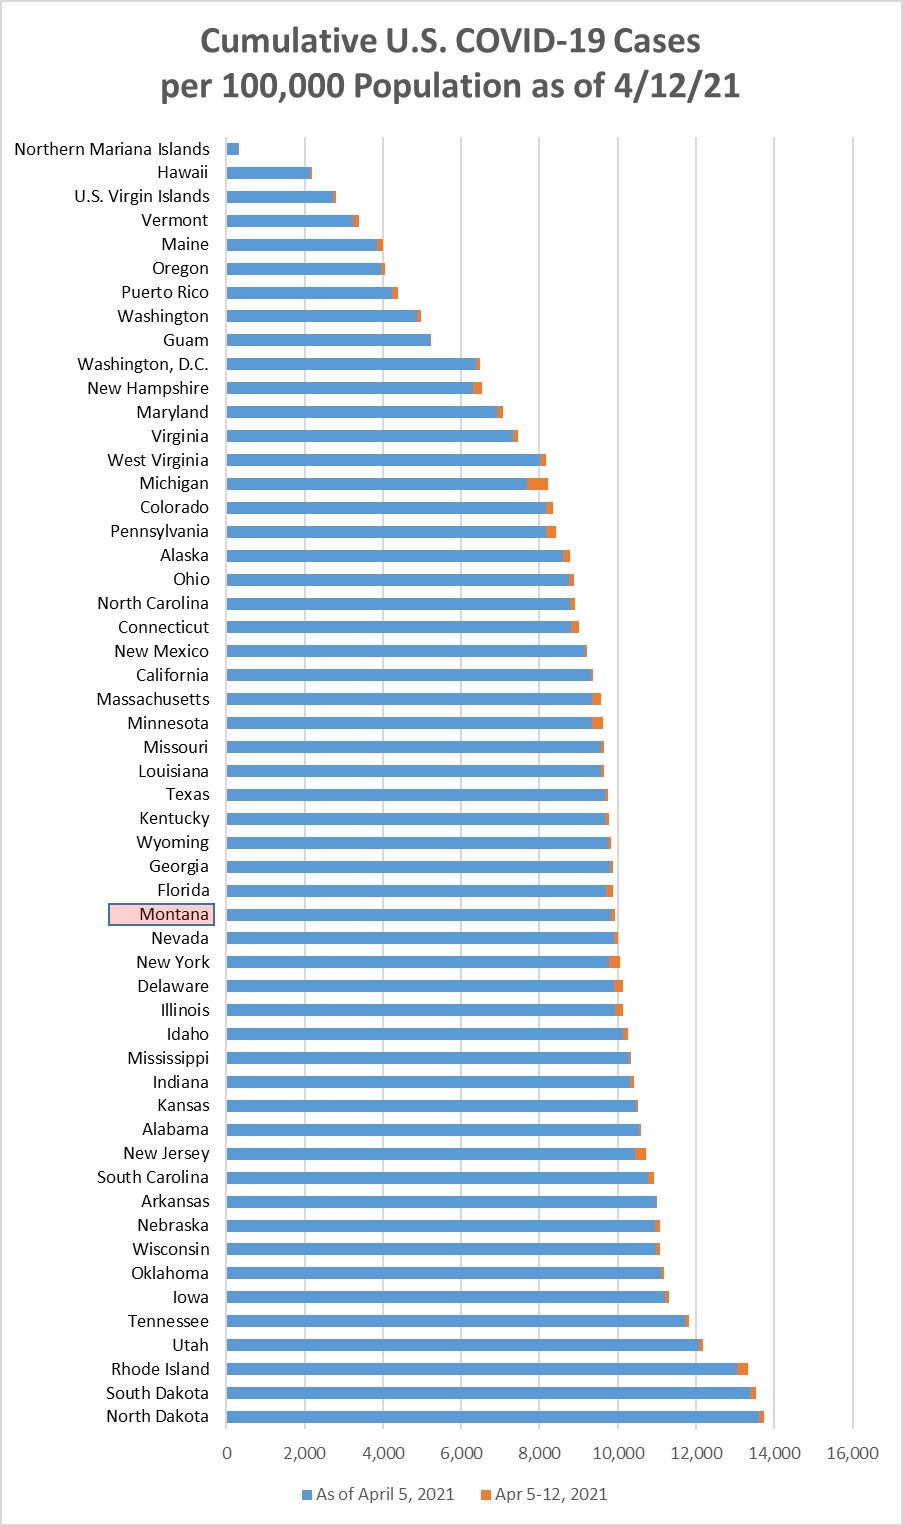
Chart 2 shows the same information as Chart 1, but with the overall cumulative cases
per 100k in each state to April 19. Montana moved down one position to 32/55 (24th
highest).
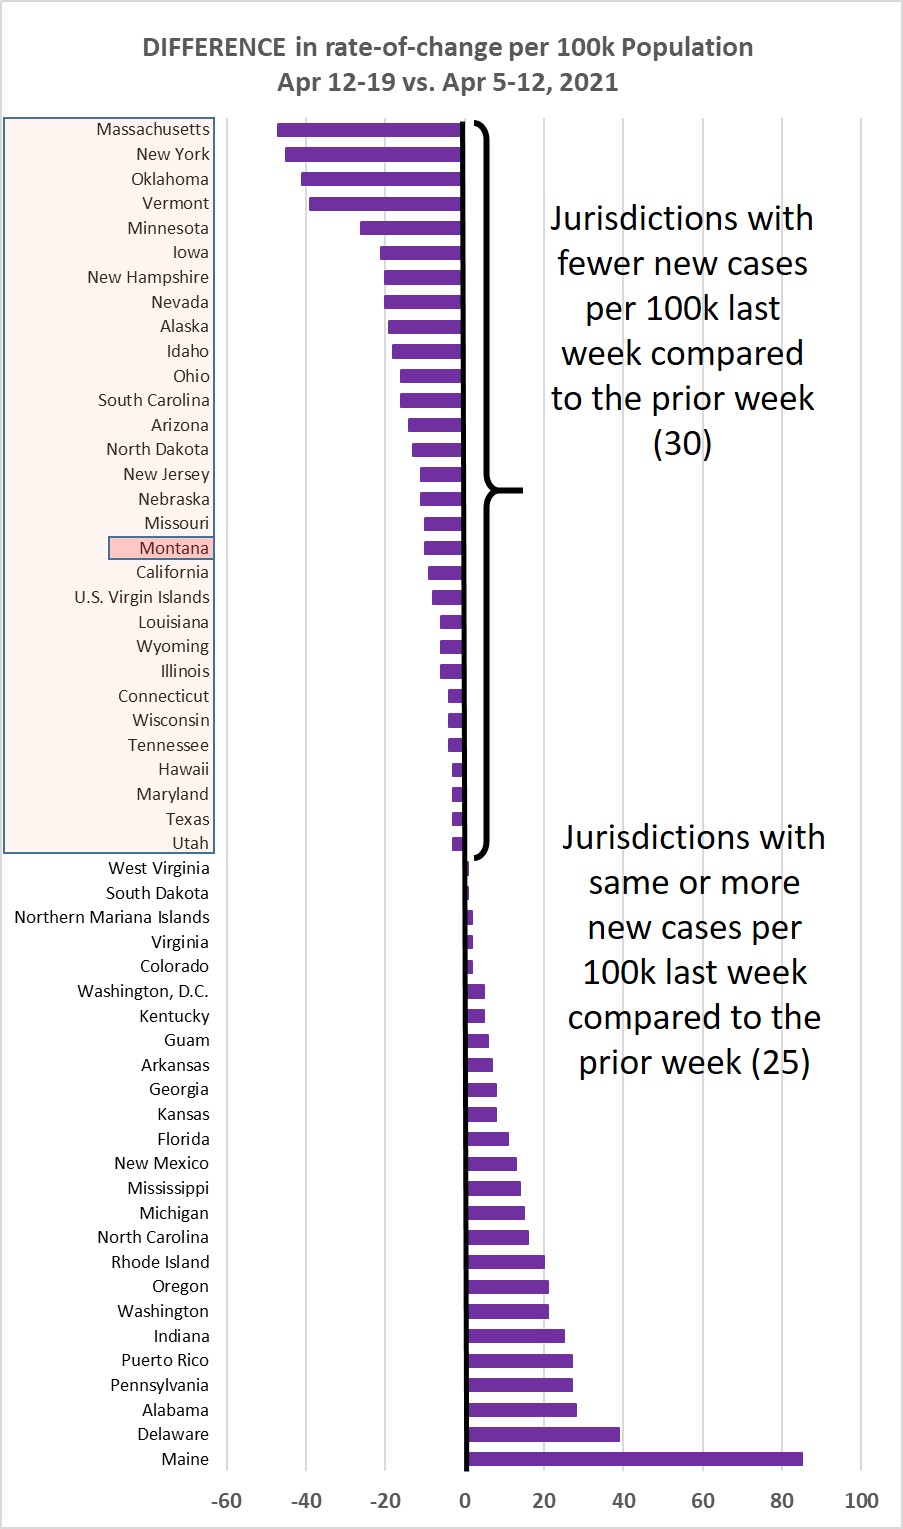
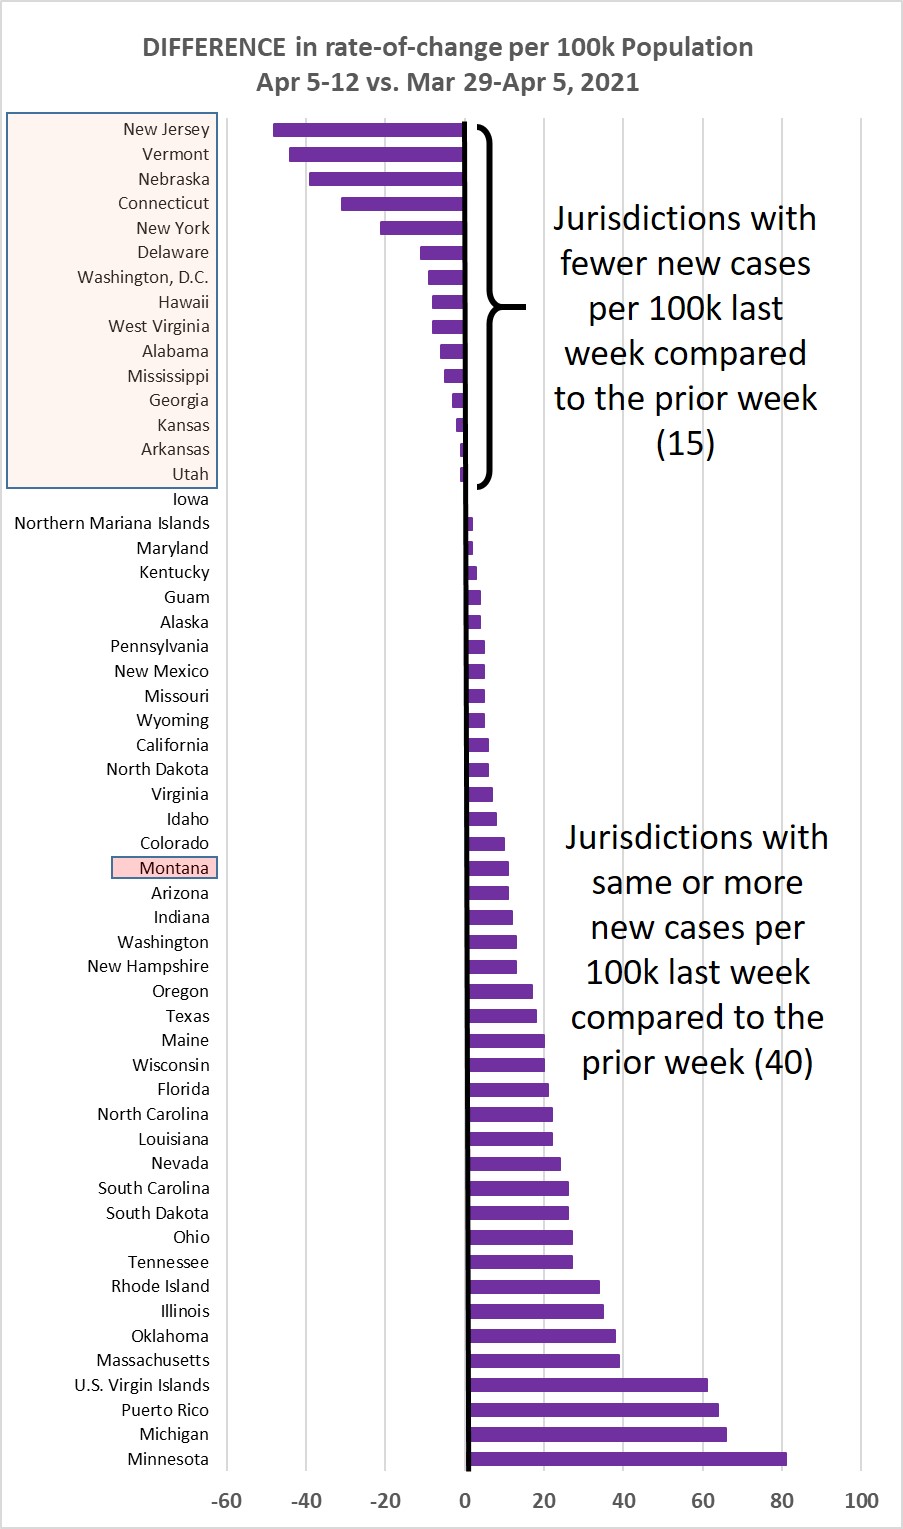
Chart 3 shows the difference in weekly new cases per 100k population for Apr. 12-19,
vs. Apr. 5-12, 2021. This past week 25/55 jurisdictions (45.5%) showed a higher rate
of new cases, down from 73% increasing the prior week.
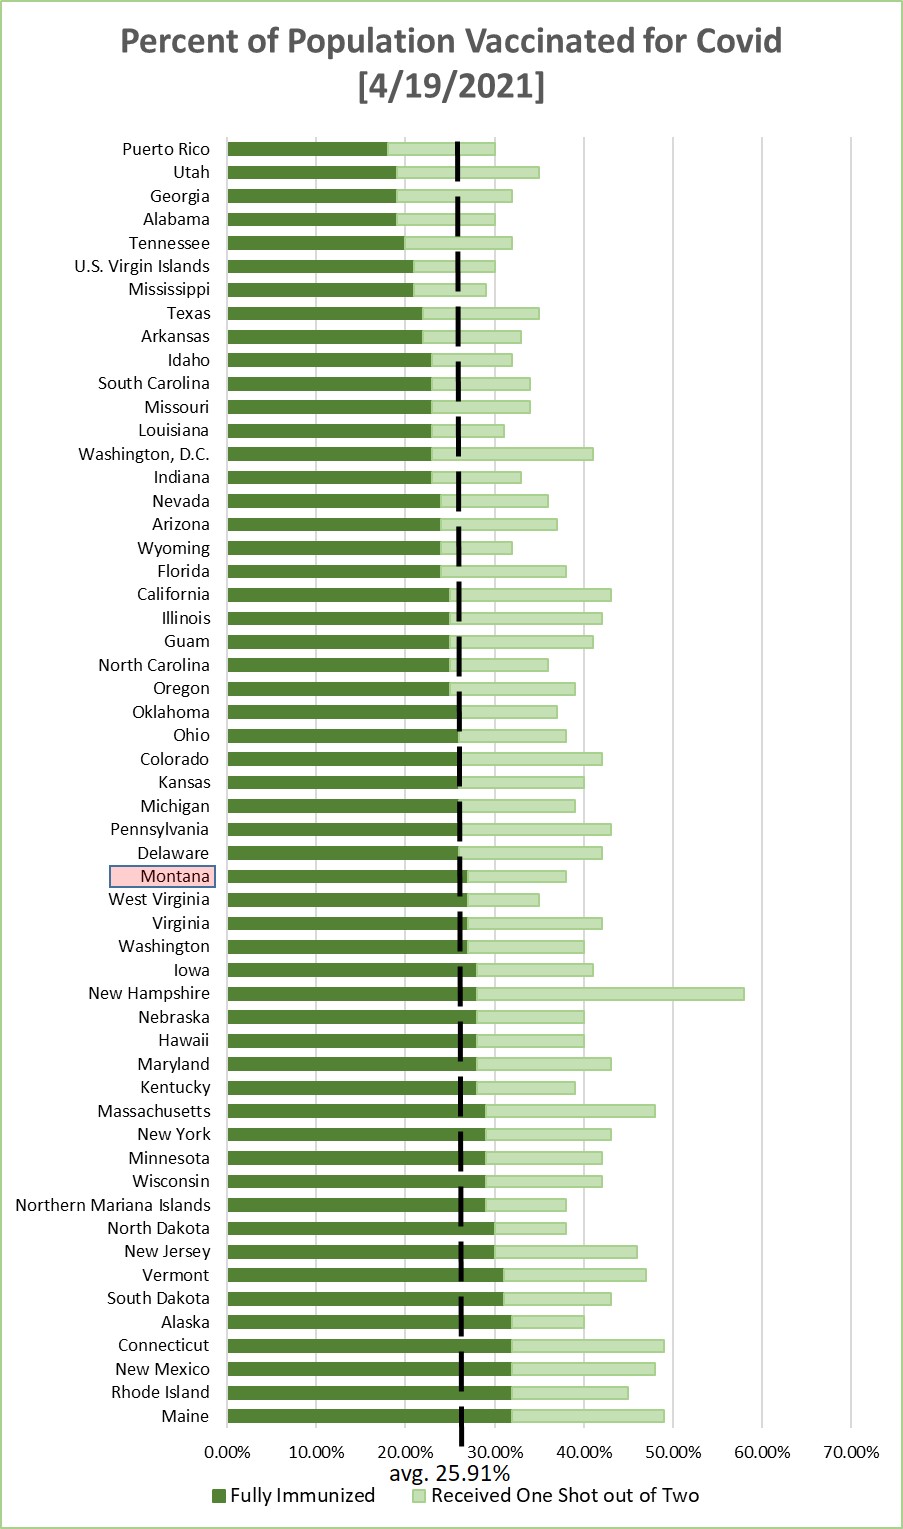
Chart 4 shows the percentage of the population in each jurisdiction having received
1 or 2 Covid-19 vaccination shots. This is sorted by the fraction that have received
2 shots--or one shot of the J&J vaccine. Average across the 55 jurisdictions is 25.91%
being fully immunized--a weekly increase of about 3.4%.

Monday, April 12, 2021
Chart 1 shows the change in cases per 100,000 population as of this morning (April
12, 2021) compared to the cases per 100,000 on April 5, 2021. Montana was up +101/100k
this week, compared to +90 last week, and +100 the week before that.
Chart 2 shows the same information as Chart 1, but with the overall cumulative cases
per 100k in each state to April 5. Montana moved down one position 33/55 (23rd highest),
being passed by Delaware and New York.
Chart 3 shows the difference in weekly new cases per 100k population for Apr. 5-12,
vs. Mar. 29-Apr. 5, 2021. This past week 40/55 jurisdictions (73% !) showed a higher
rate of new cases, up from 49% increasing the prior week.
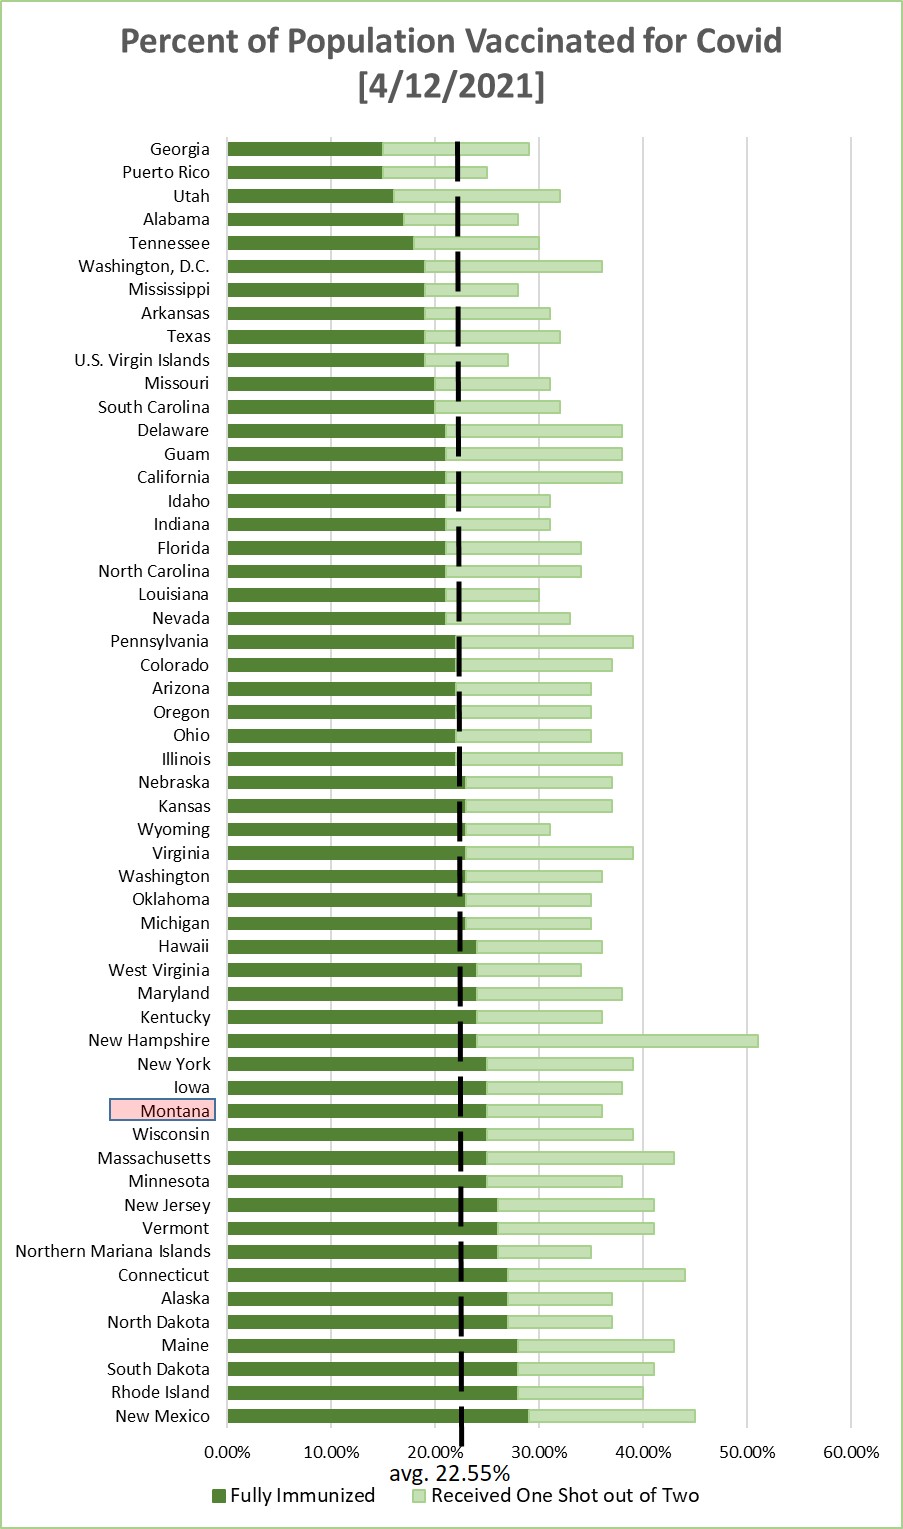
Chart 4 shows the percentage of the population in each jurisdiction having received
1 or 2 Covid-19 vaccination shots. This is sorted by the fraction that have received
2 shots--or one shot of the J&J vaccine. Average across the 55 jurisdictions is 22.55%
being fully immunized--a weekly increase of about 3.3%.
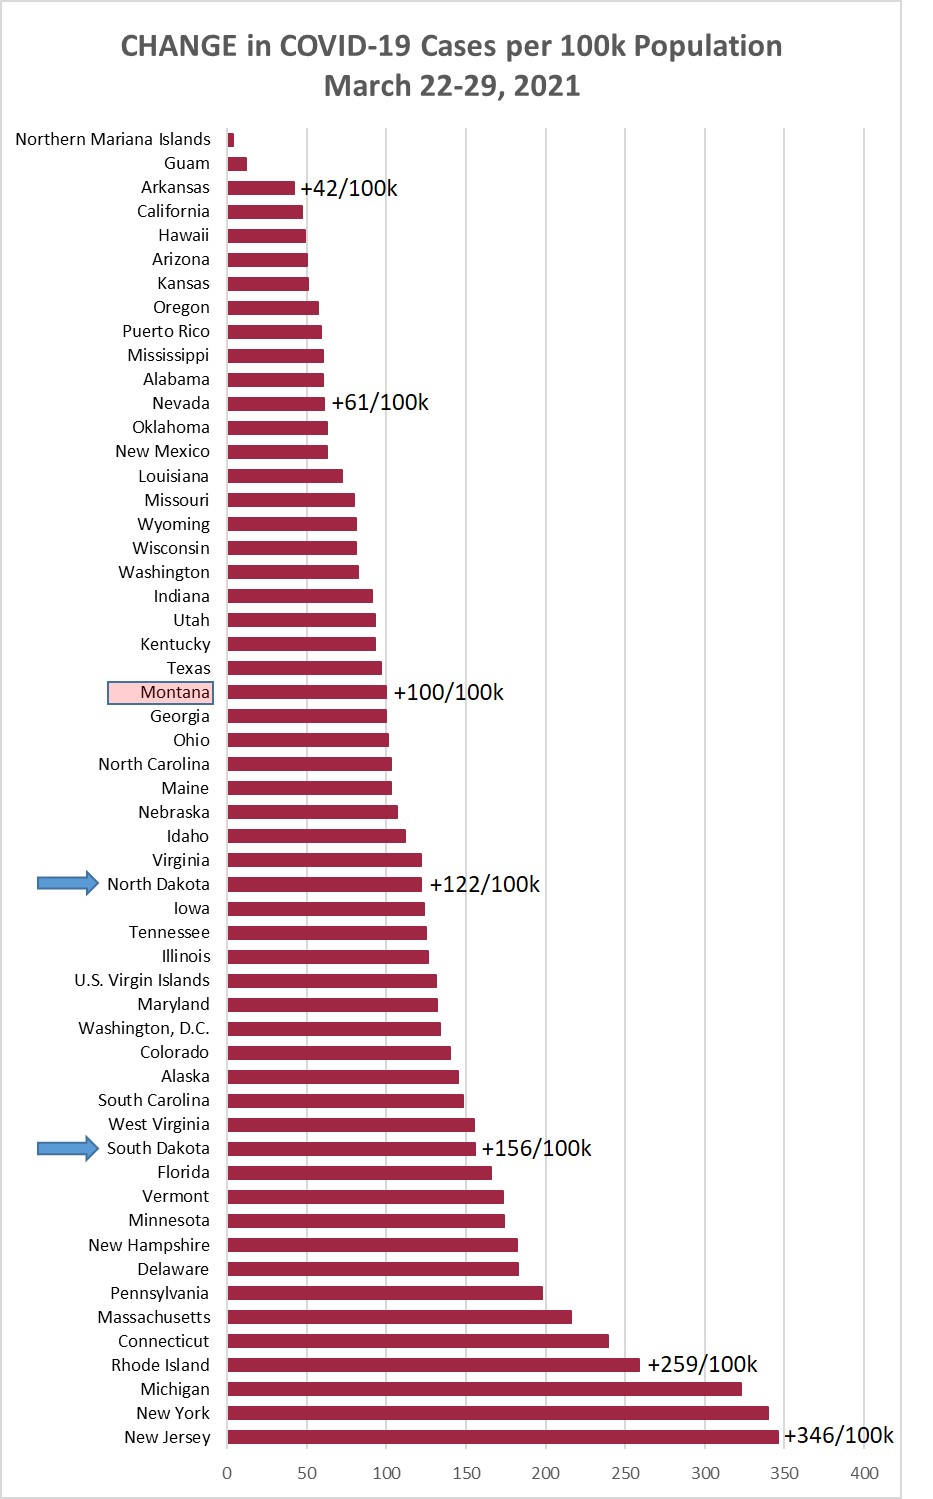
Monday, April 5, 2021
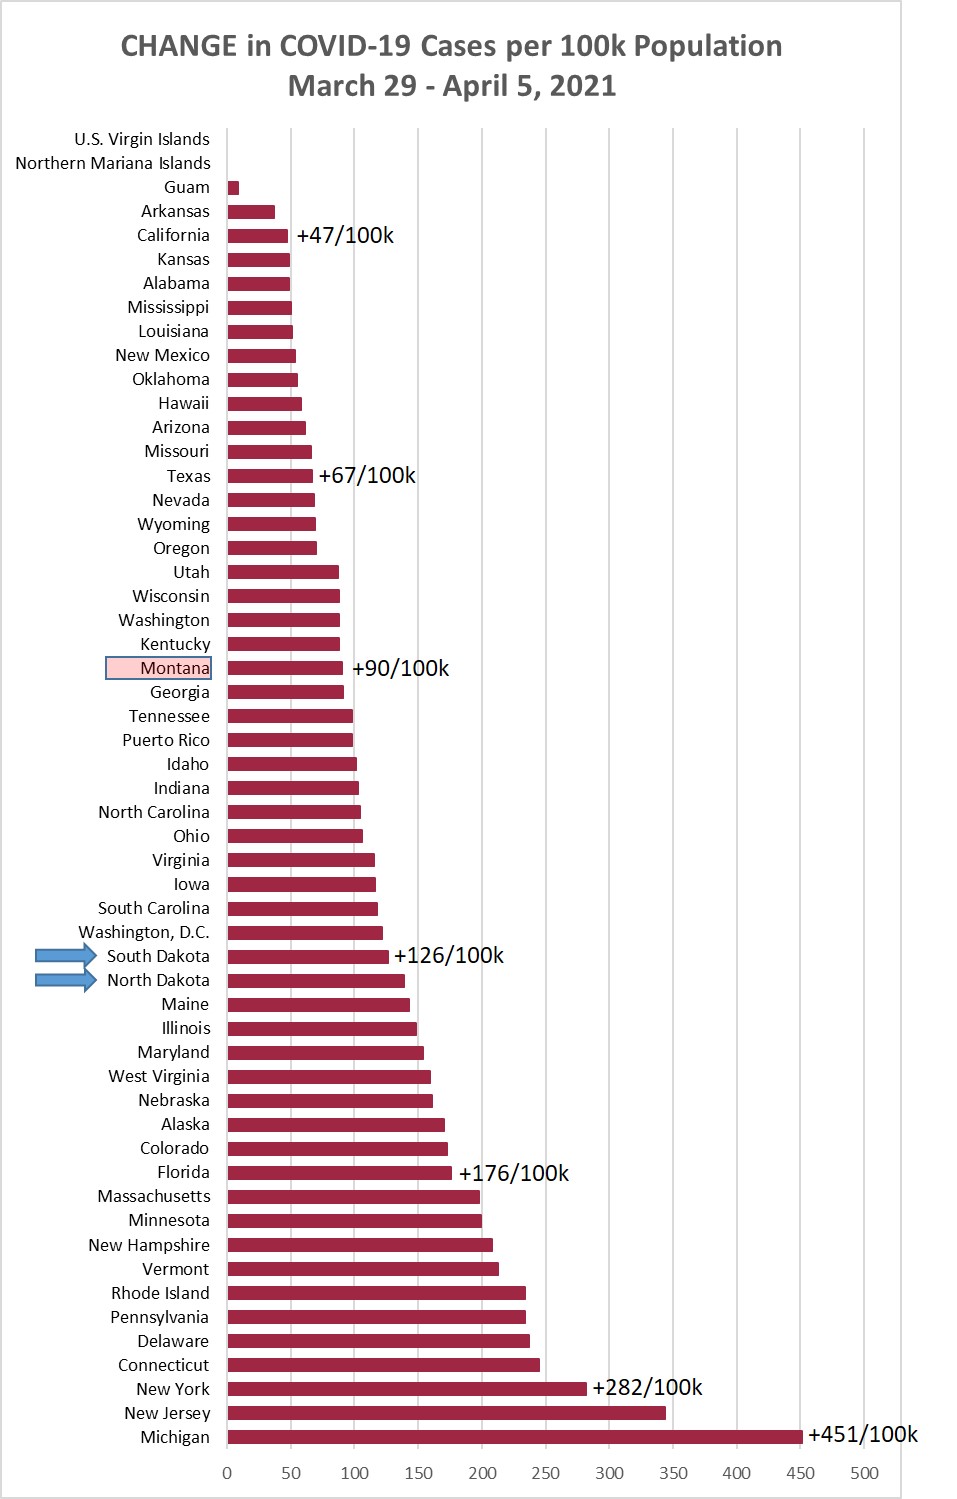
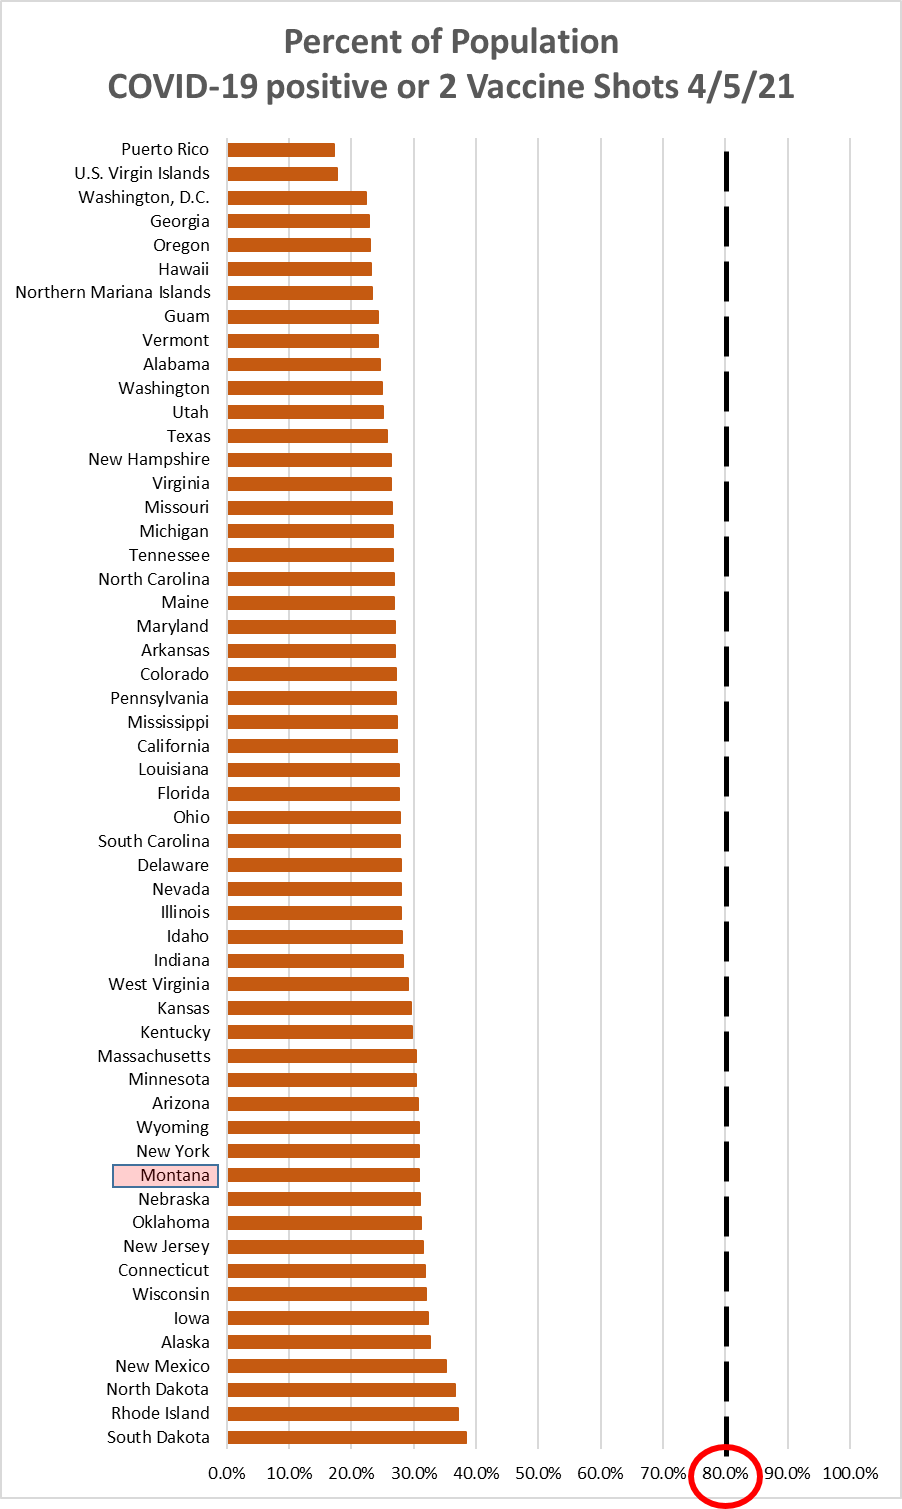
Chart 1 shows the change in cases per 100,000 population as of this morning (April
5, 2021) compared to the cases per 100,000 on March 29, 2021. Montana was up +90/100k
this week, compared to +100/100k last week.
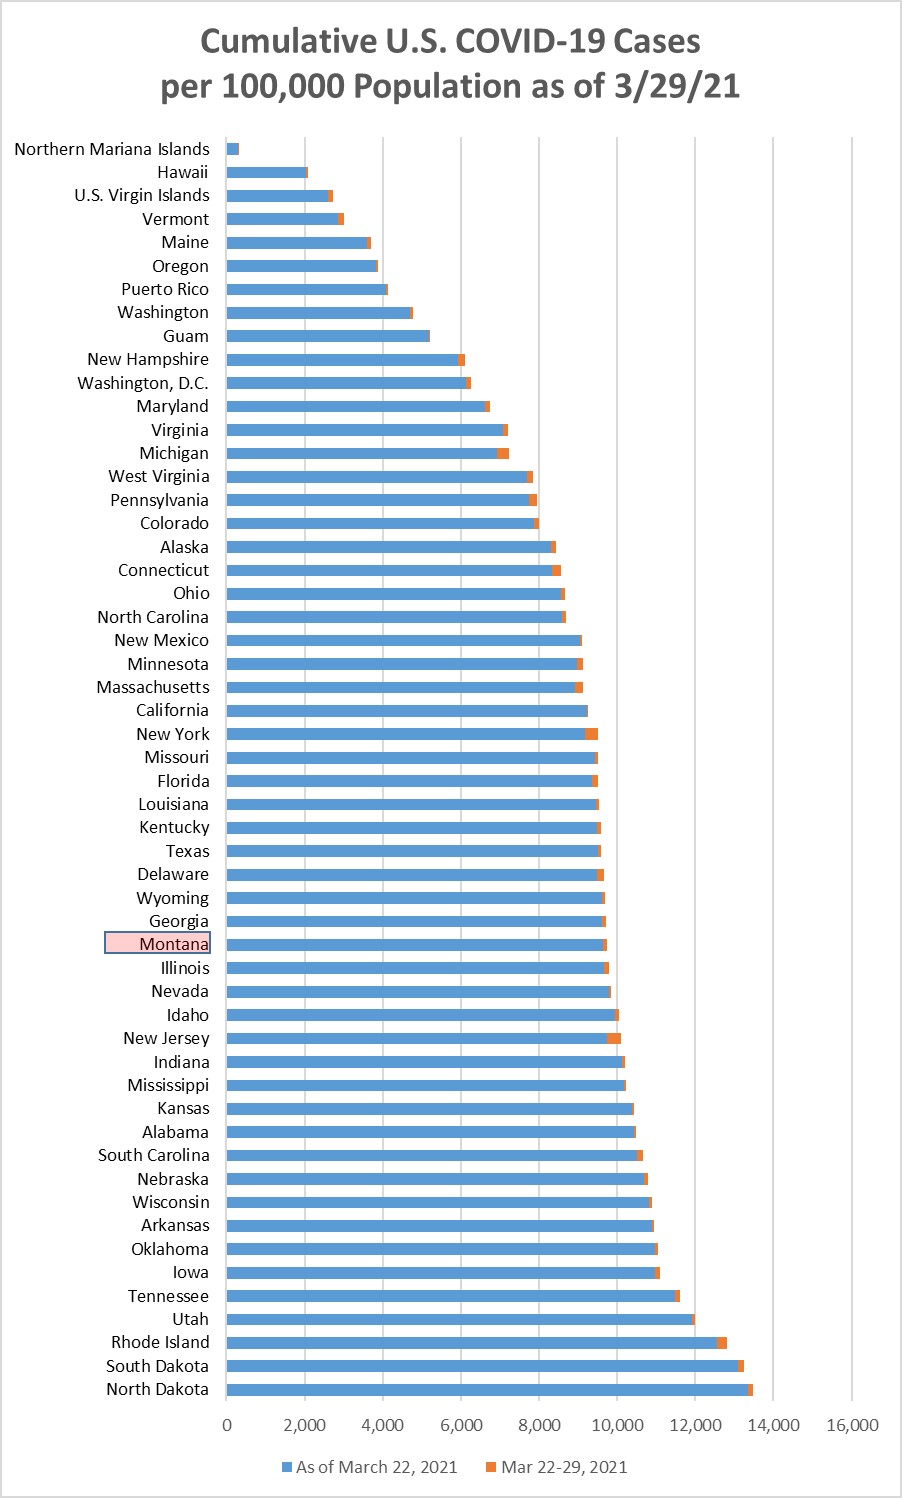
Chart 2 shows the same information as Chart 1, but with the overall cumulative cases
per 100k in each state to April 5. Montana remains in position 35/55 (21st highest).
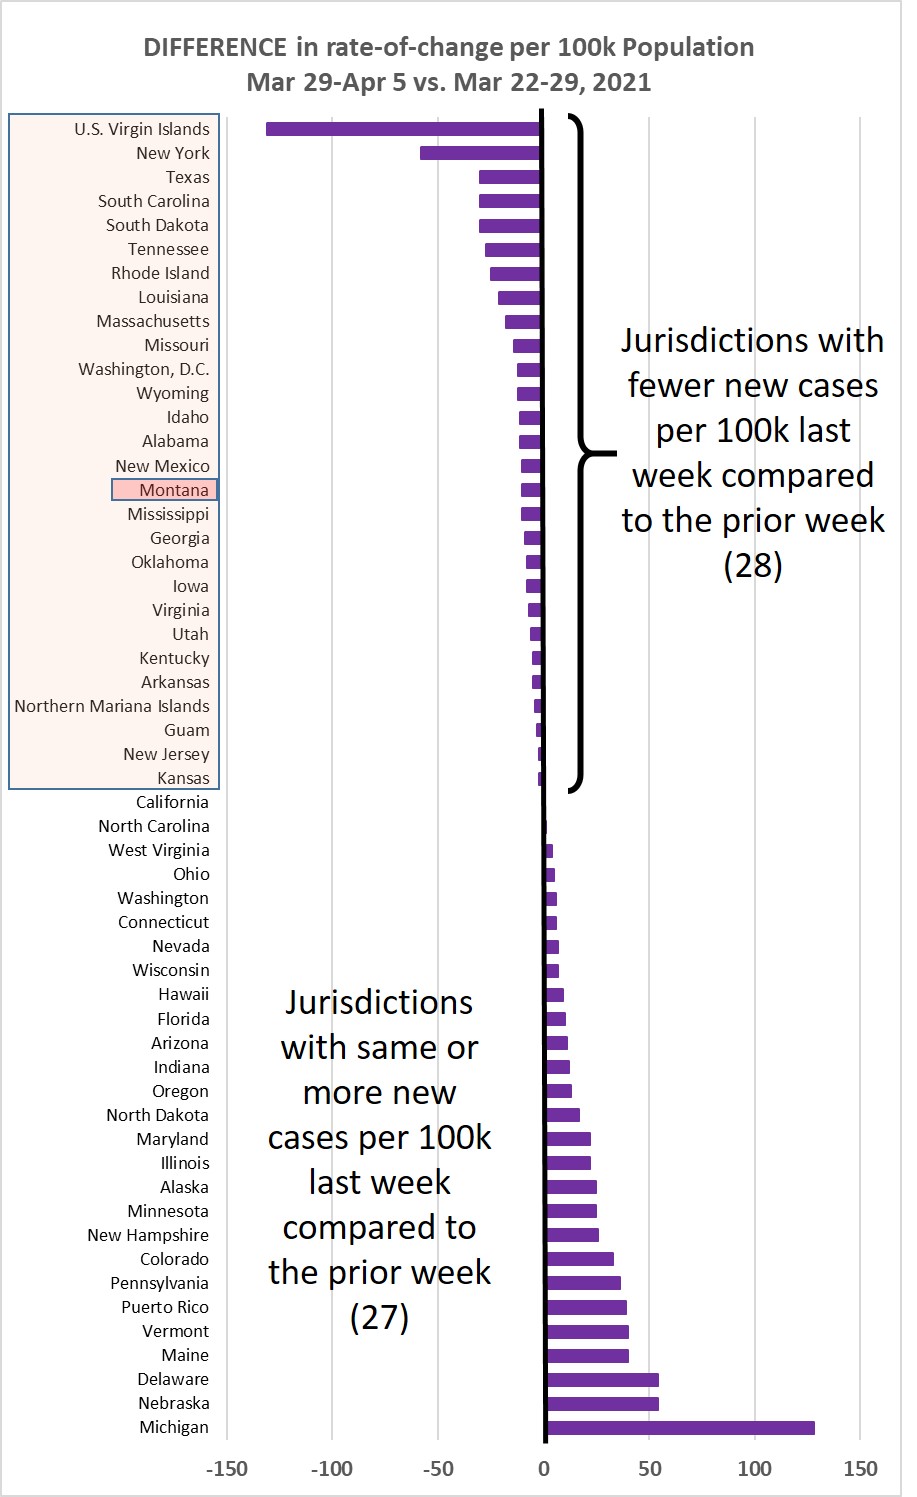
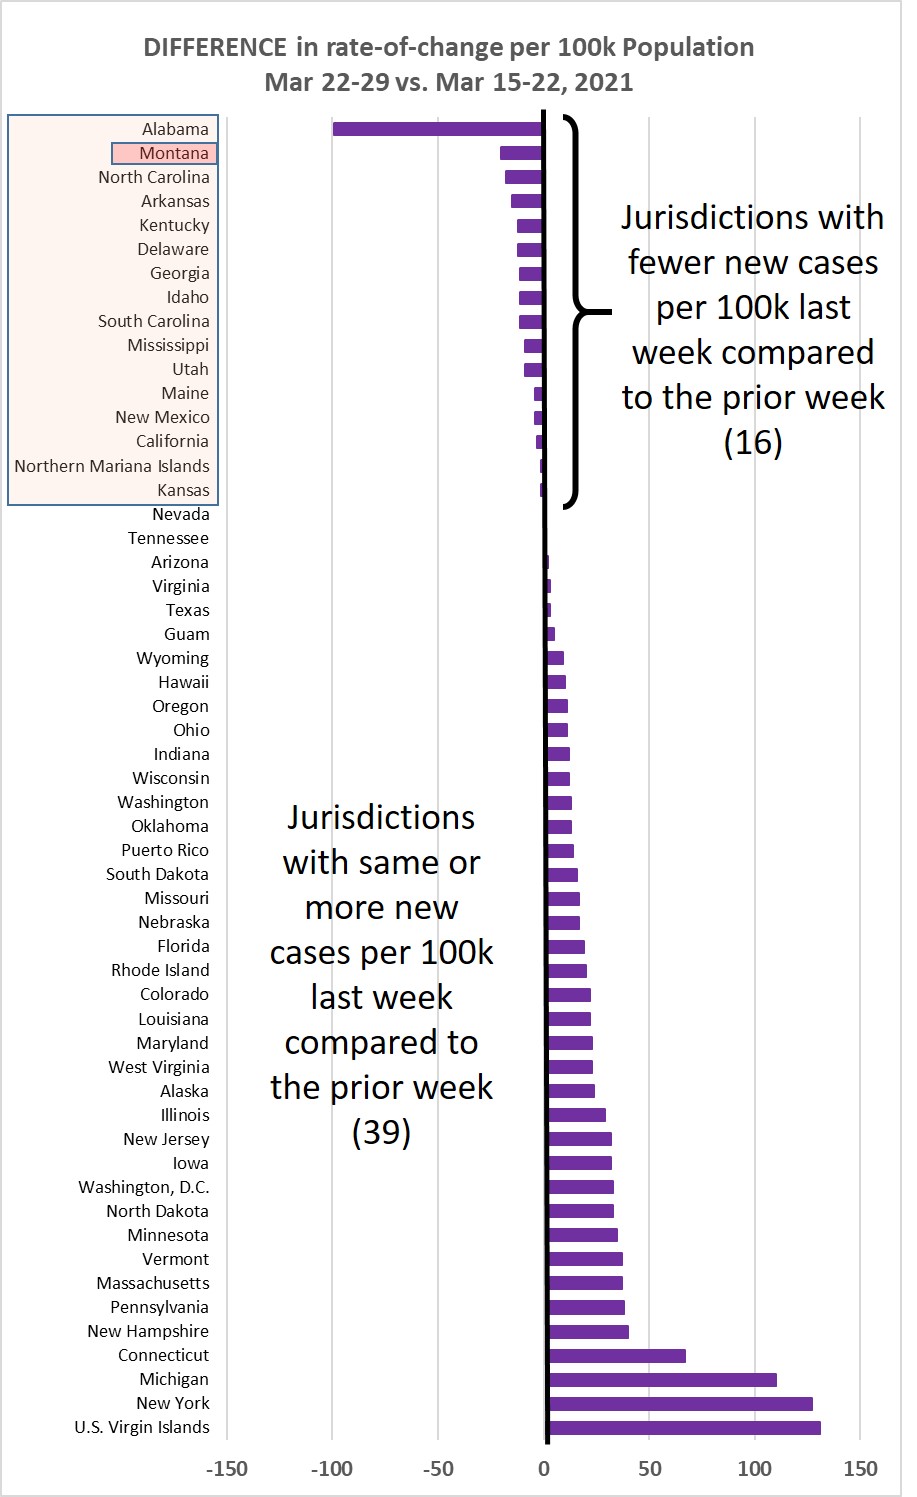
Chart 3 shows the difference in weekly new cases per 100k population for Mar. 29-Apr.
5, vs. Mar. 22-29, 2021. This past week 27/55 jurisdictions (49%) showed a higher
rate of new cases, down from 70.9% increasing the prior week.
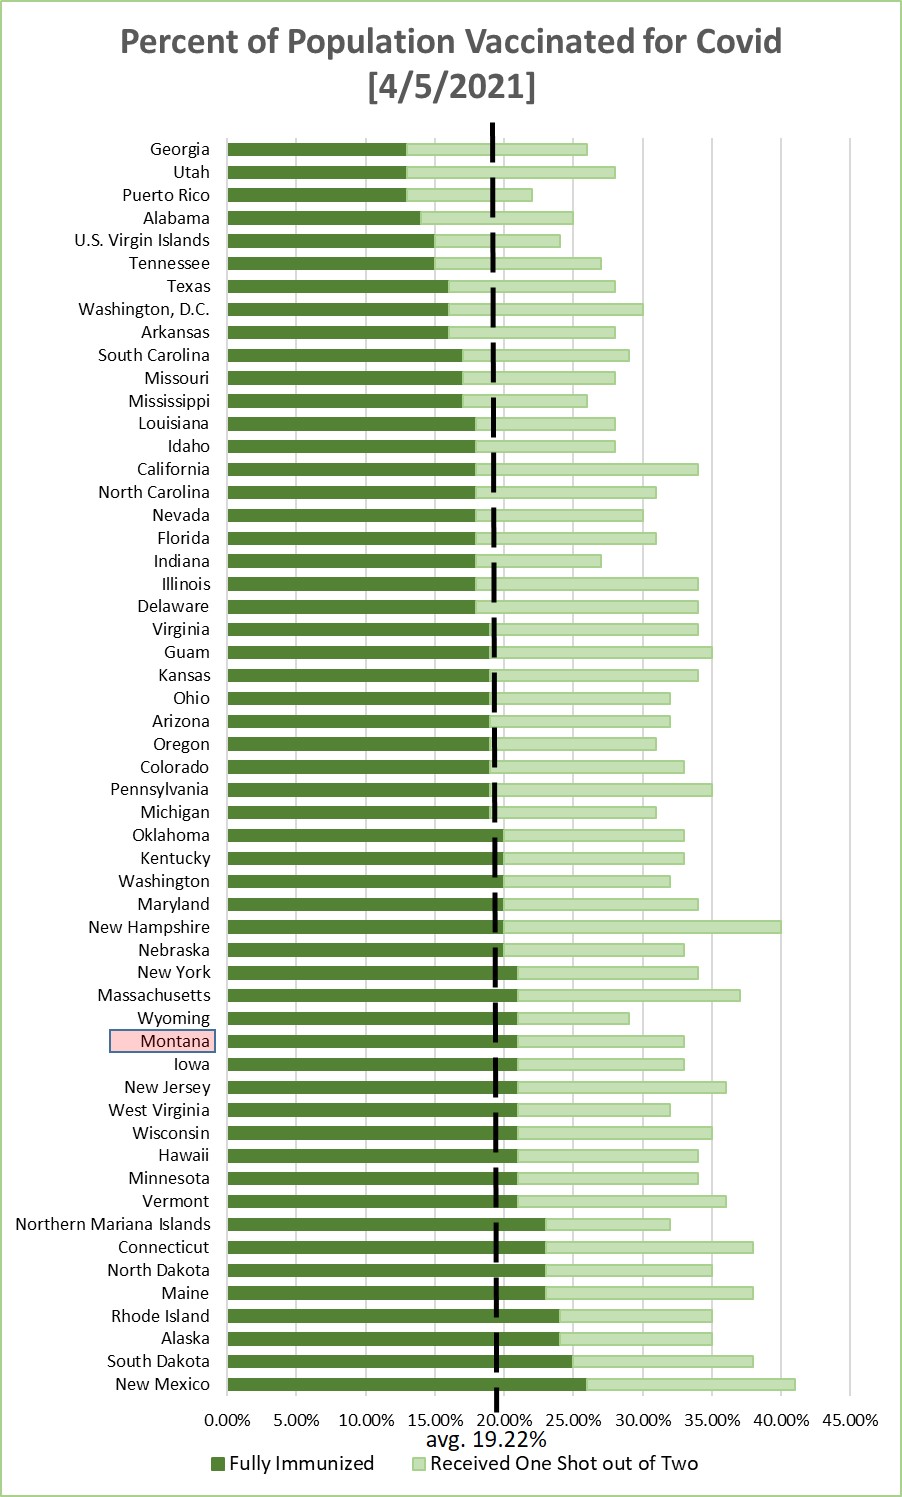
Chart 4 shows the percentage of the population in each jurisdiction having received
1 or 2 Covid-19 vaccination shots. This is sorted by the fraction that have received
2 shots--or one shot of the J&J vaccine. Average across the 55 jurisdictions is 19.22%
being fully immunized--a weekly increase of about 2.9%.

Immunity Estimate
Monday, March 29, 2021
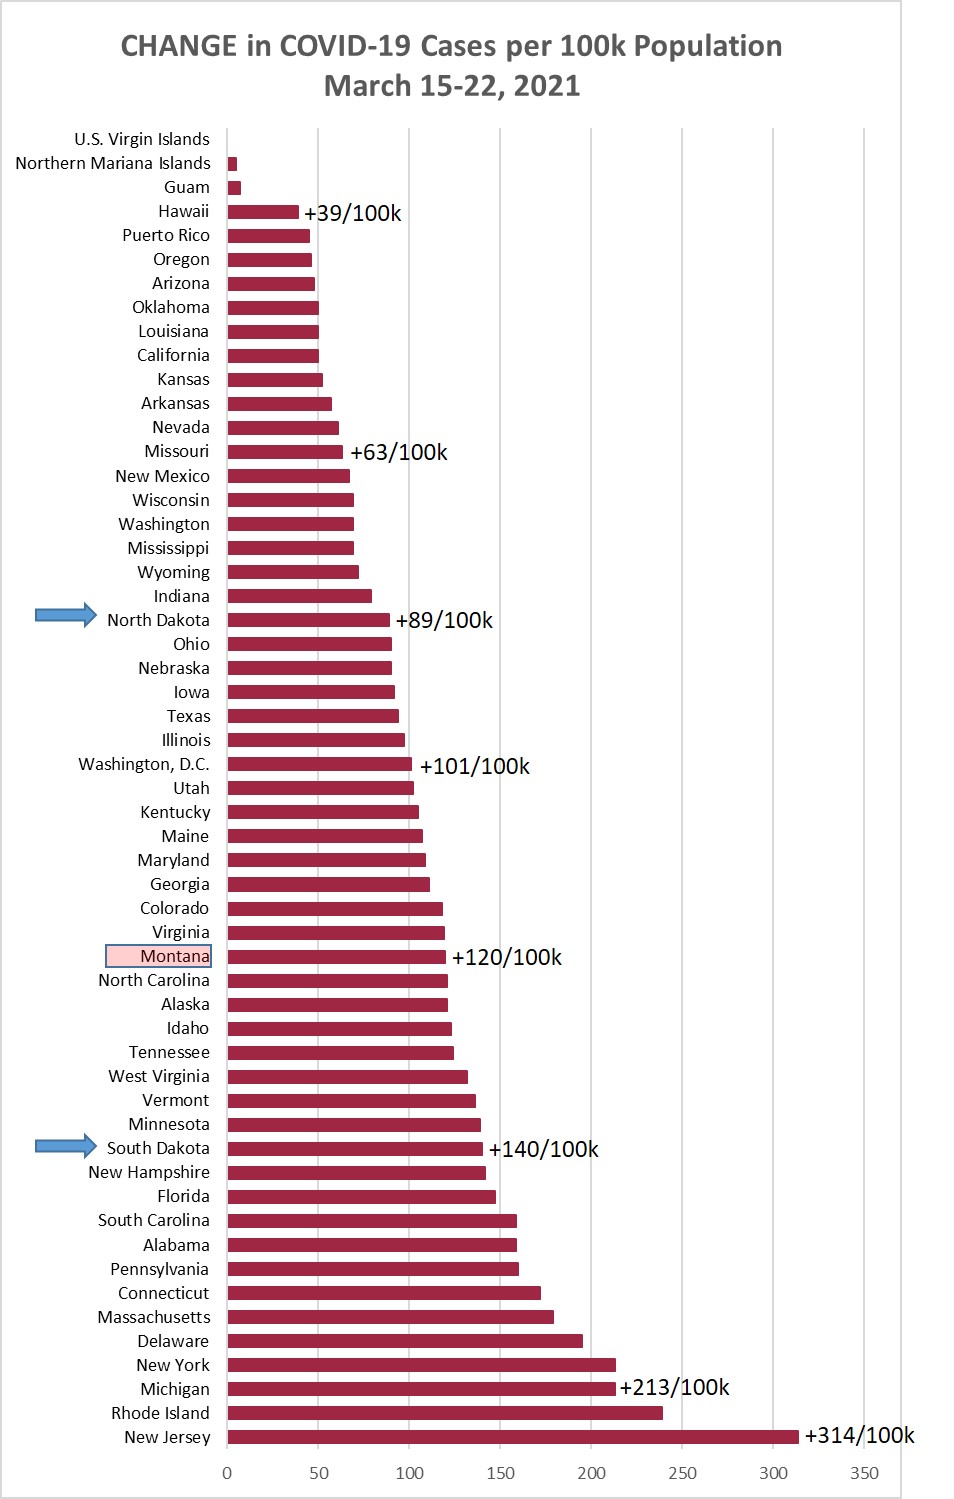
Chart 1 shows the change in cases per 100,000 population as of this morning (March
29, 2021) compared to the cases per 100,000 on March 22, 2021. Montana was up +100/100k
this week, compared to +120/100k last week.
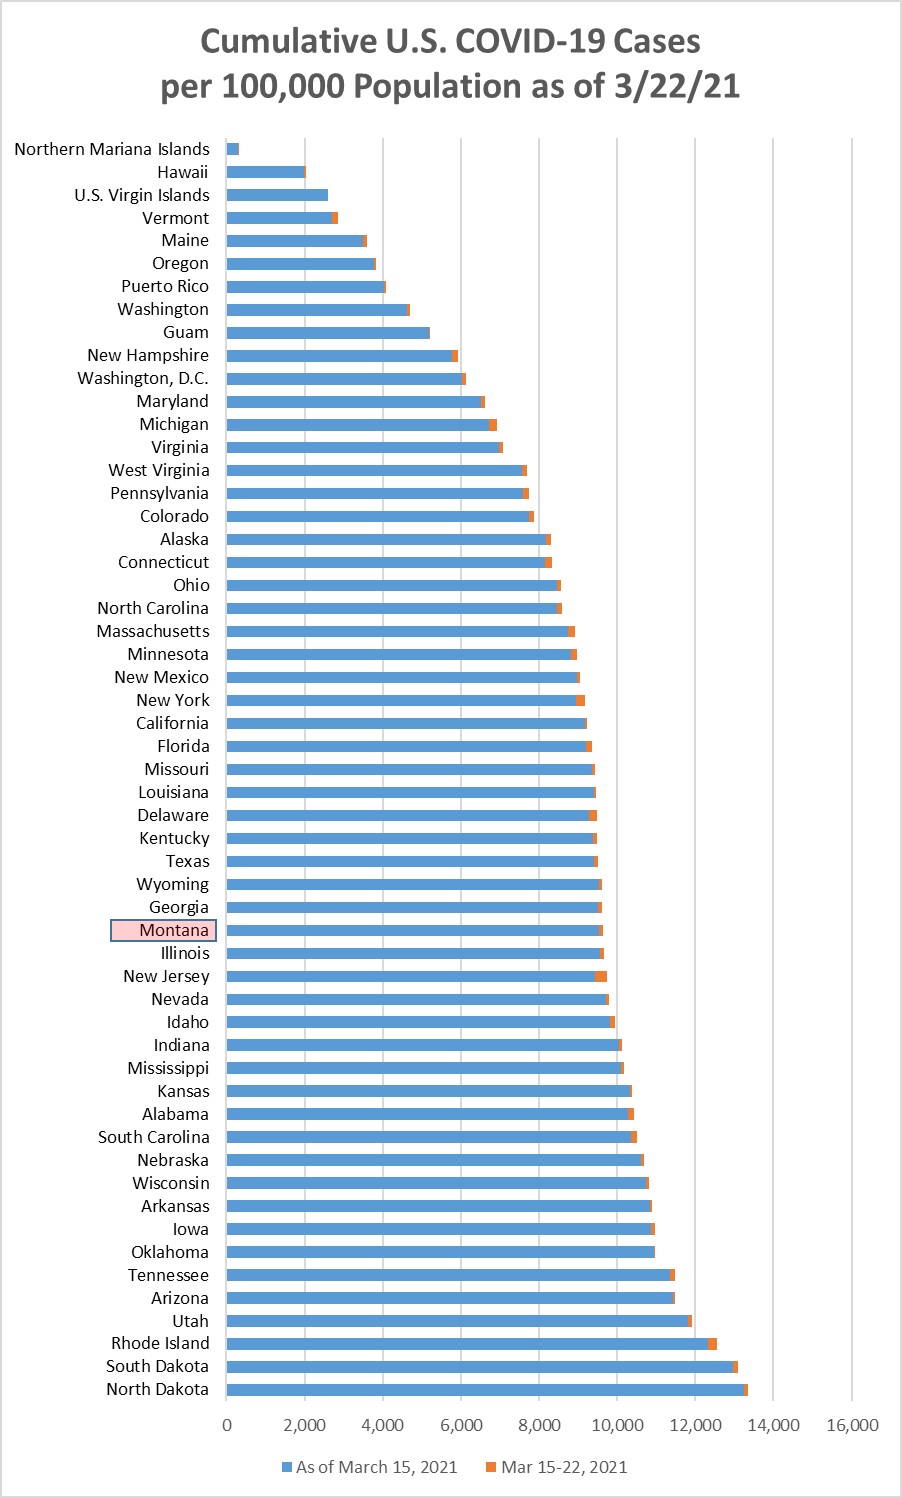
Chart 2 shows the same information as Chart 1, but with the overall cumulative cases
per 100k in each state to March 29. Montana remains in position 35/55 (21st highest).
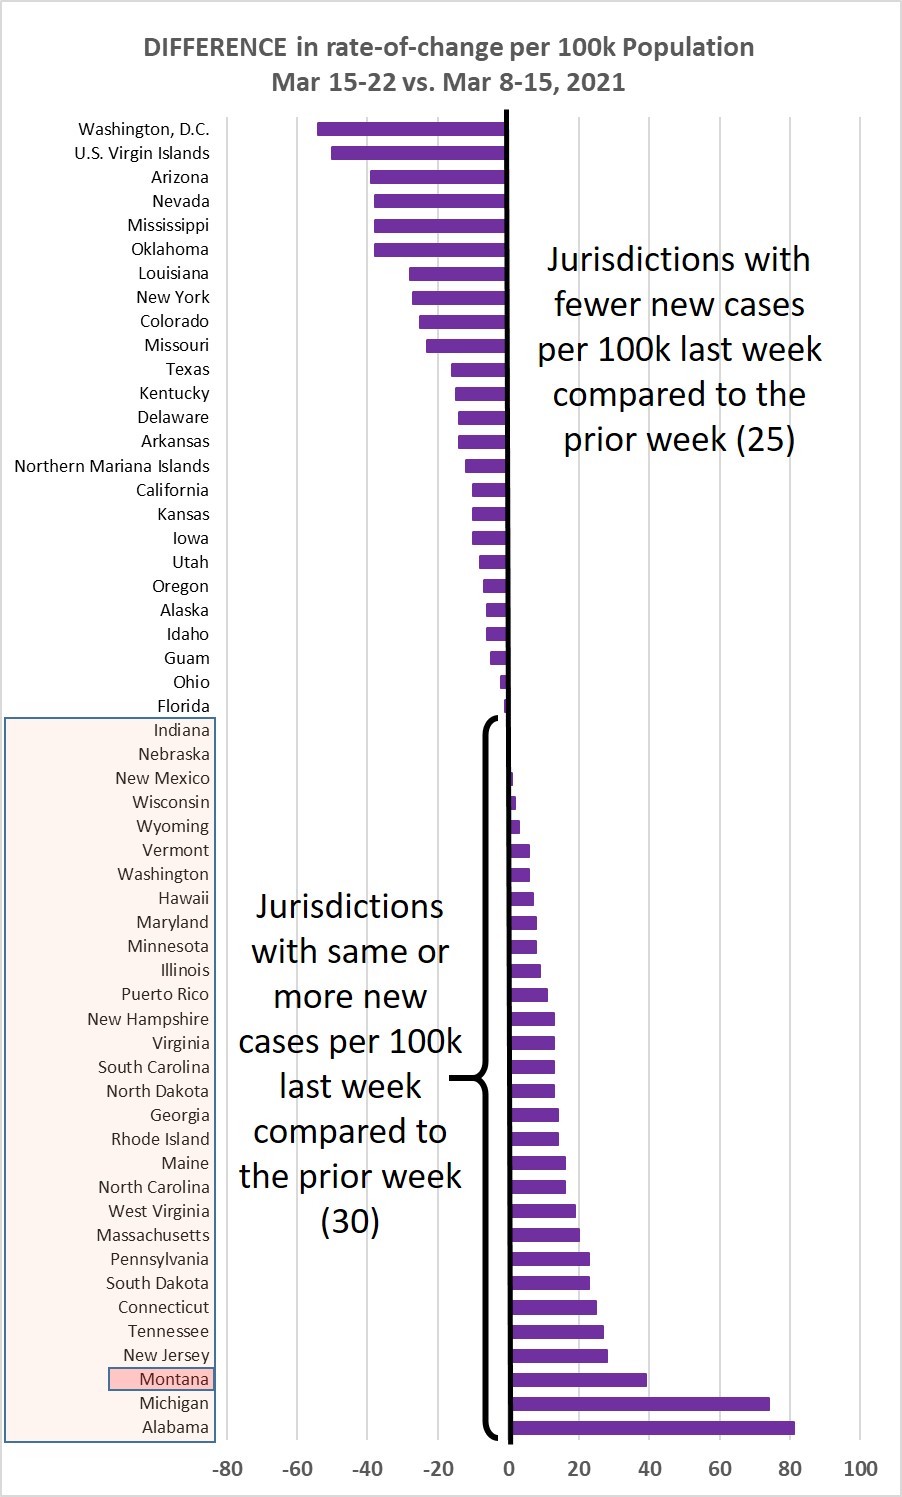
Chart 3 shows the difference in weekly new cases per 100k population for Mar. 22-29,
vs. Mar. 15-22, 2021. This past week 39/55 jurisdictions (71%) showed a higher rate
of new cases, up from 54.5% increasing the prior week. This is not desirable.
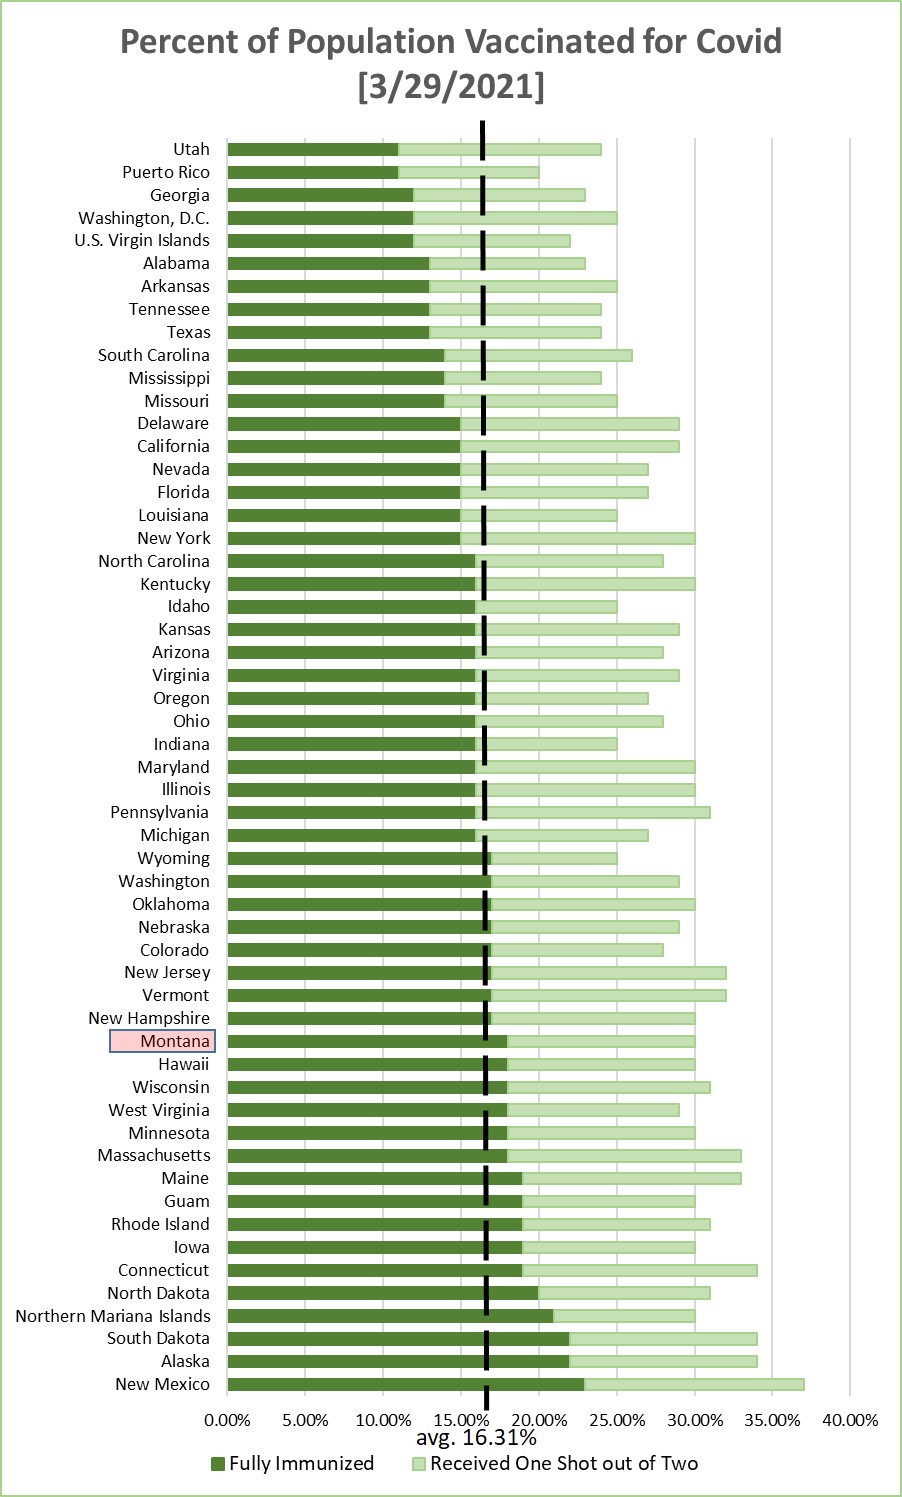
Chart 4 shows the percentage of the population in each jurisdiction having received
1 or 2 Covid-19 vaccination shots. This is sorted by the fraction that have received
2 shots--or one shot of the J&J vaccine. Average across the 55 jurisdictions is 16.31%
being fully immunized--a weekly increase of about 2.3%.
Monday, March 22, 2021
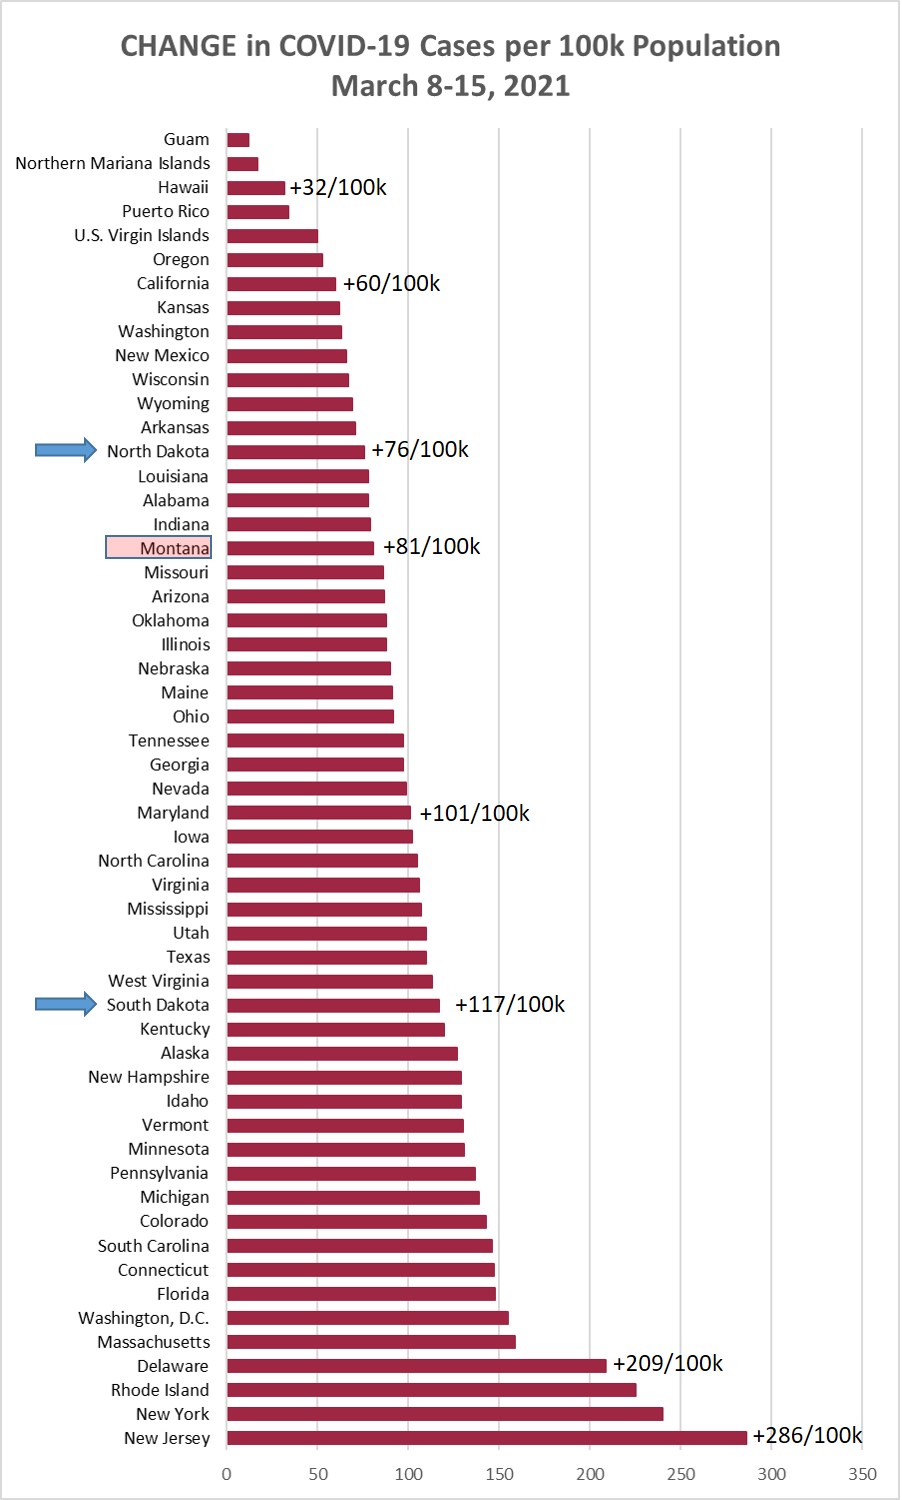
Chart 1 shows the change in cases per 100,000 population as of this morning (March
22, 2021) compared to the cases per 100,000 on March 15, 2021. Montana was up +120/100k
this week, which reversed our downward trend. Weekly new cases in the prior two weeks
were +81 and +91.
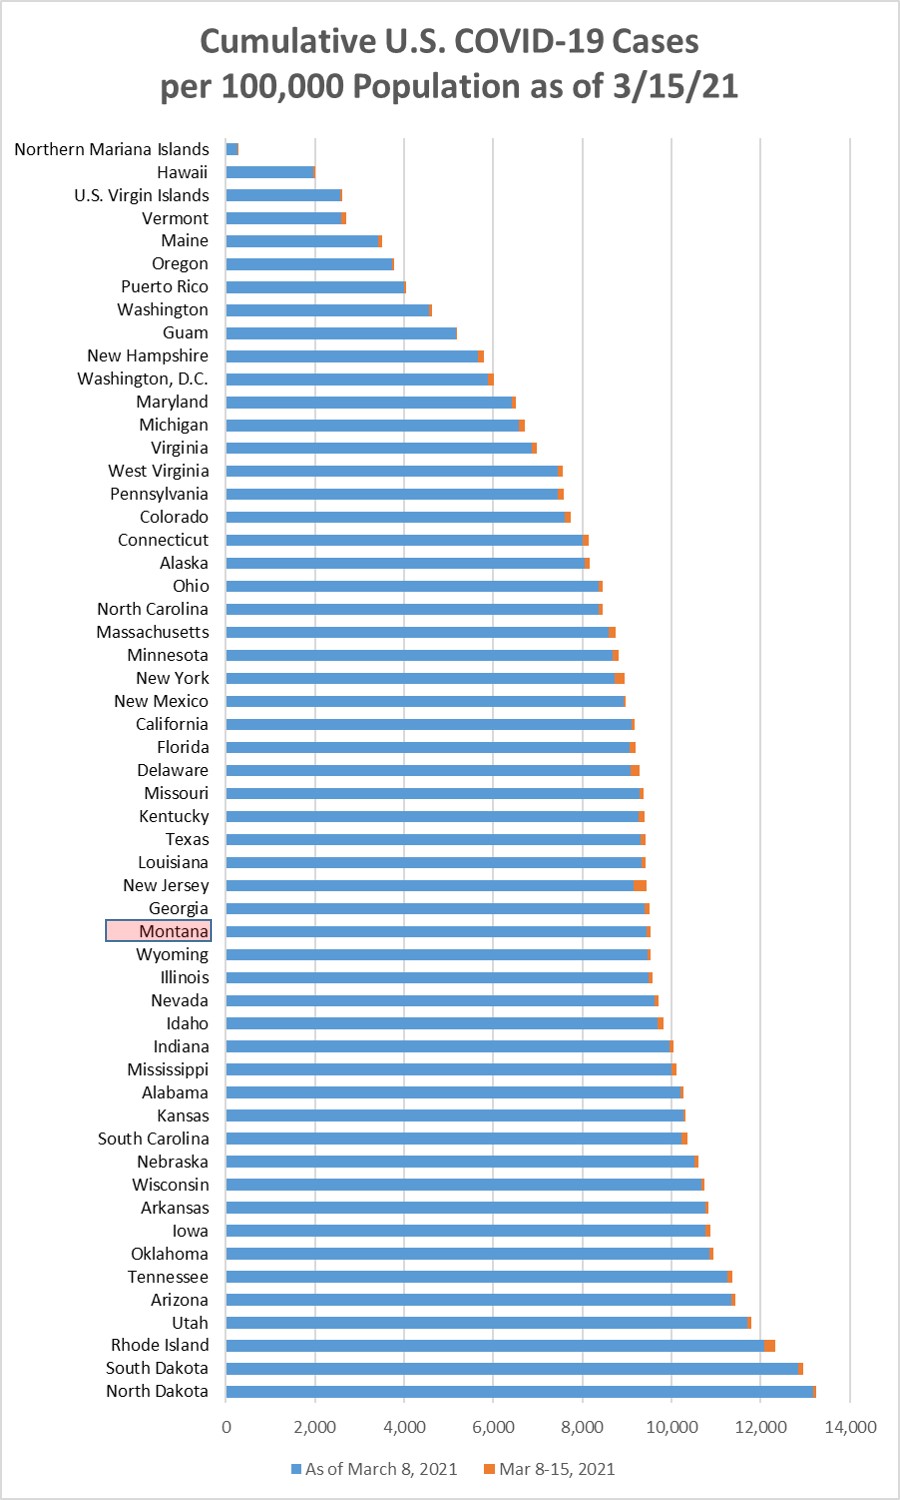
Chart 2 shows the same information as Chart 1, but with the overall cumulative cases
per 100k in each state to March 22. Montana remains in position 35/55 (21st highest).
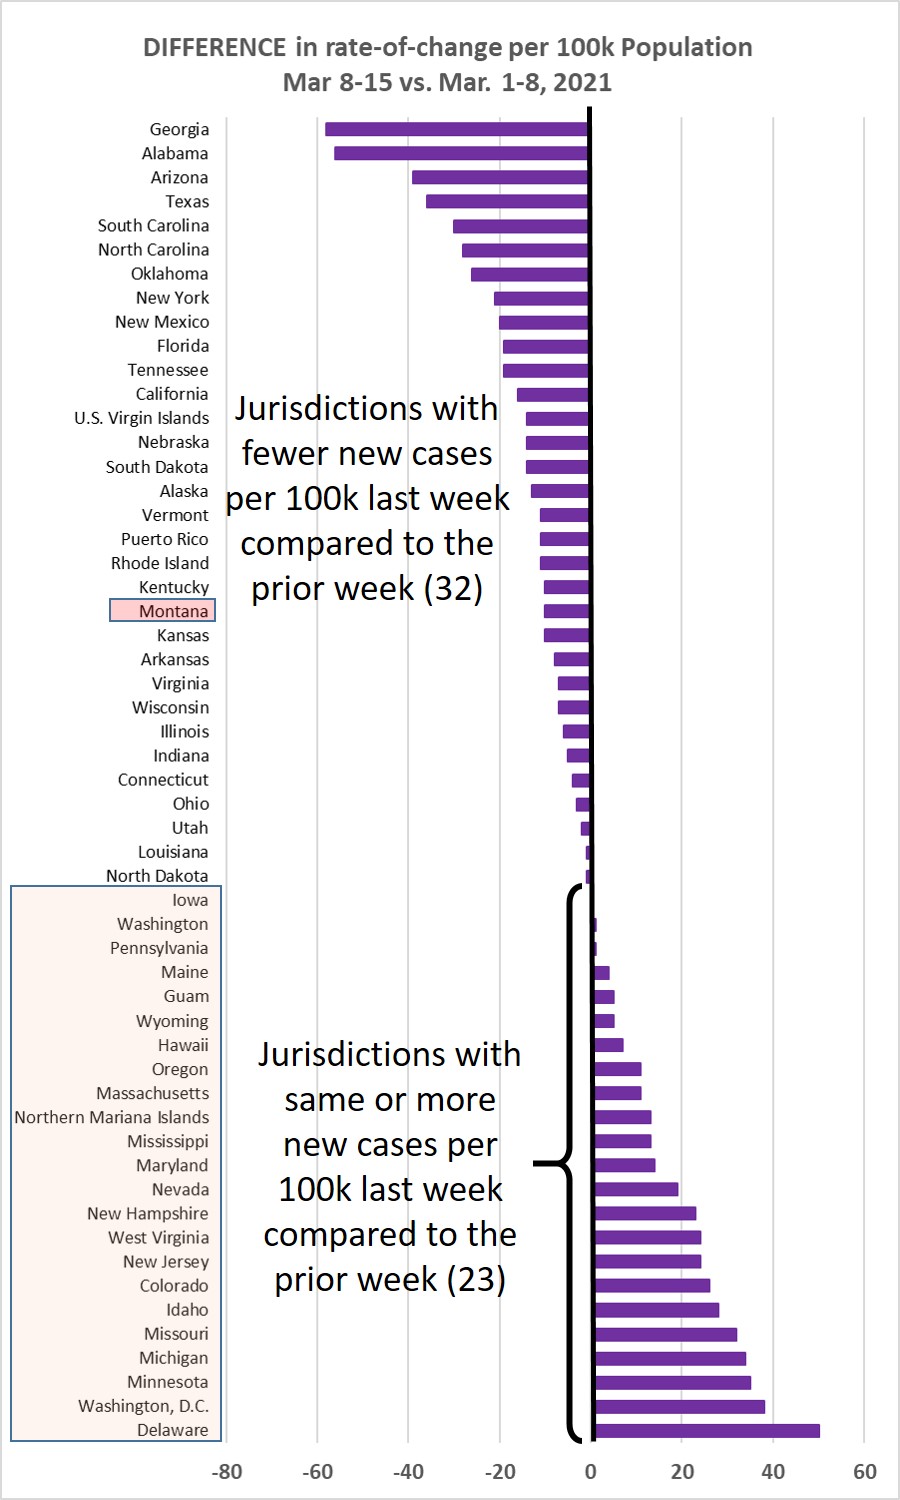
Chart 3 shows the difference in weekly new cases per 100k population for Mar 15-22,
vs. Mar. 8-15,2021. This past week just 22/55 jurisdictions (45.5%) showed a lower
rate of new cases. The majority of jurisdictions (30/55, 54.5%) showed more new cases
this past week than the prior week.
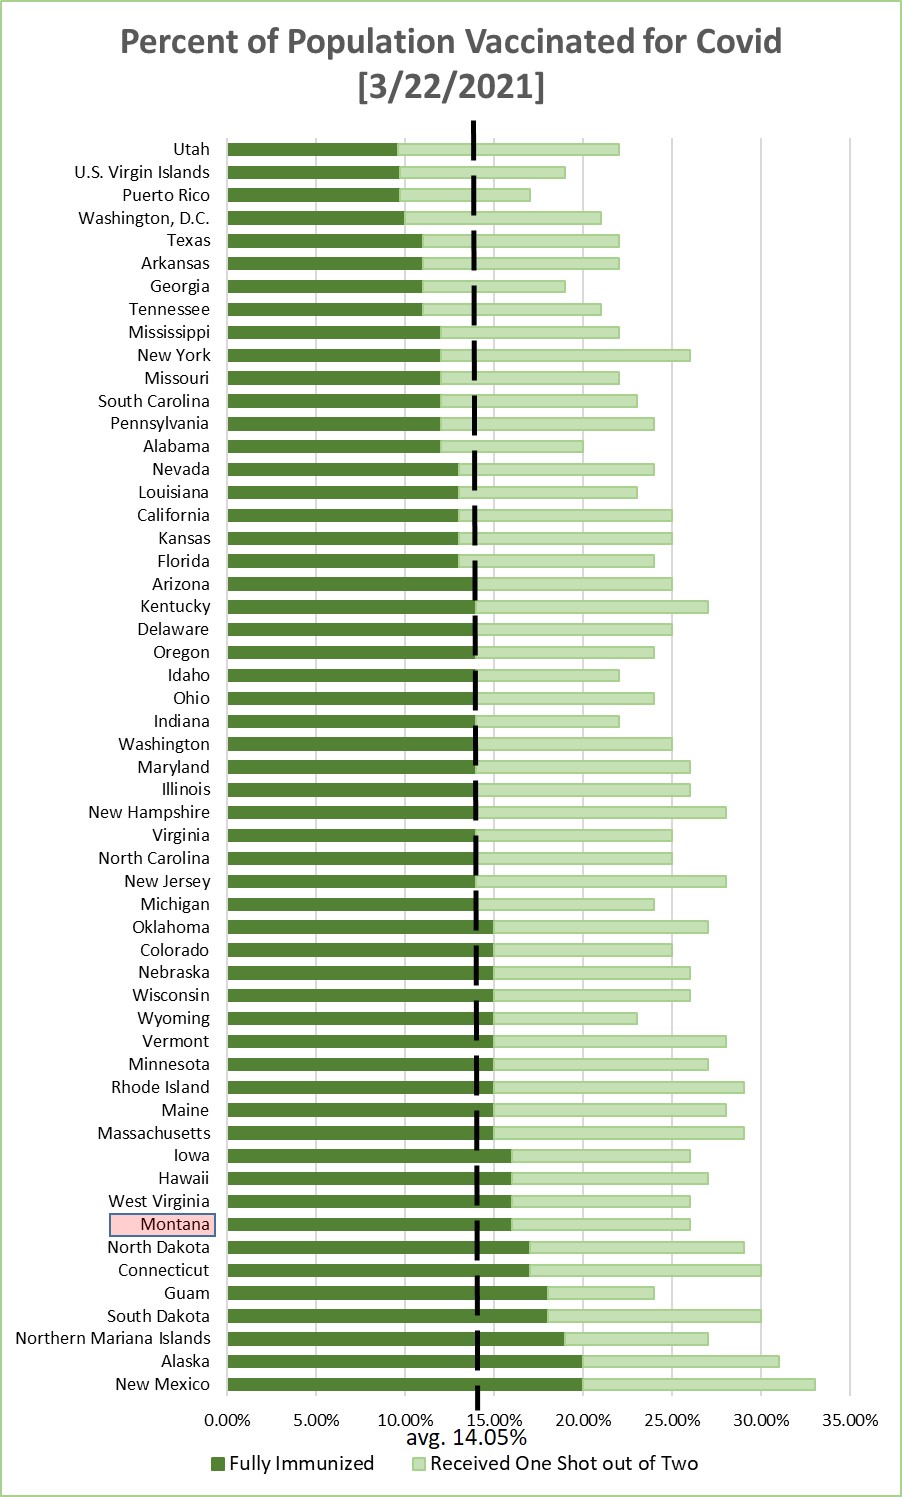
Chart 4 shows the percentage of the population in each jurisdiction having received
1 or 2 Covid-19 vaccination shots. This is sorted by the fraction that have received
2 shots--or one shot of the J&J vaccine. Average across the 55 jurisdictions is 14.05%
being fully immunized--a weekly increase of about 1.9%.
Monday, March 15, 2021
Chart 1 shows the change in cases per 100,000 population as of this morning (March
15, 2021) compared to the cases per 100,000 on March 8, 2021. Montana was up +81/100k
this week, which continues the downward trend in weekly new cases from +91, +114,
and +126 the prior three weeks. New cases rate in Montana is about what it was back
in August and September, 2020.
Chart 2 shows the same information as Chart 1, but with the overall cumulative cases
per 100k in each state to March 15. Montana remains in position 35/55 (21st highest).
Chart 3 shows the difference in weekly new cases per 100k population for Mar. 8-15,
vs. Mar. 1-8, 2021. This past week 32/55 jurisdictions (58%) showed a lower rate of
new cases. The increasing rates in Delaware, Washington, D.C., Minnesota, etc., are
a reminder that the virus is still circulating.
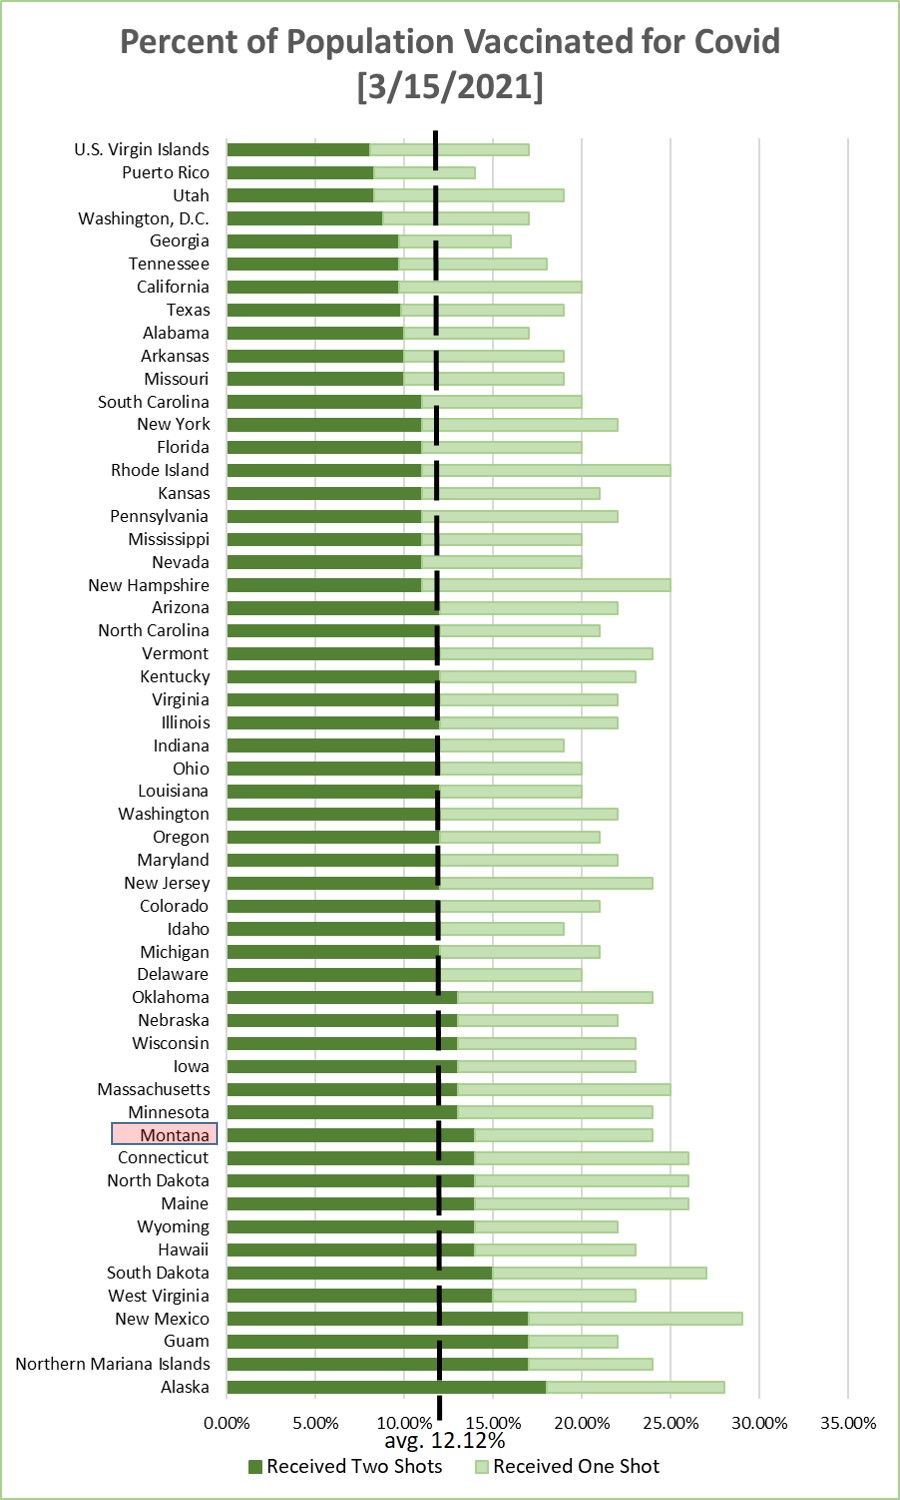
Chart 4 shows the percentage of the population in each jurisdiction having received
1 or 2 Covid-19 vaccination shots. This is sorted by the fraction that have received
2 shots--or one shot of the J&J vaccine. Average across the 55 jurisdictions is 12.12%
being fully immunized--a weekly increase of about 2.3%.
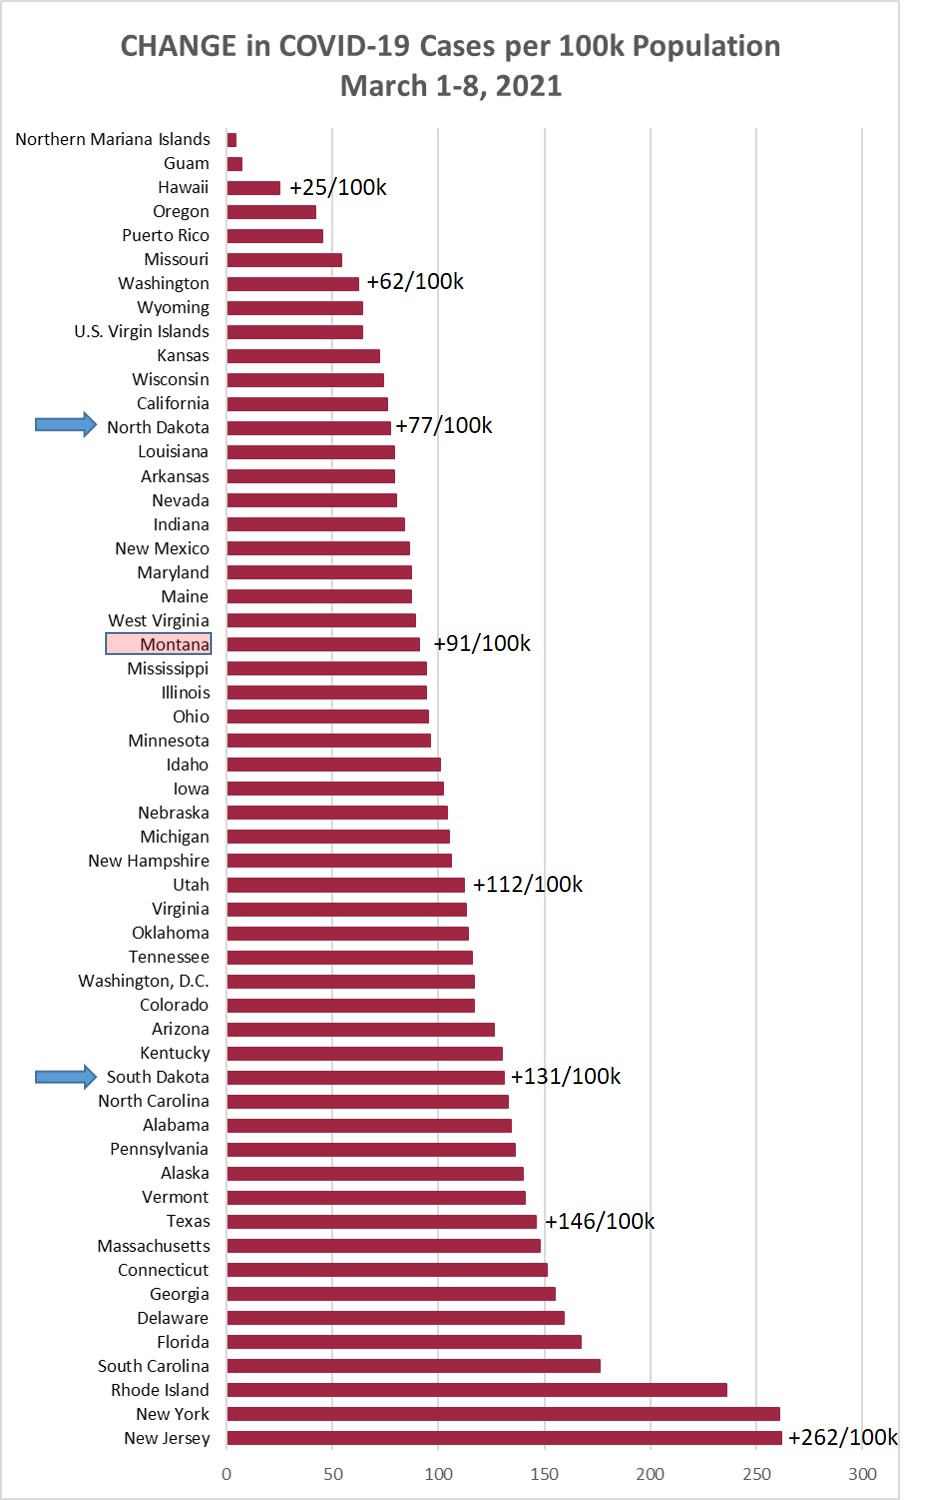
Monday, March 8, 2021
Chart 1 shows the change in cases per 100,000 population as of this morning (March
8, 2021) compared to the cases per 100,000 on March 1, 2021. Montana was up +91/100k
this week, which continues the downward trend in weekly new cases from +114, +126,
+151, +174, and +215 the prior five weeks. This was the first week with fewer than
100/100k new cases in Montana since 9/14/2020.
Chart 2 shows the same information as Chart 1, but with the overall cumulative cases
per 100k in each state to March 8. Montana remains in position 35/55 (21st highest).
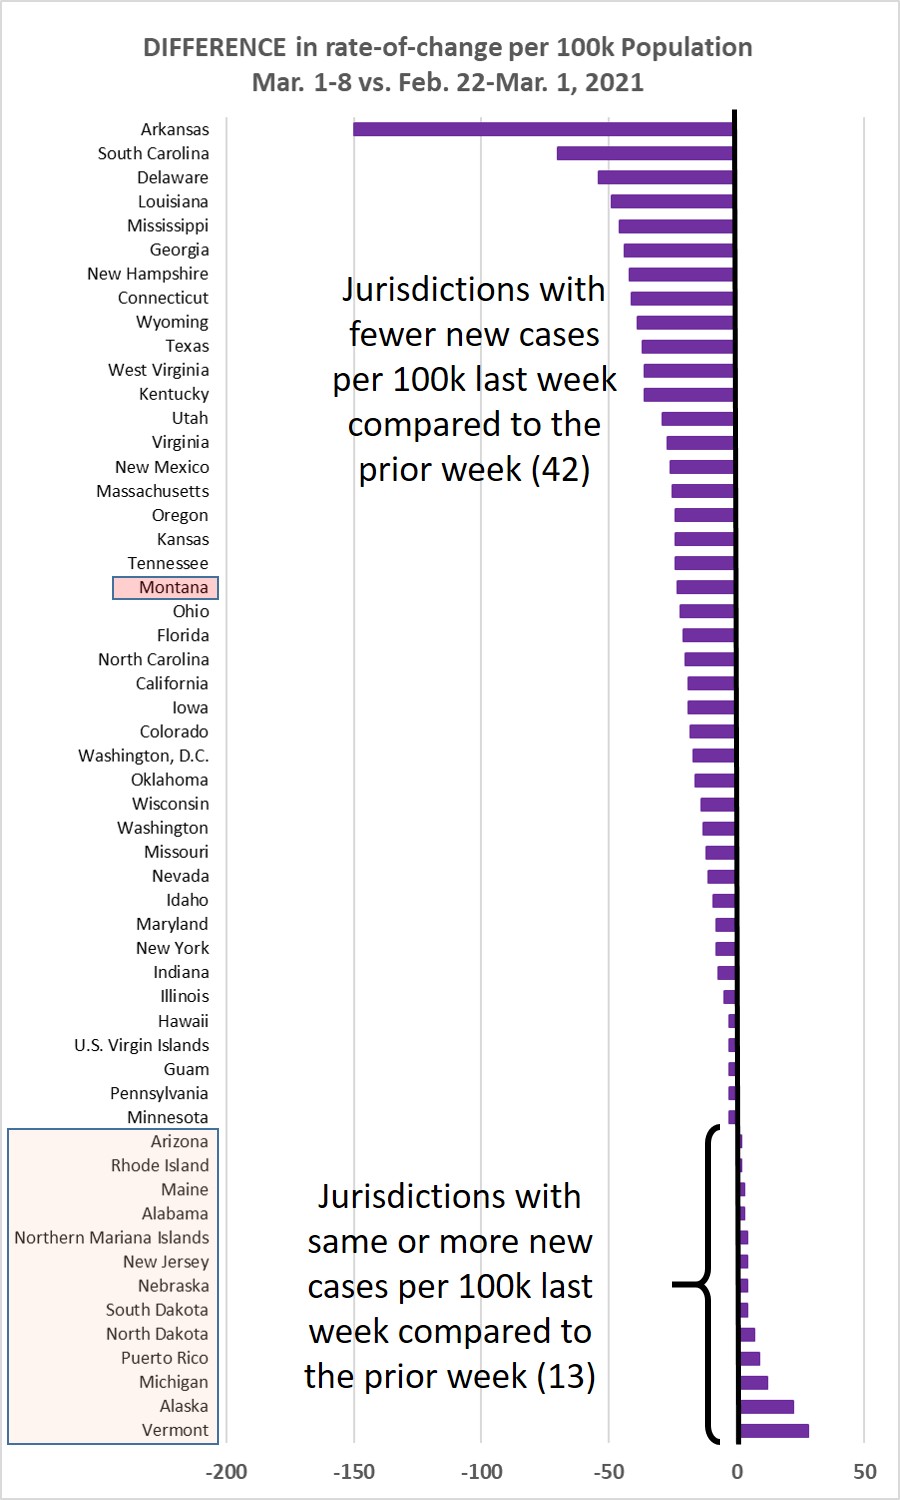
Chart 3 shows the difference in weekly new cases per 100k population for Mar. 1-8,
vs Feb. 22 - Mar. 1, 2021. This past week 42/55 jurisdictions (76%) showed a lower
rate of new cases, and the 13 jurisdictions with an increasing rate of new cases showed
very small increments. That is good.
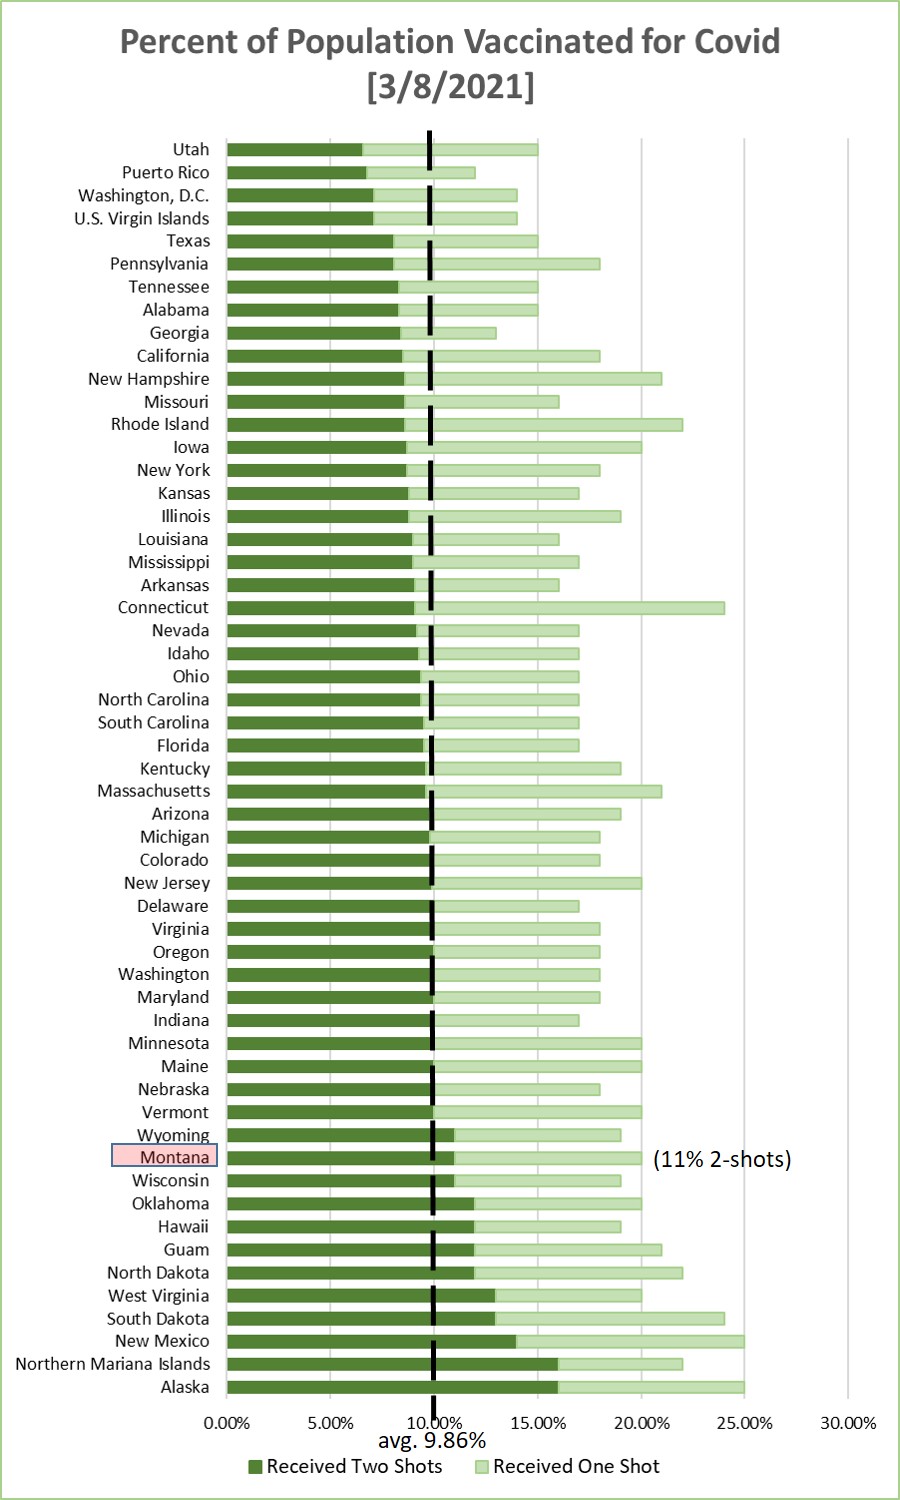
Chart 4 shows the percentage of the population in each jurisdiction having received
1 or 2 Covid-19 vaccination shots. This is sorted by the fraction that have received
2 shots. Average across the 55 jurisdictions is 9.86% having 2 shots--a weekly increase
of about 1.8%.

Monday, March 1, 2021
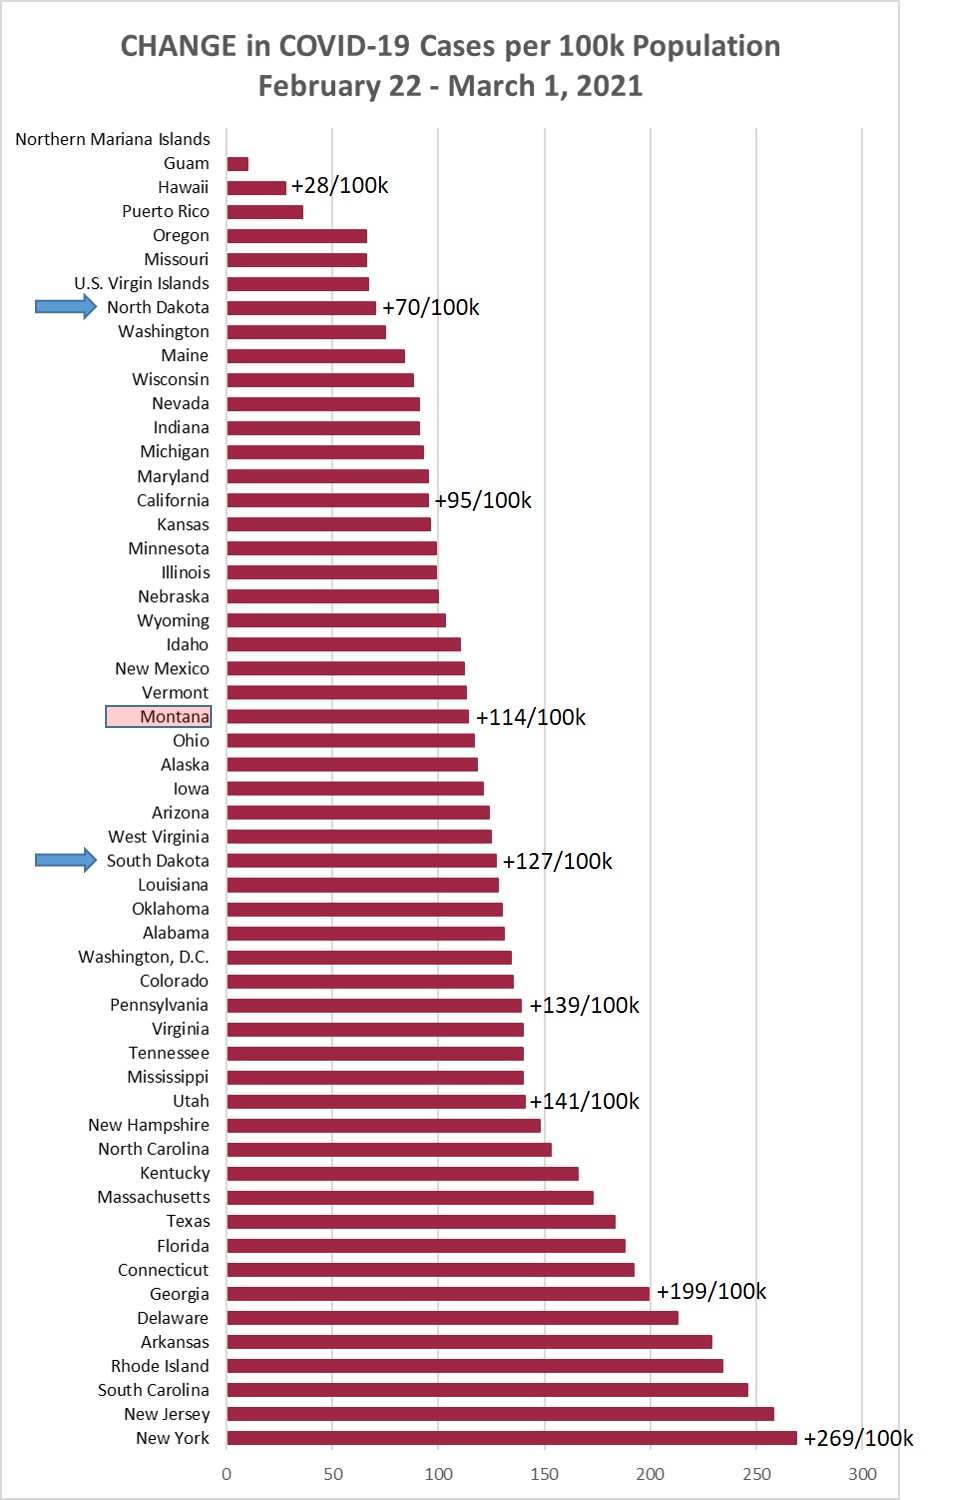
Chart 1 shows the change in cases per 100,000 population as of this morning (March
1, 2021) compared to the cases per 100,000 on February 22, 2021. Montana was up +114/100k
this week, which was fewer new cases compared to the +126, +151, +174, and +215 the
prior four weeks.
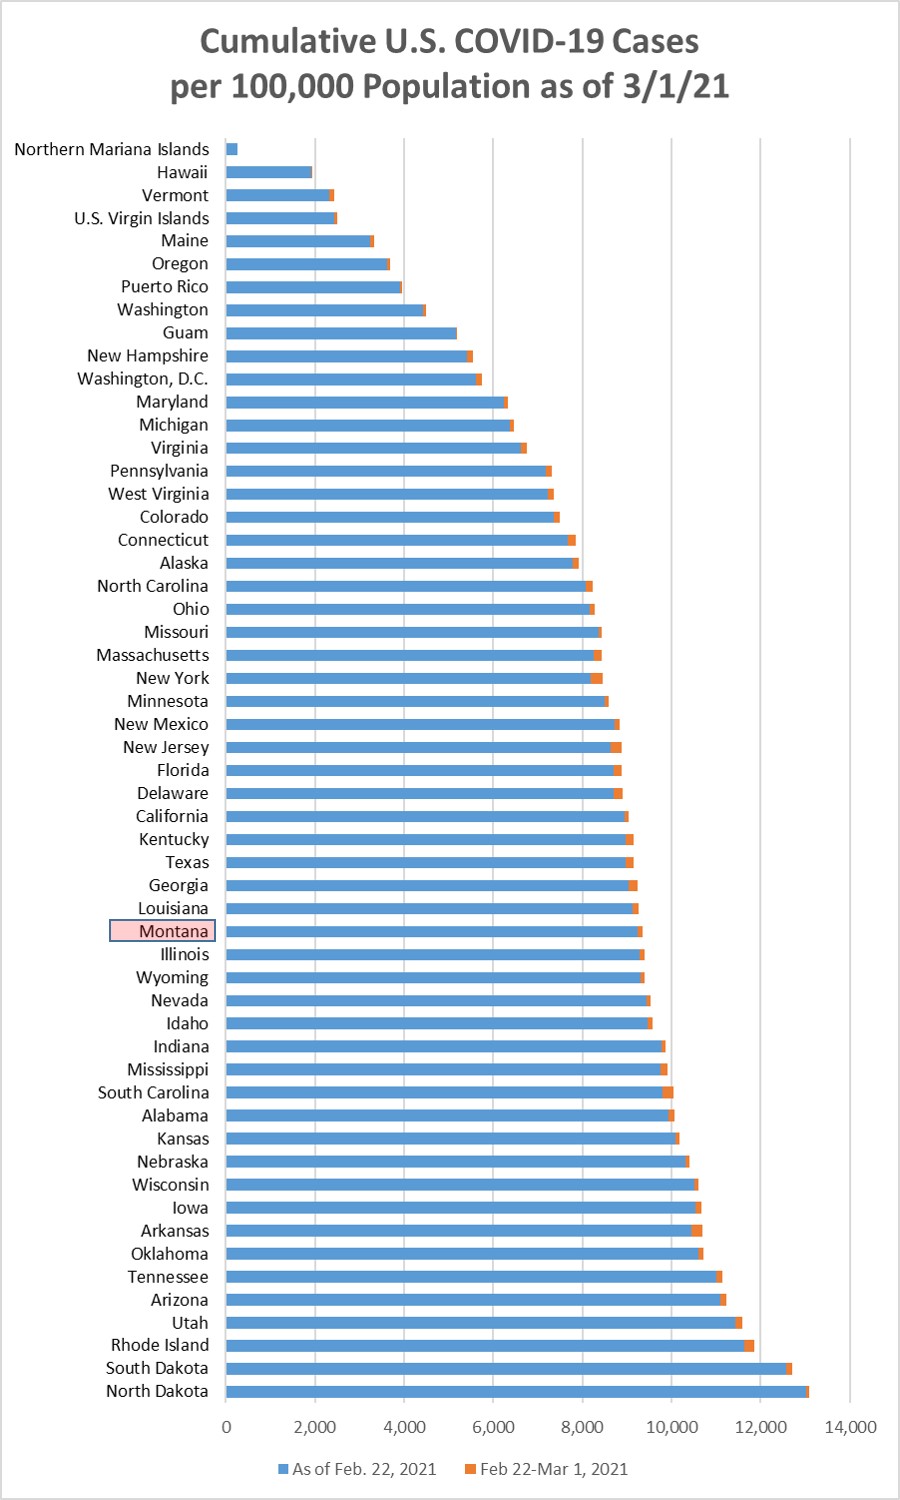
Chart 2 shows the same information as Chart 1, but with the overall cumulative cases
per 100k in each state to March 1. Montana remains in position 35/55 (21st highest).
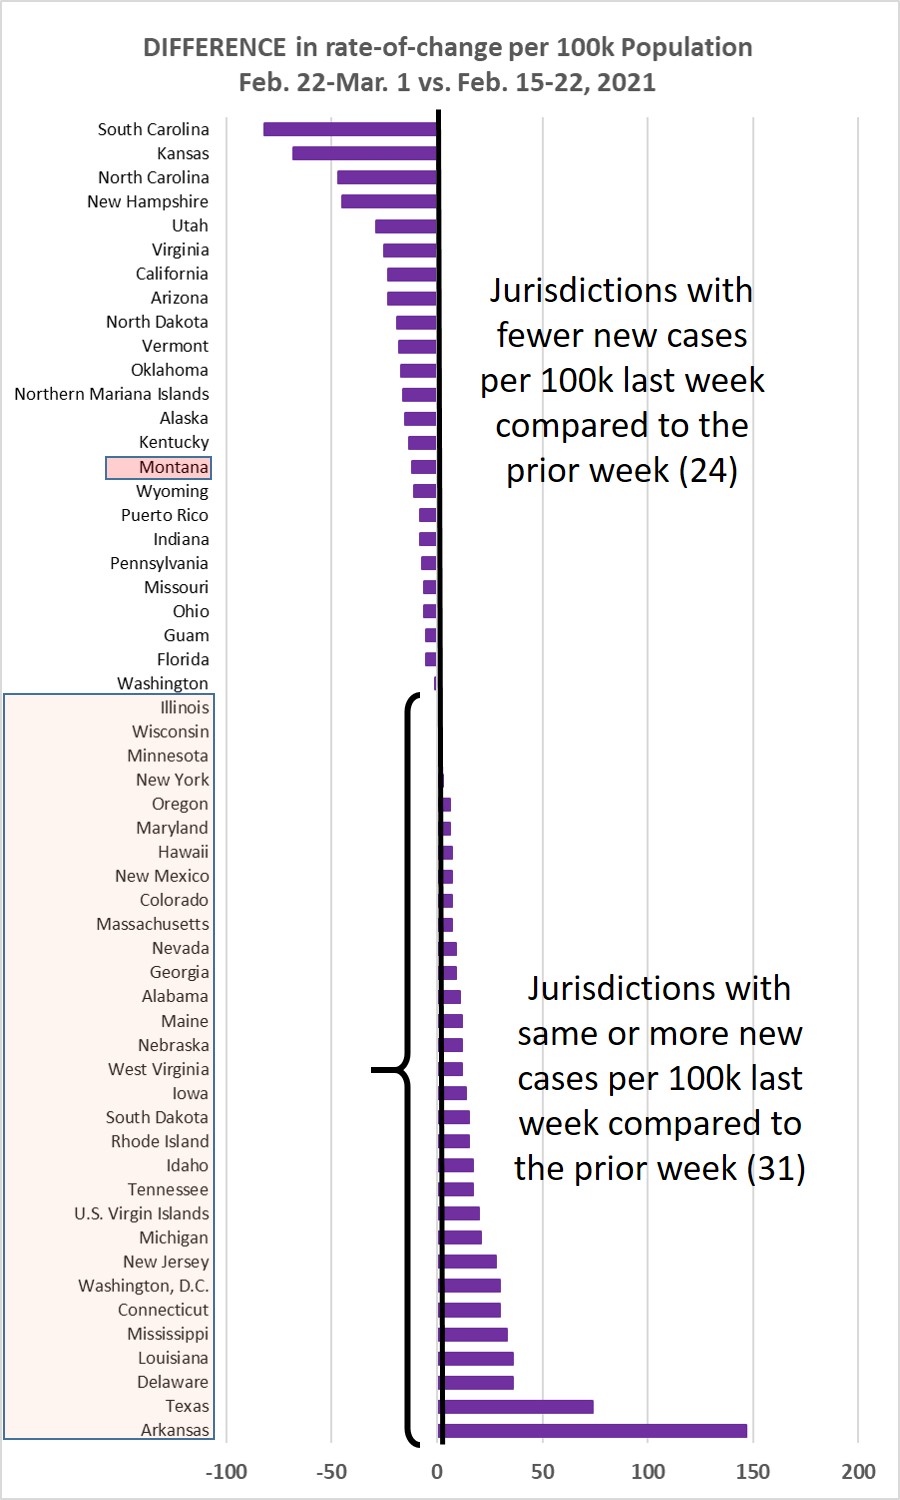
Chart 3 shows the difference in weekly new cases per 100k population for Feb. 22 -
Mar. 1, vs. Feb. 15-22, 2021. This past week only 24/55 jurisdictions (44%) showed
a lower rate of new cases. The prior week 87% showed a rate decrease. We seem to have
leveled off--hope we return to declining rates of new cases next week.
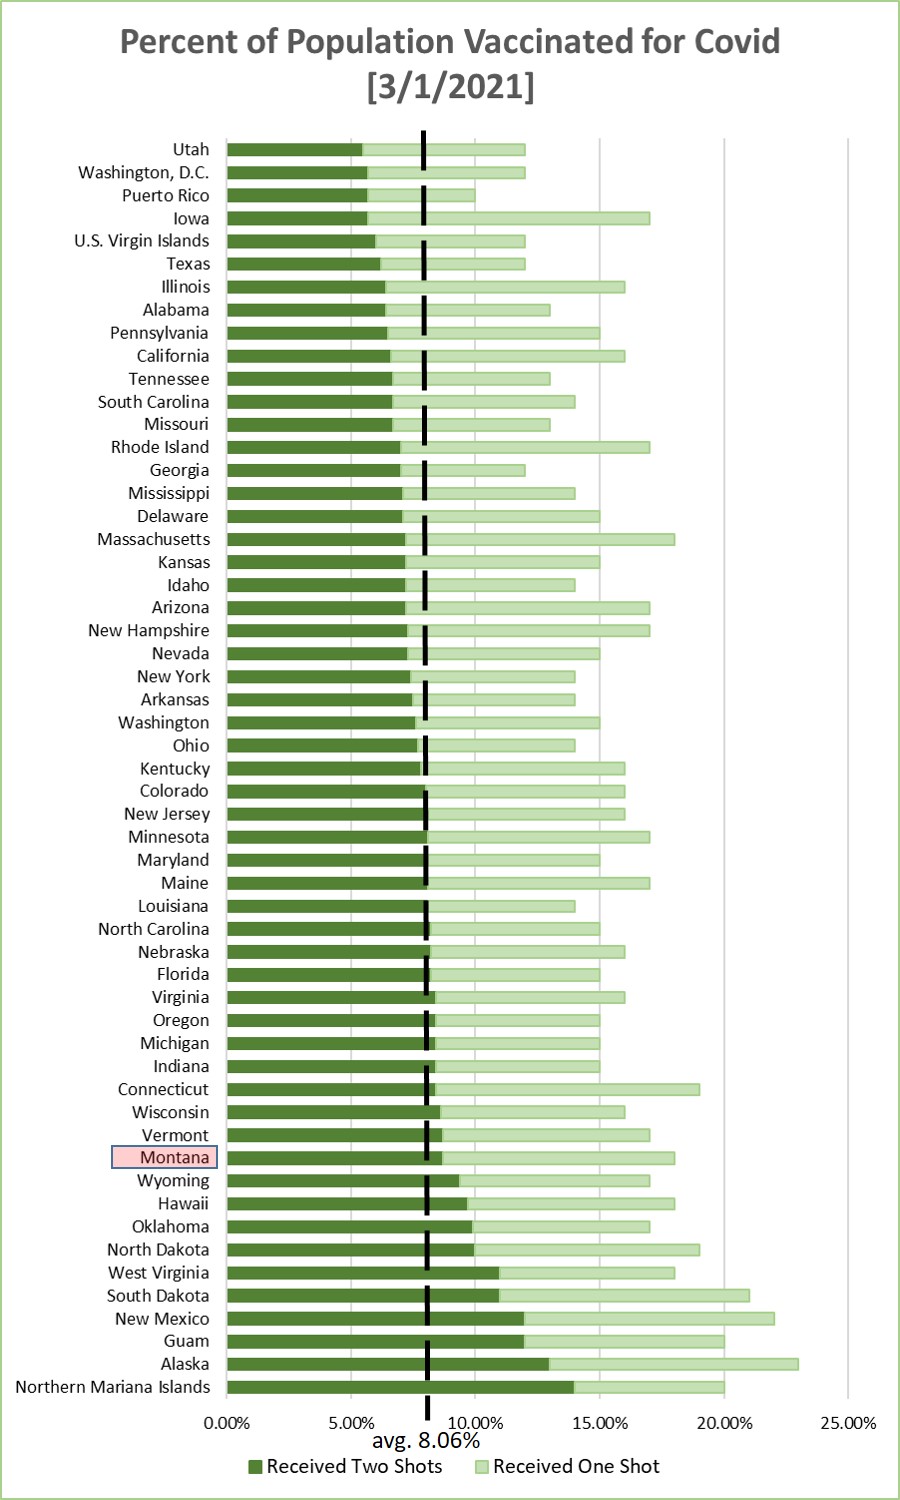
Chart 4 shows the percentage of the population in each jurisdiction having received
1 or 2 Covid-19 vaccination shots. This is sorted by the fraction that have received
2 shots. Average across the 55 jurisdictions is 8.06% having 2 shots--again a weekly
increase of about 1.7%.
Monday, February 22, 2021
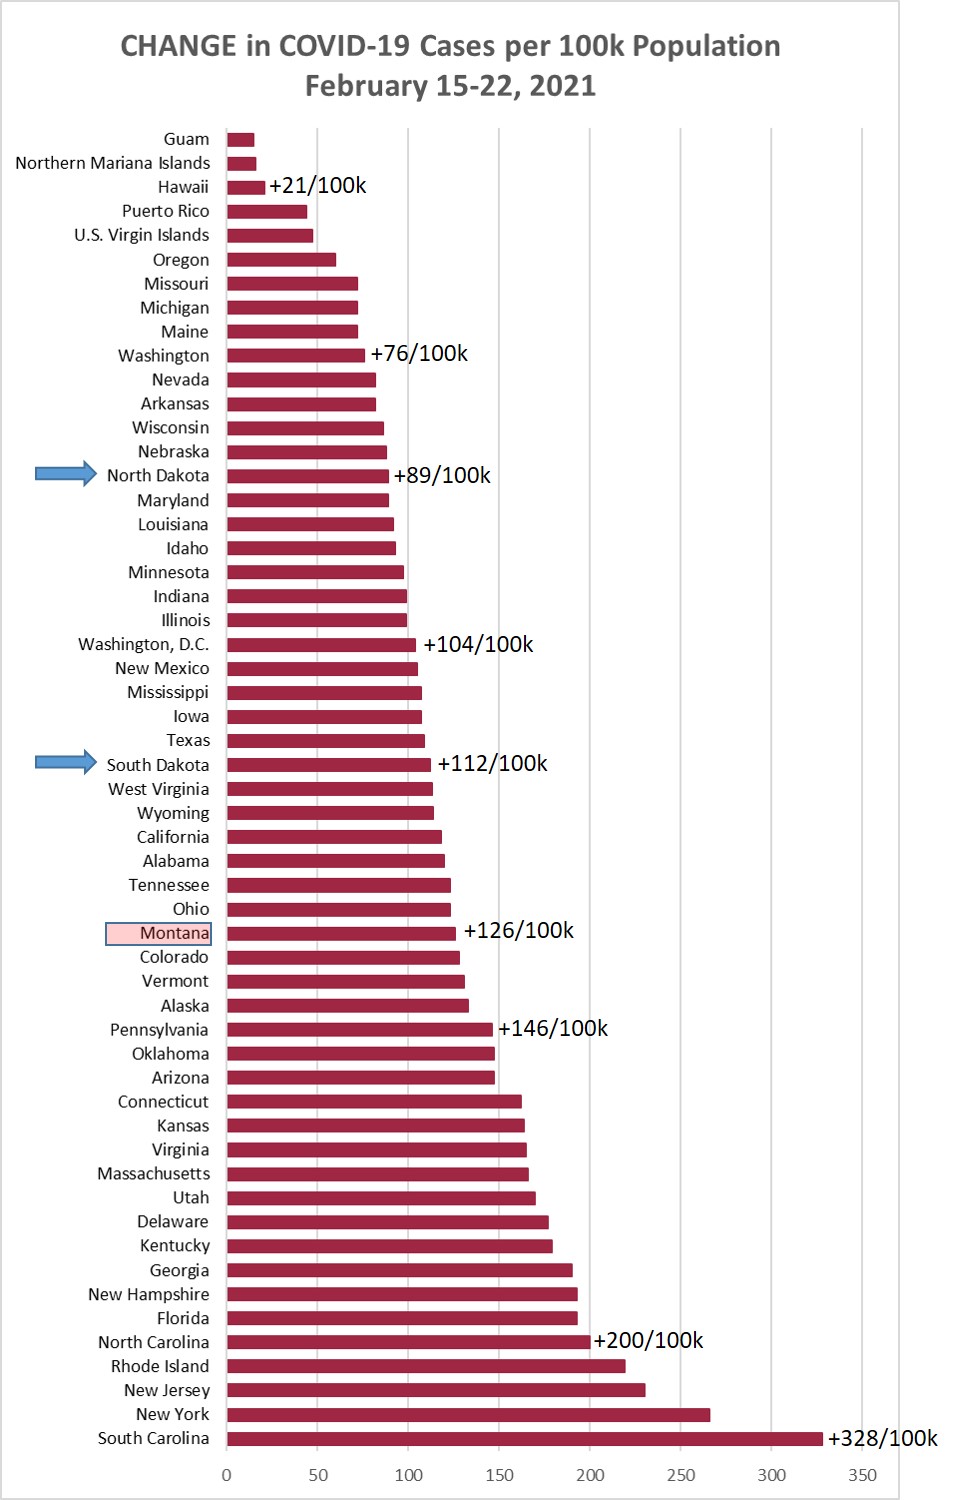
Chart 1 shows the change in cases per 100,000 population as of this morning (February
22, 2021) compared to the cases per 100,000 on February 15, 2021. Montana was up +126/100k
this week, which was fewer new cases compared to the +151, +174, and +215 the prior
three weeks. Good!
Chart 2 shows the same information as Chart 1, but with the overall cumulative cases
per 100k in each state to February 22. Montana remains in position 35/55 (21st highest).
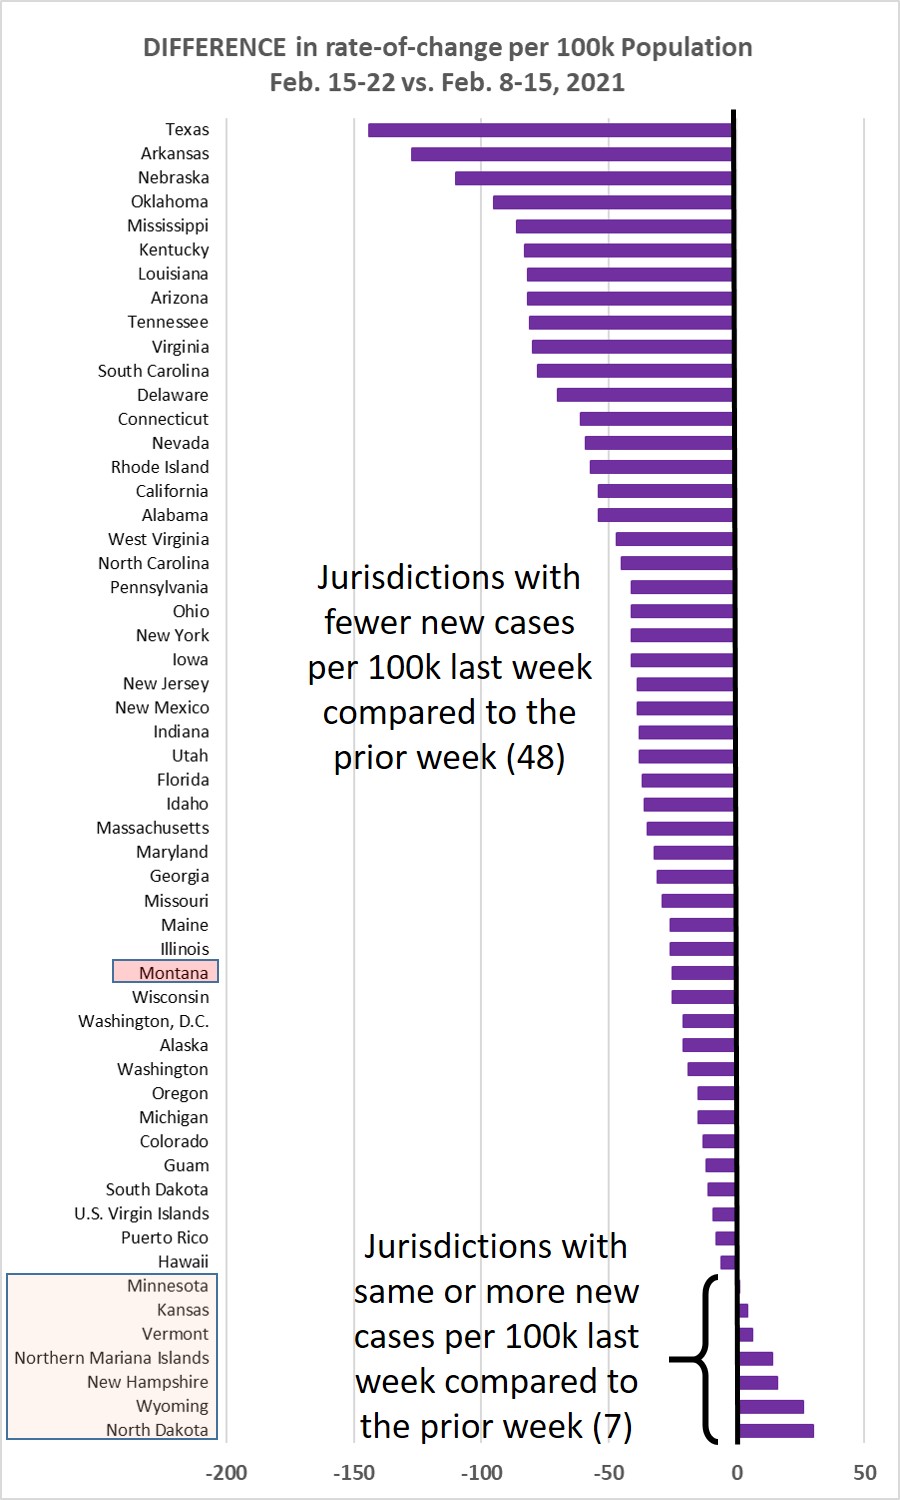
Chart 3 shows the difference in weekly new cases per 100k population for Feb. 15-22,
vs. Feb. 8-15 2021. This past week 48/55 jurisdictions (87%) showed a lower rate of
new cases.
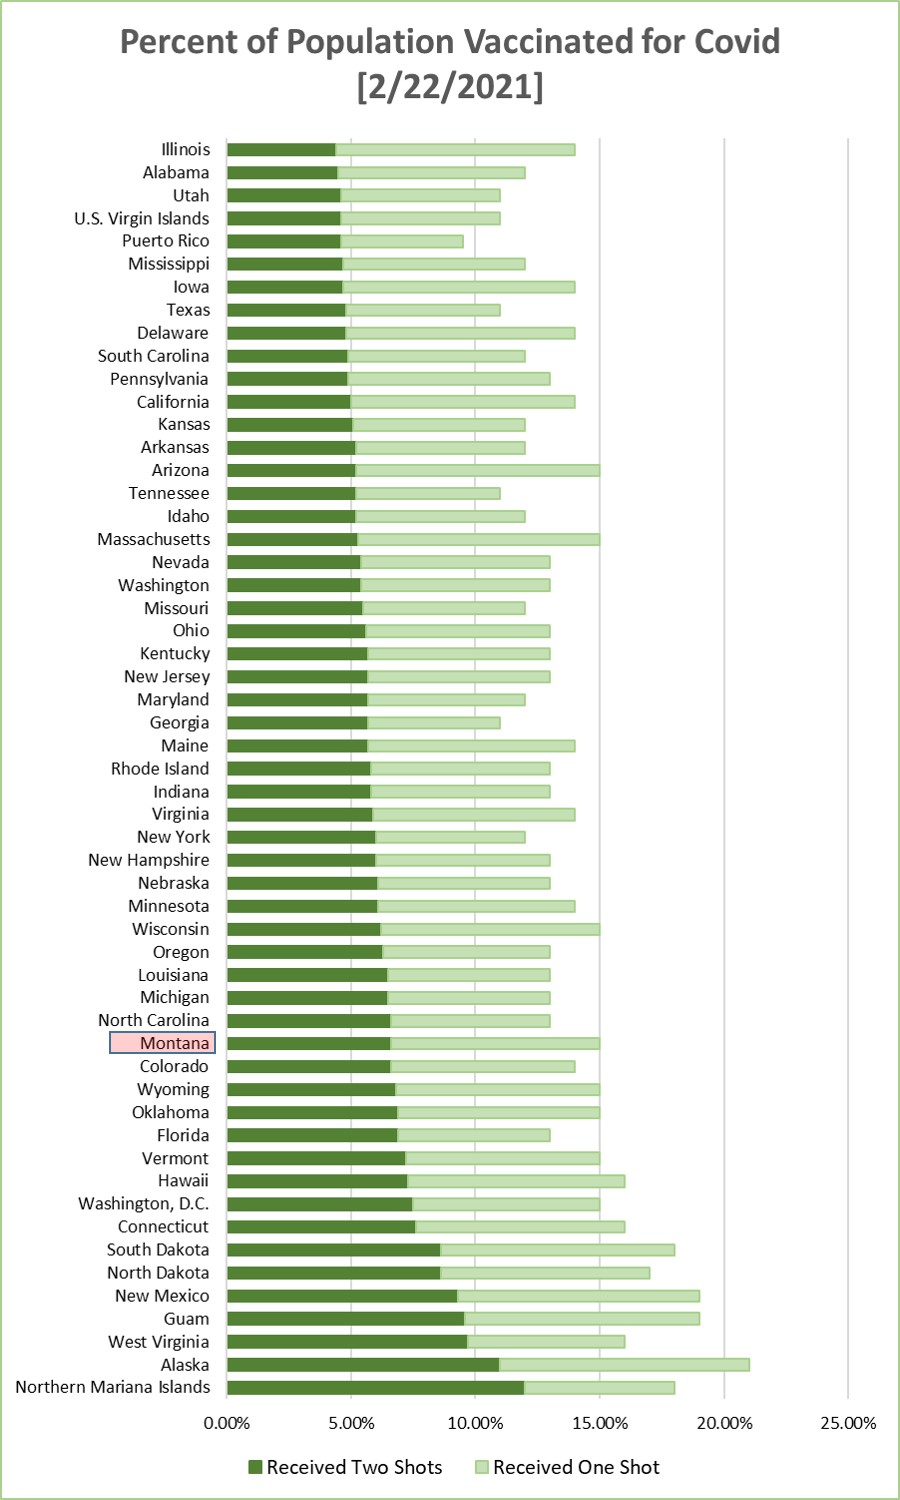
Chart 4 shows the percentage of the population in each jurisdiction having received
1 or 2 Covid-19 vaccination shots. This is sorted by the fraction that have received
2 shots. Average across the 55 jurisdictions is 6.26% having 2 shots--a weekly increase
of about 1.7%.

Monday, February 15, 2021
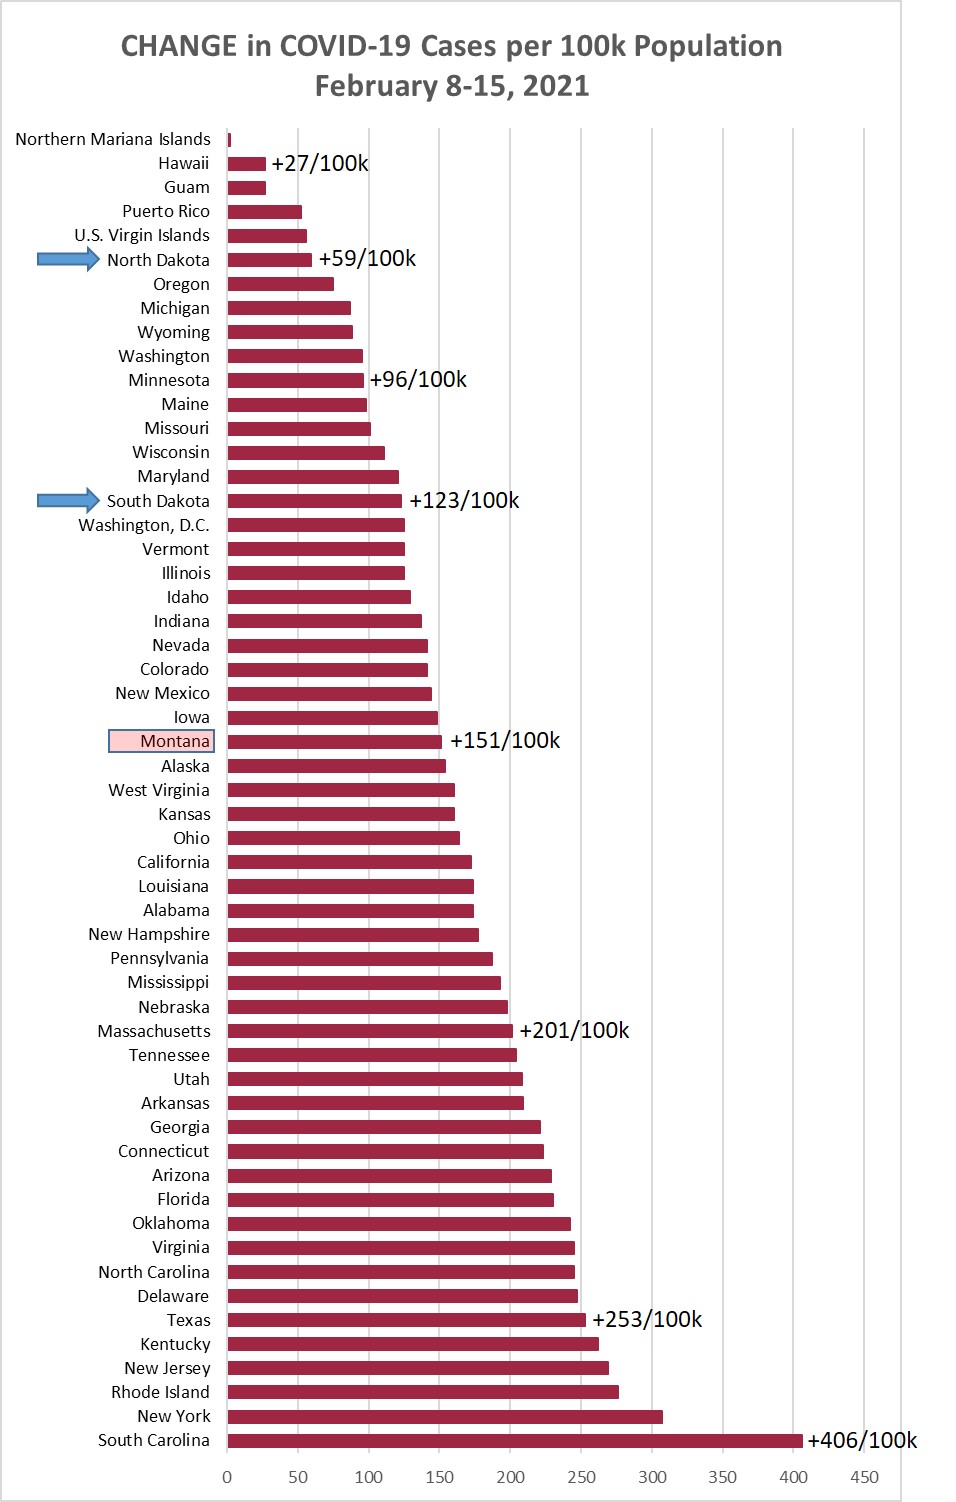
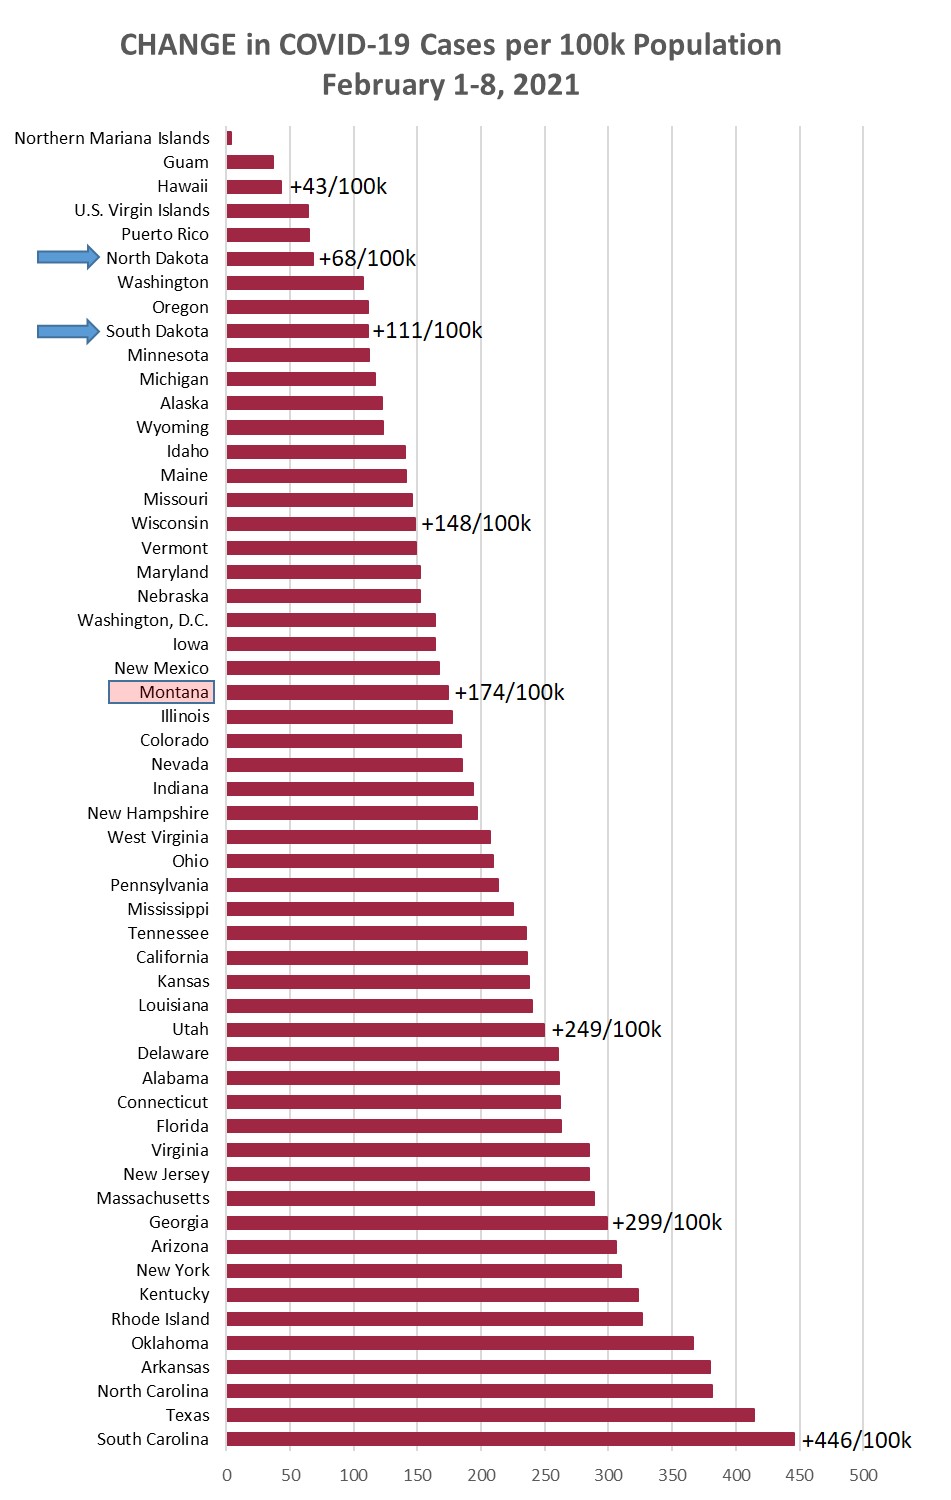
Chart 1 shows the change in cases per 100,000 population as of this morning (February
15, 2021) compared to the cases per 100,000 on February 8, 2021. Montana was up +151/100k
this week, which was down from the +174, +215, and +212 the prior three weeks.
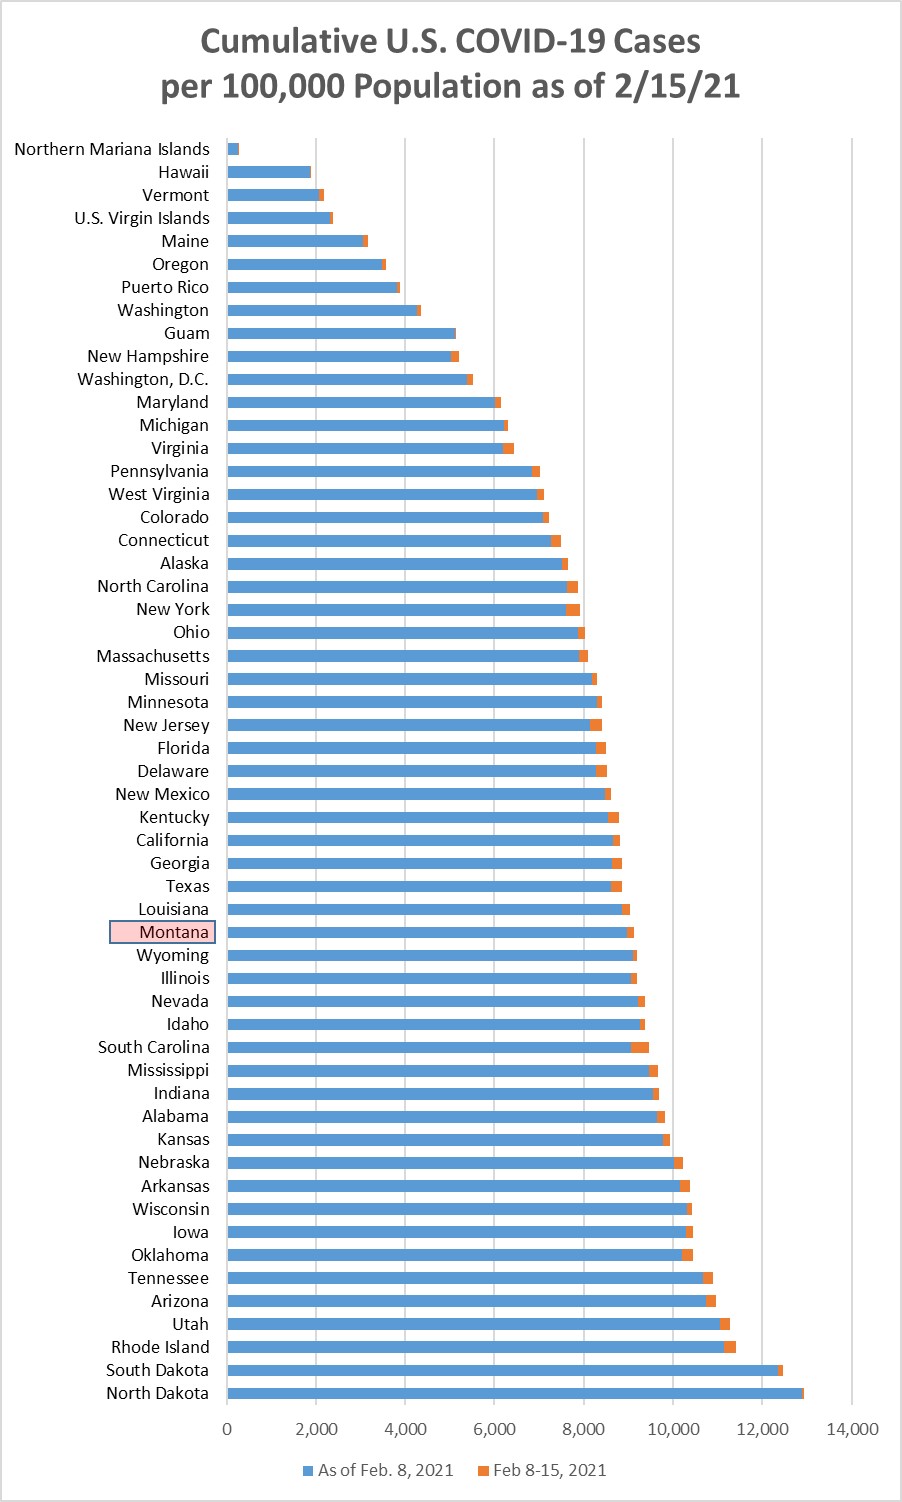
Chart 2 shows the same information as Chart 1, but with the overall cumulative cases
per 100k in each state to February 15. Montana remains in position 35/55 (21st highest).
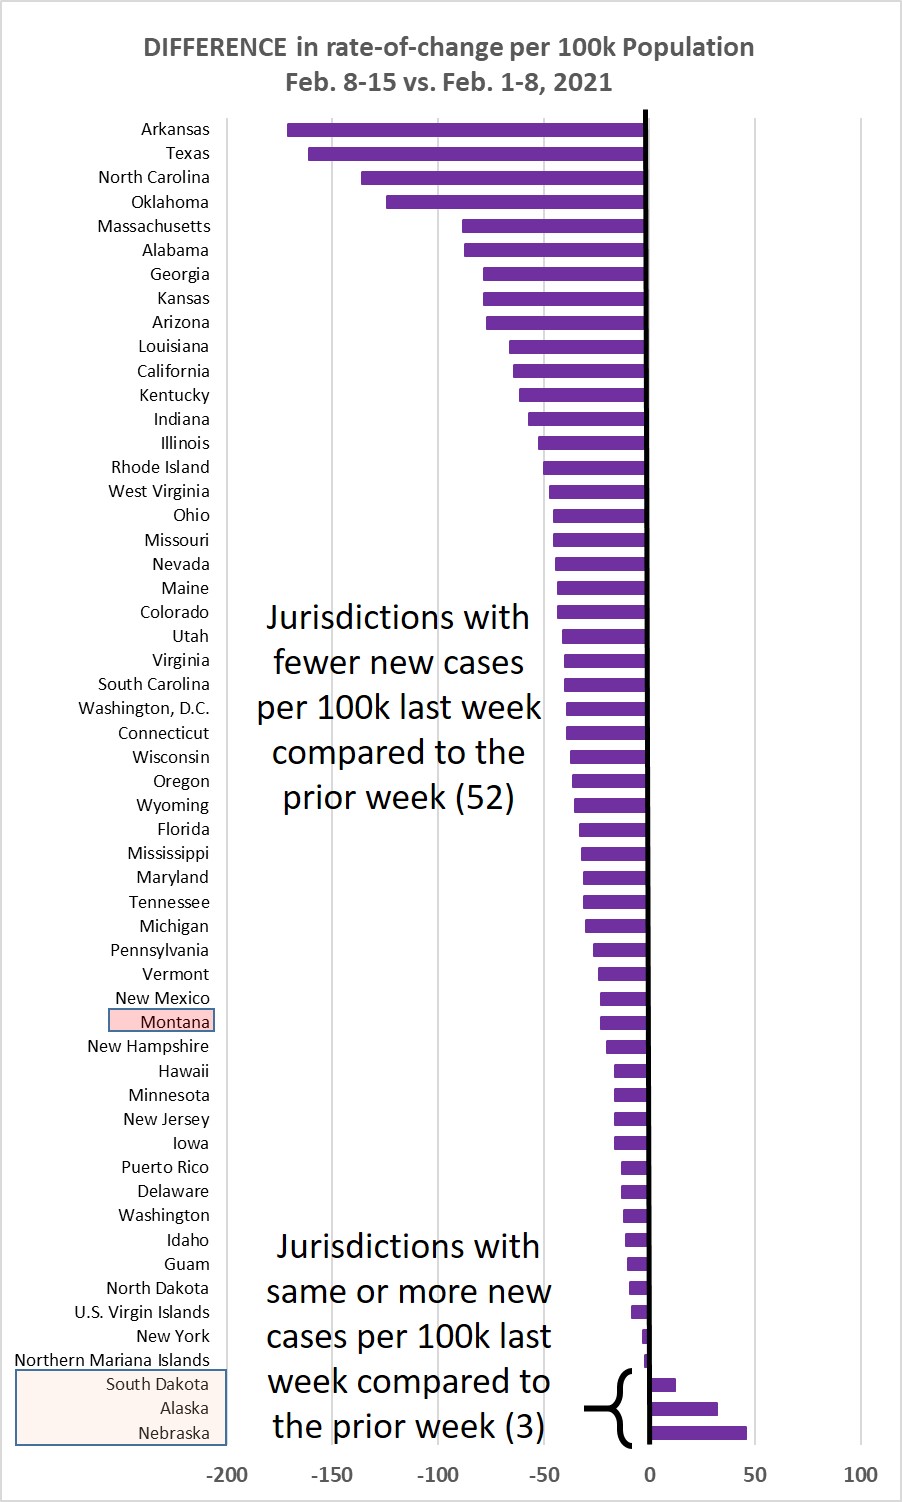
Chart 3 shows the difference in weekly new cases per 100k population for Feb. 8-15,
vs. Feb. 1-8, 2021. This past week 52/55 jurisdictions (95%) showed a lower rate of
new cases.
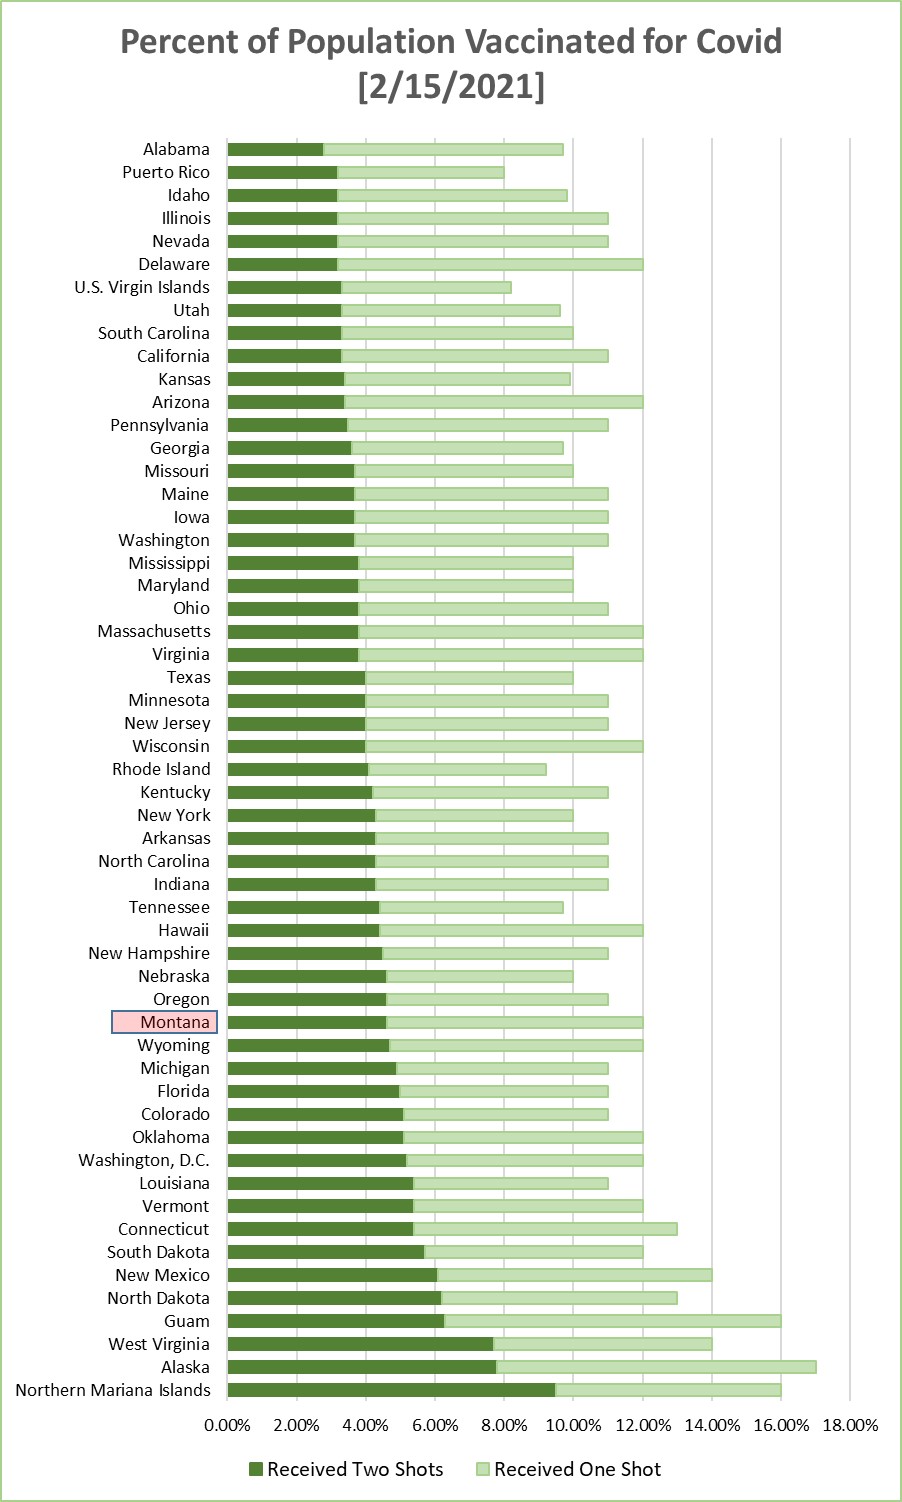
Chart 4 shows the percentage of the population in each jurisdiction having received
1 or 2 Covid-19 vaccination shots. This is sorted by the fraction that have received
2 shots. Average across the 55 jurisdictions is 4.43% having 2 shots.
Monday, February 8, 2021
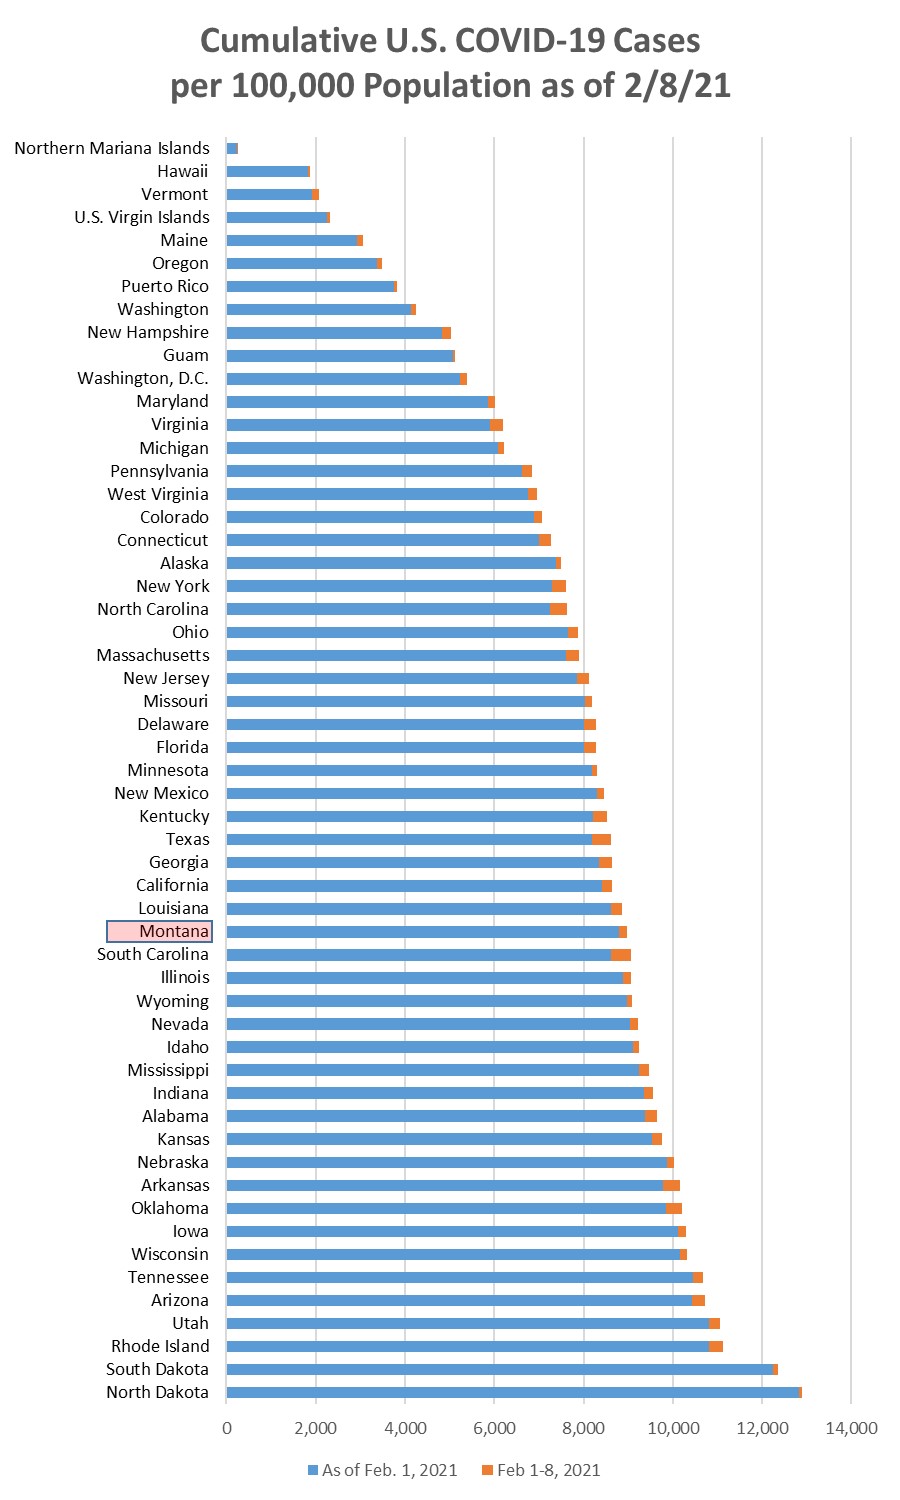
Chart 1 shows the change in cases per 100,000 population as of this morning (February
8, 2021) compared to the cases per 100,000 on February 1, 2021. Montana was up +174/100k
this week, which was down from the +215 and +212 the prior two weeks.
Chart 2 shows the same information as Chart 1, but with the overall cumulative cases
per 100k in each state to February 8. Montana is in position 35/55 (21st highest).
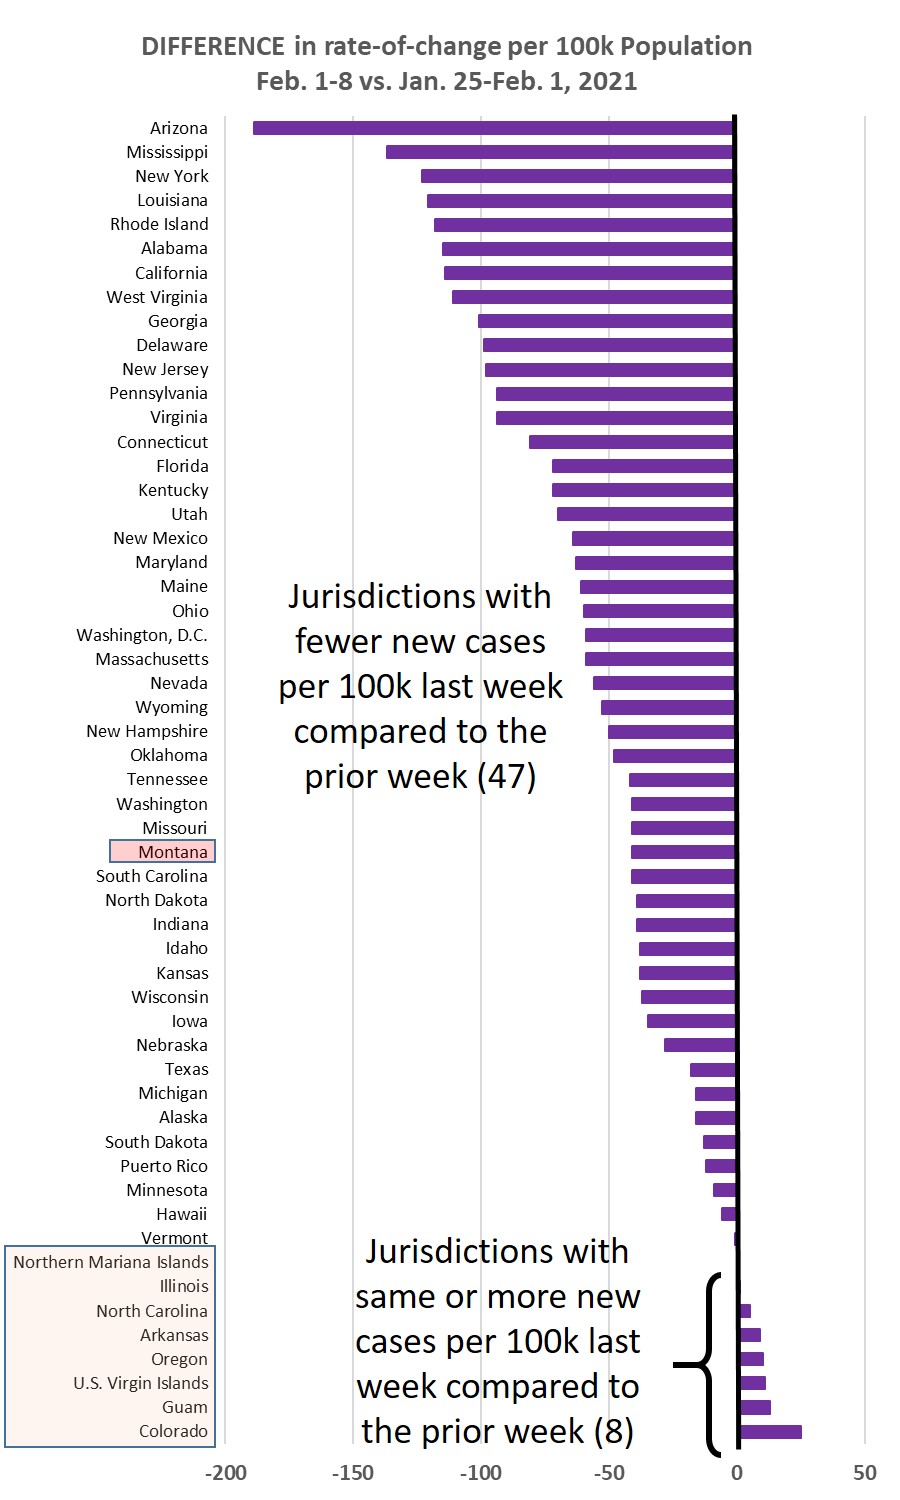
Chart 3 shows the difference in weekly new cases per 100k population for Feb. 1-8,
vs. Jan. 25-Feb. 1, 2021. This past week 47/55 jurisdictions (85%) showed a lower
rate of new cases.
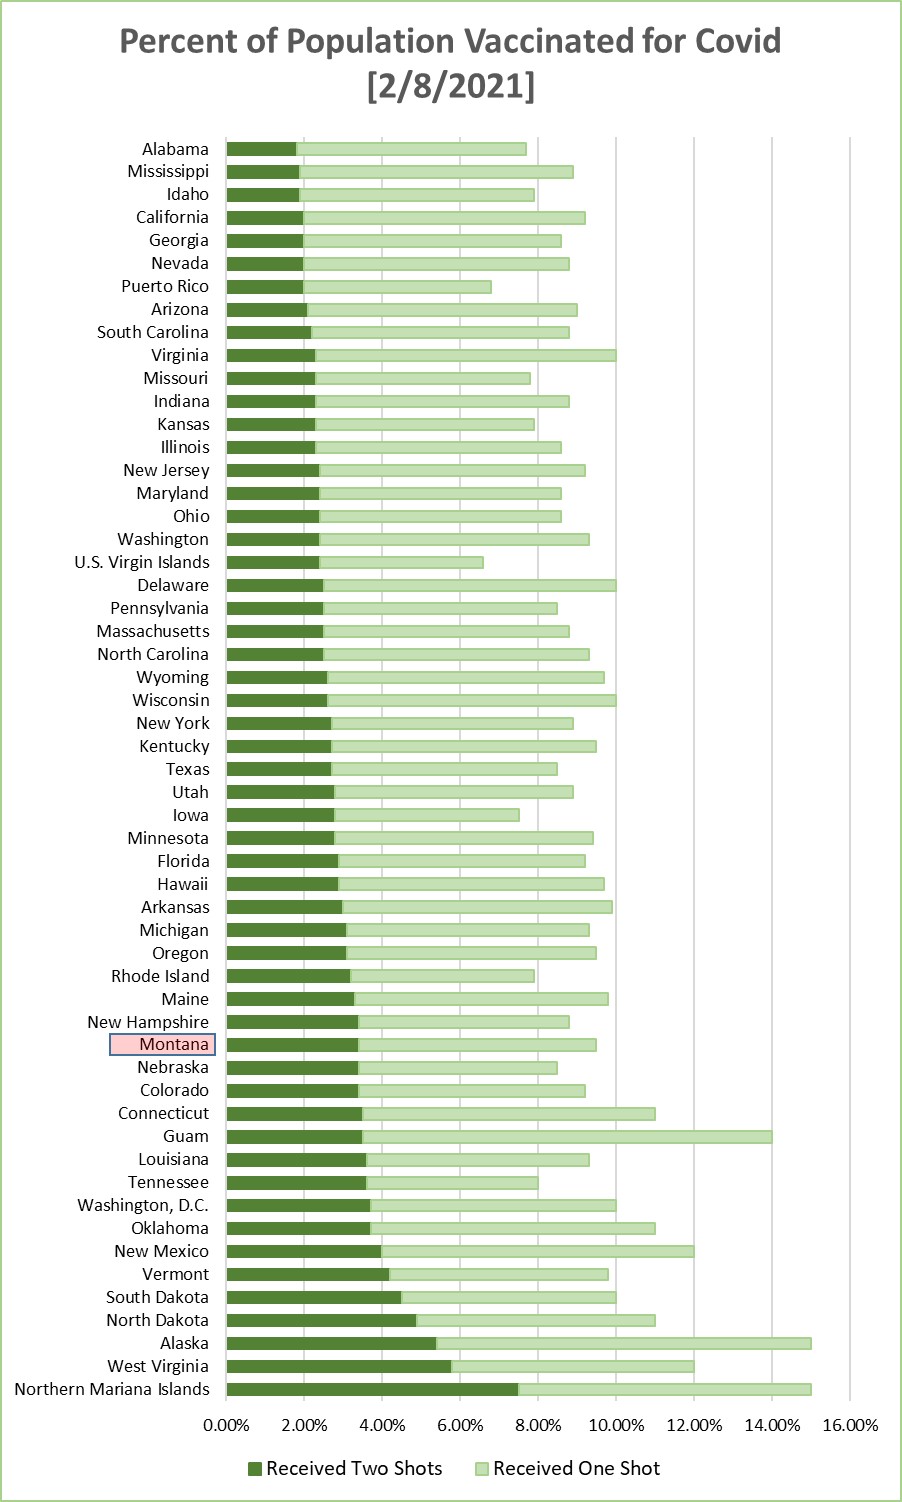
Chart 4 shows the percentage of the population in each jurisdiction having received
1 or 2 Covid-19 vaccination shots. This is sorted by the fraction that have received
2 shots.
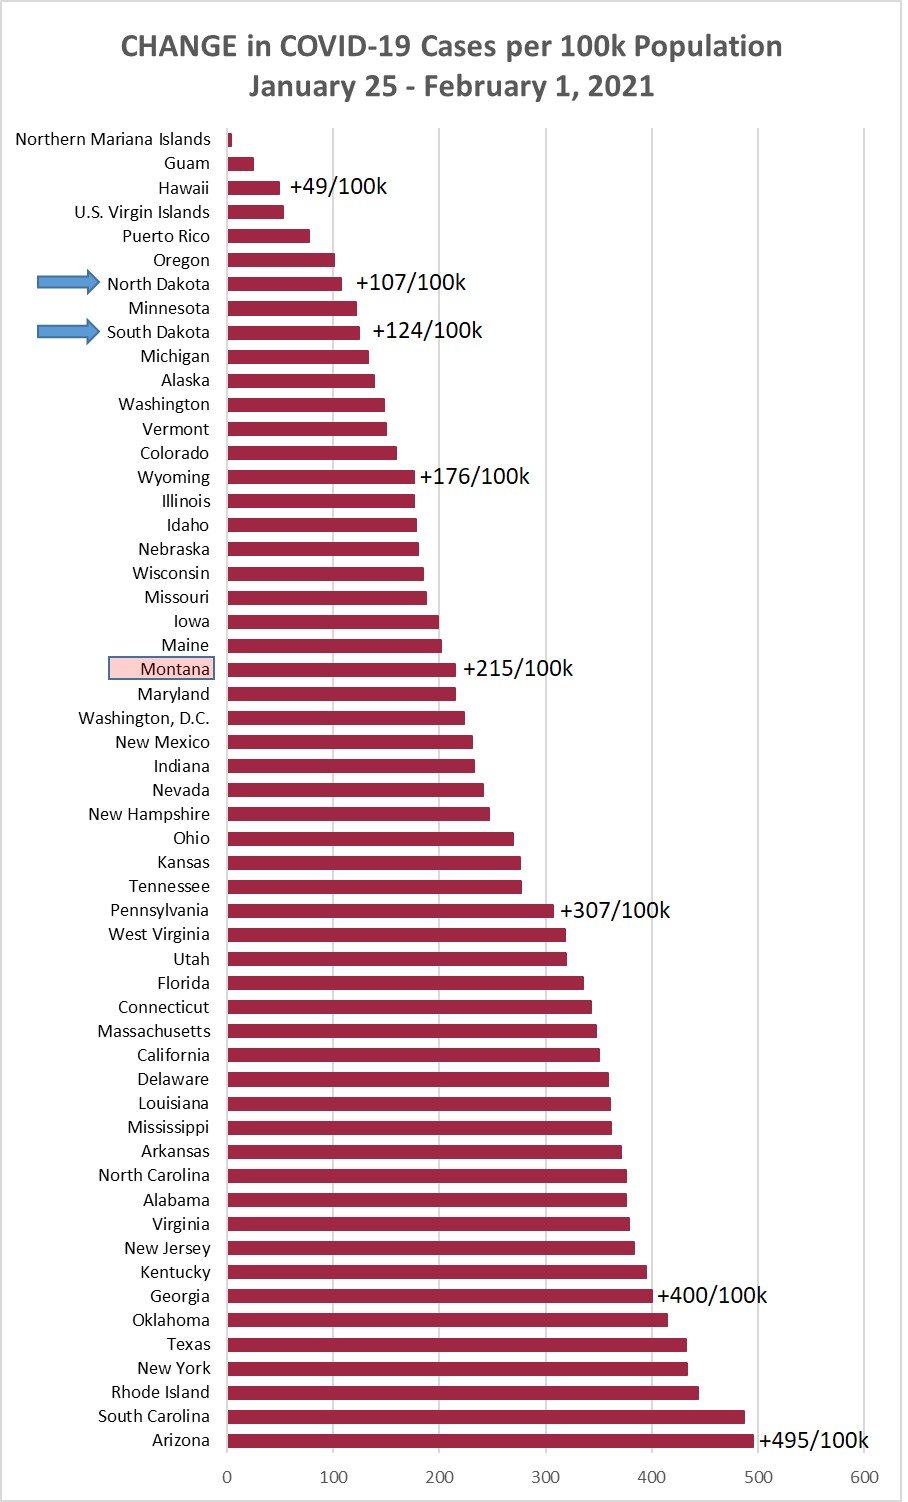
Monday, February 1, 2021
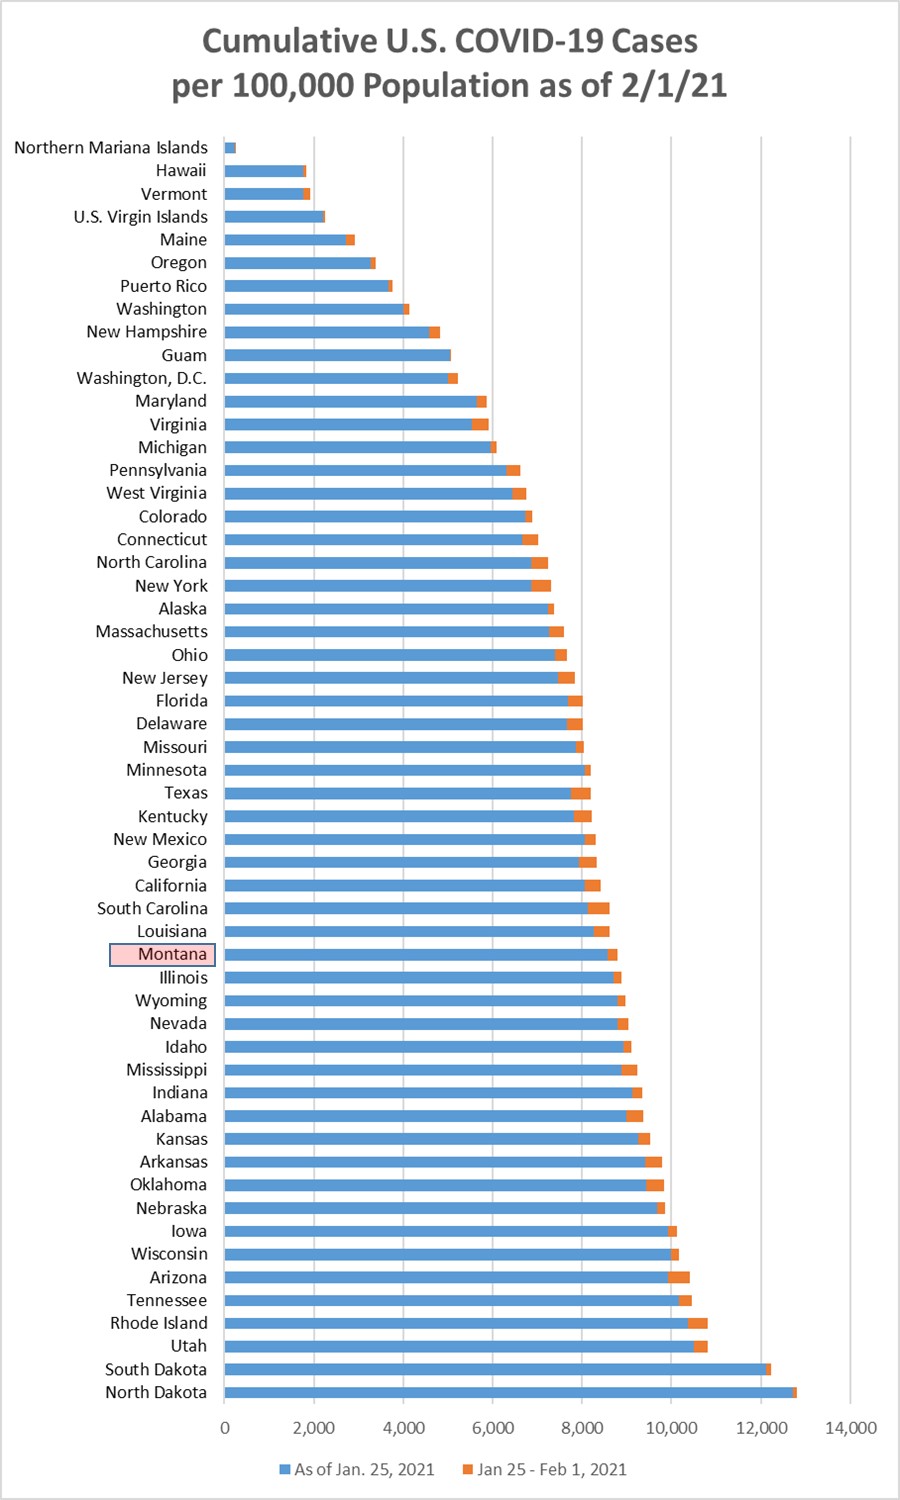
Chart 1 shows the change in cases per 100,000 population as of this morning (February
1, 2021) compared to the cases per 100,000 on January 25, 2021. Montana was up +215/100k
this week, about the same as the +212/100k the prior week.
Chart 2 shows the same information as Chart 1, but with the overall cumulative cases
per 100k in each state to February 1. Montana remains in position 36/55 (20th highest).
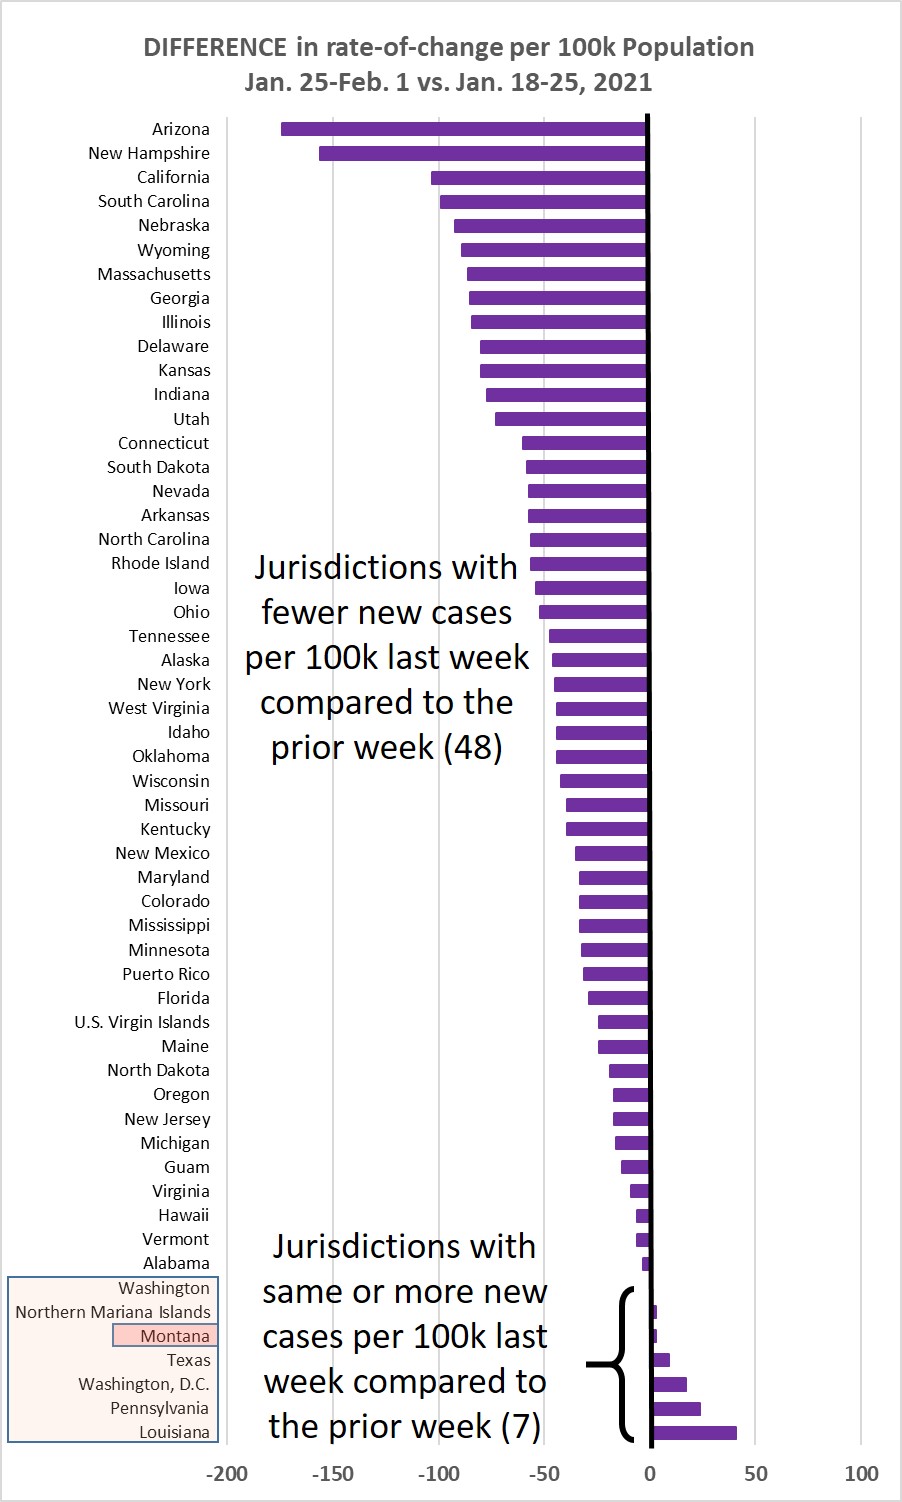
Chart 3 shows the difference in weekly new cases per 100k population for Jan. 25-Feb.
1, vs. Jan. 18-25, 2021. This past week 48/55 jurisdictions (87%) showed a lower rate
of new cases.
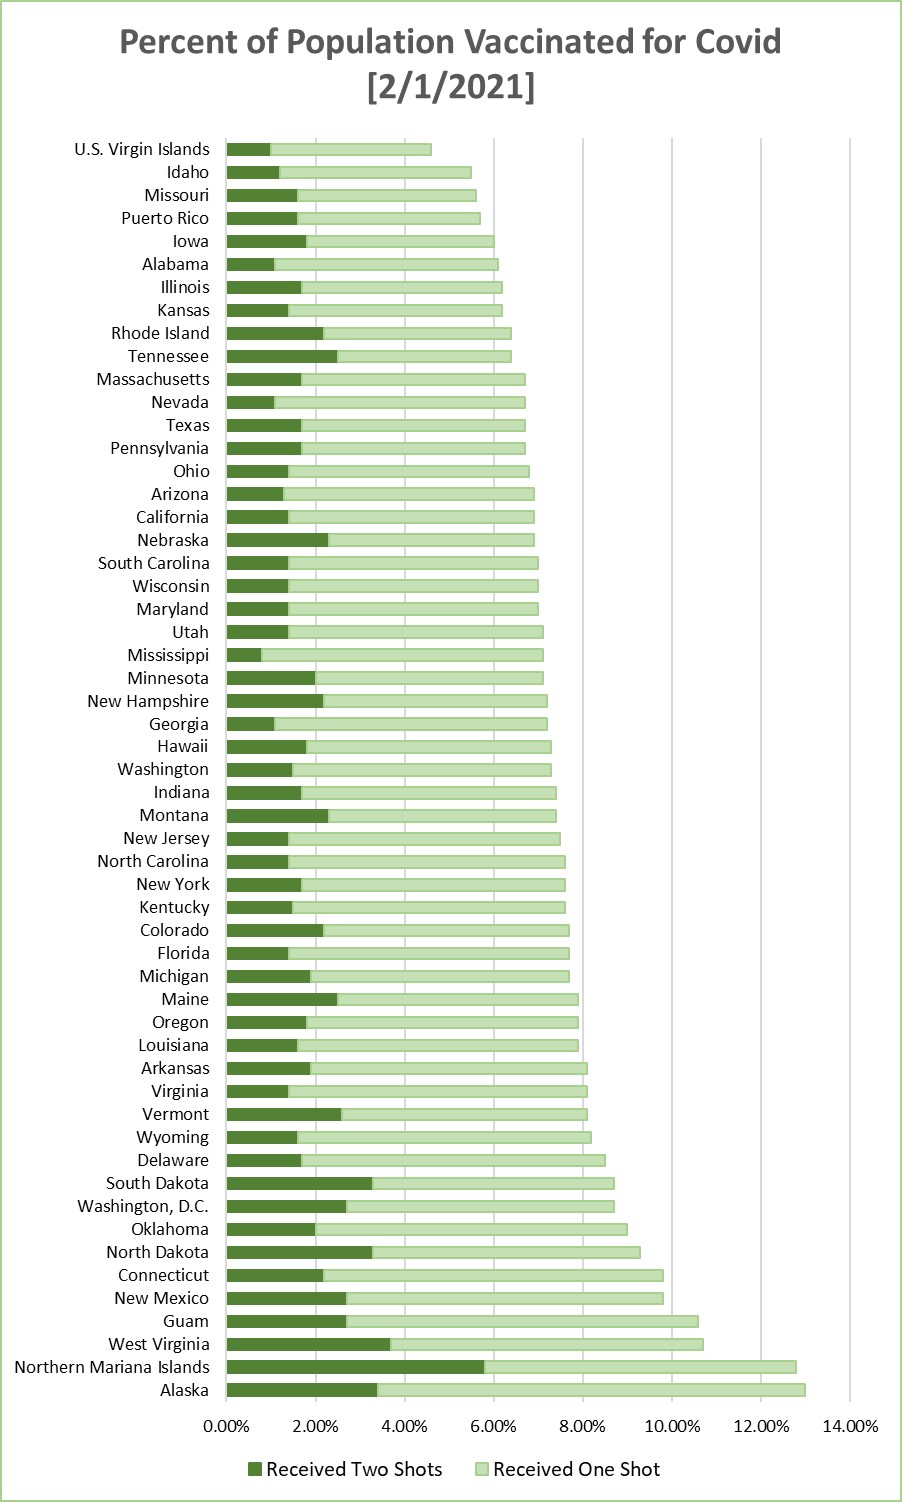
This week I have added a Chart 4, which shows the percentage of the population in
each jurisdiction having received 1 or 2 Covid-19 vaccination shots.
Monday, January 25, 2021
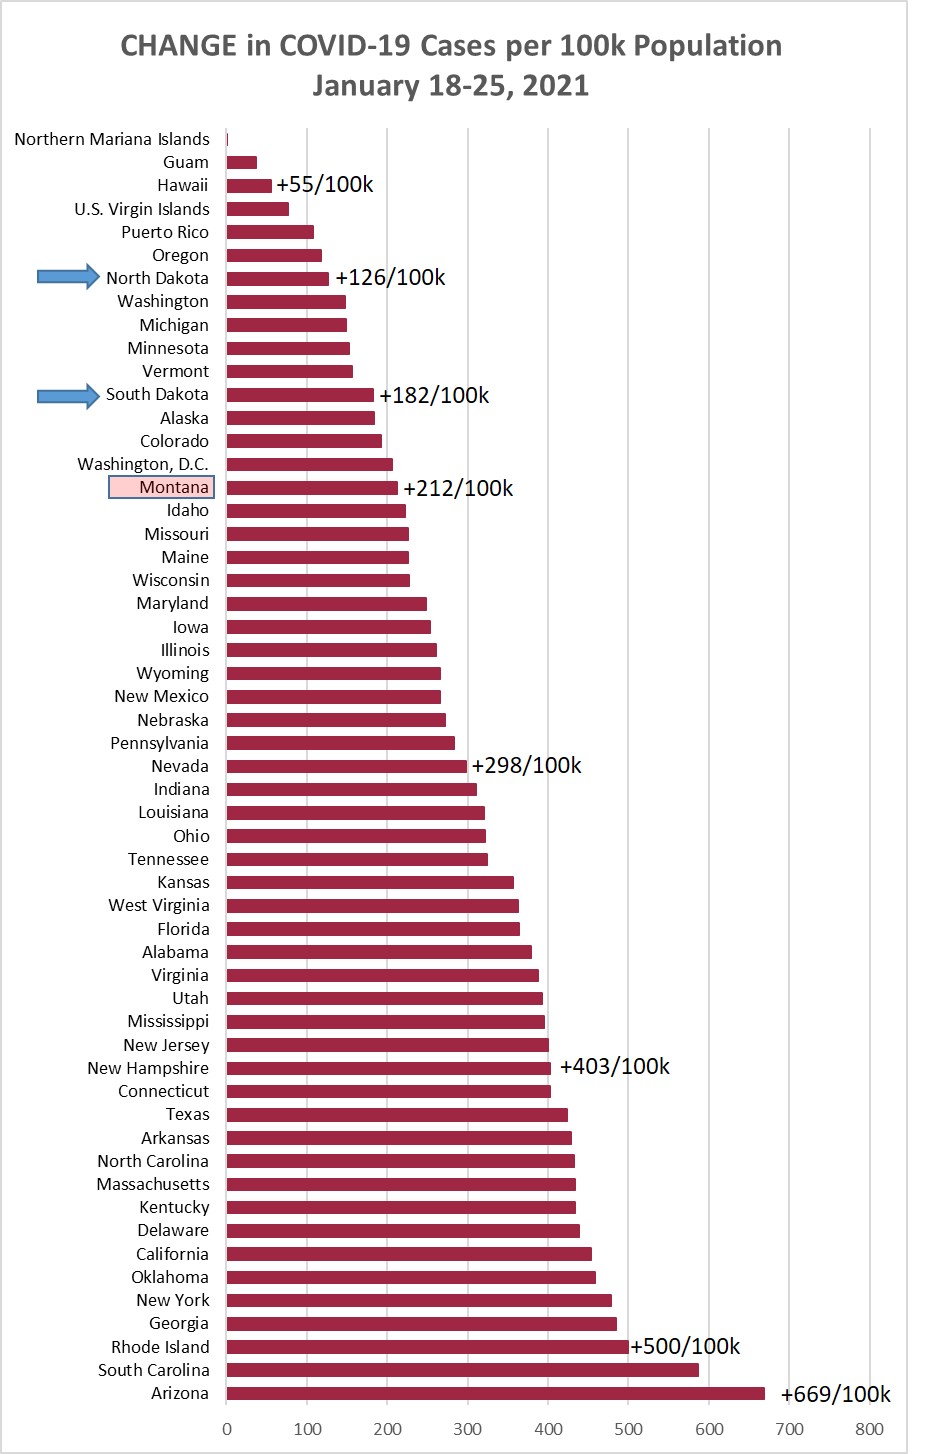
Chart 1 shows the change in cases per 100,000 population as of this morning (January
25, 2021) compared to the cases per 100,000 on January 18, 2021. Montana was up +212/100k
this week, which was lower than the +287/100k the prior week, and the third week in
a row with a slowing growth of cases.
Chart 2 shows the same information as Chart 1, but with the overall cumulative cases
per 100k in each state to January 25. Montana remains in position 36/55 (20th highest).
Chart 3 shows the difference in weekly new cases per 100k population for Jan. 18-25,
2021, vs. Jan. 11-18, 2021. This past week all but one jurisdiction (New Hampshire)
showed a lower rate of new cases!
Monday, January 18, 2021
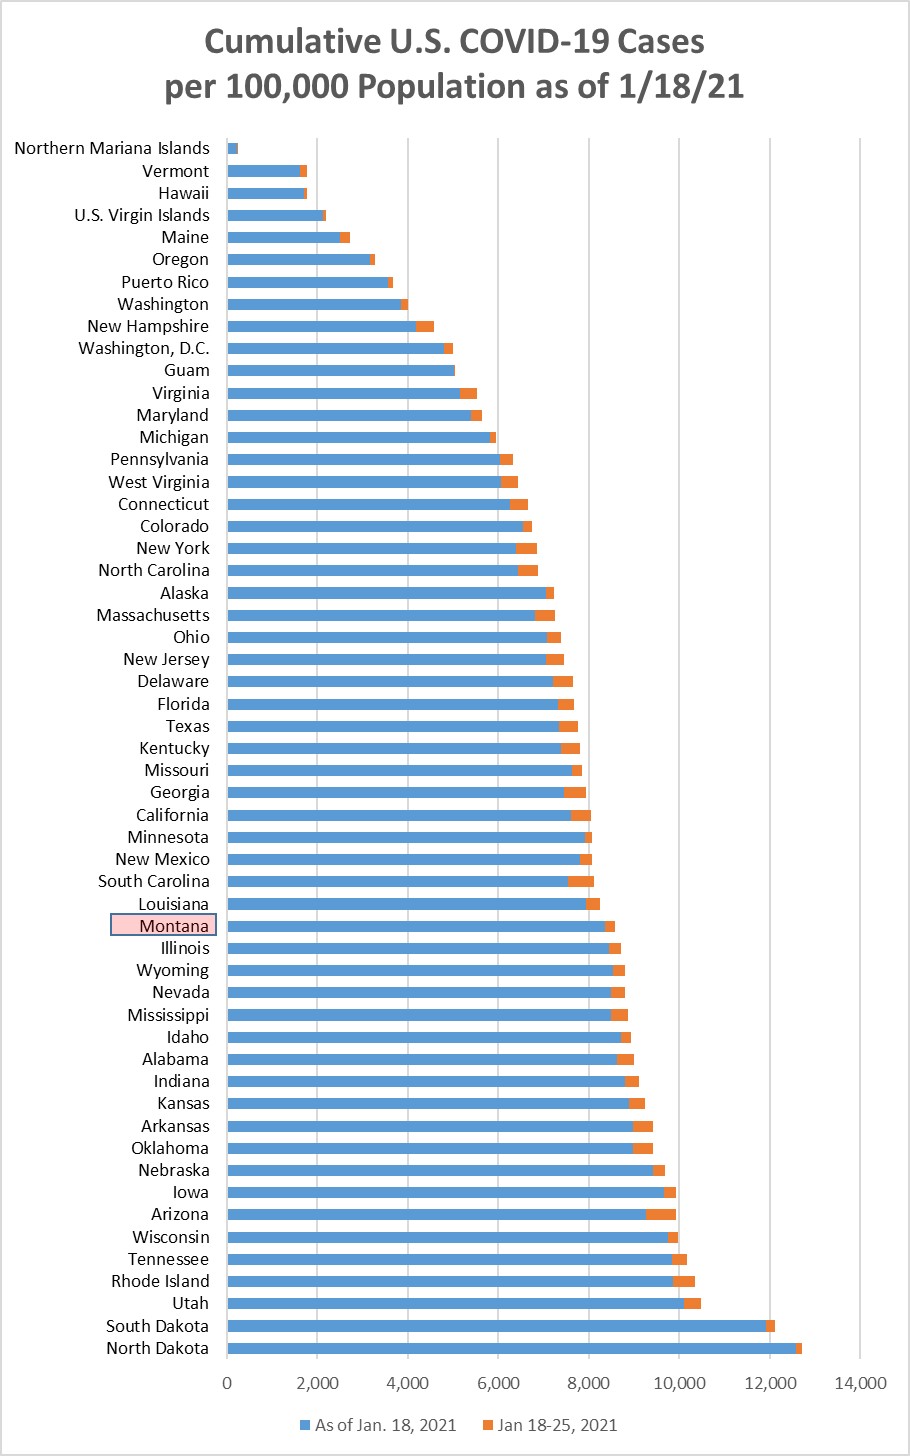
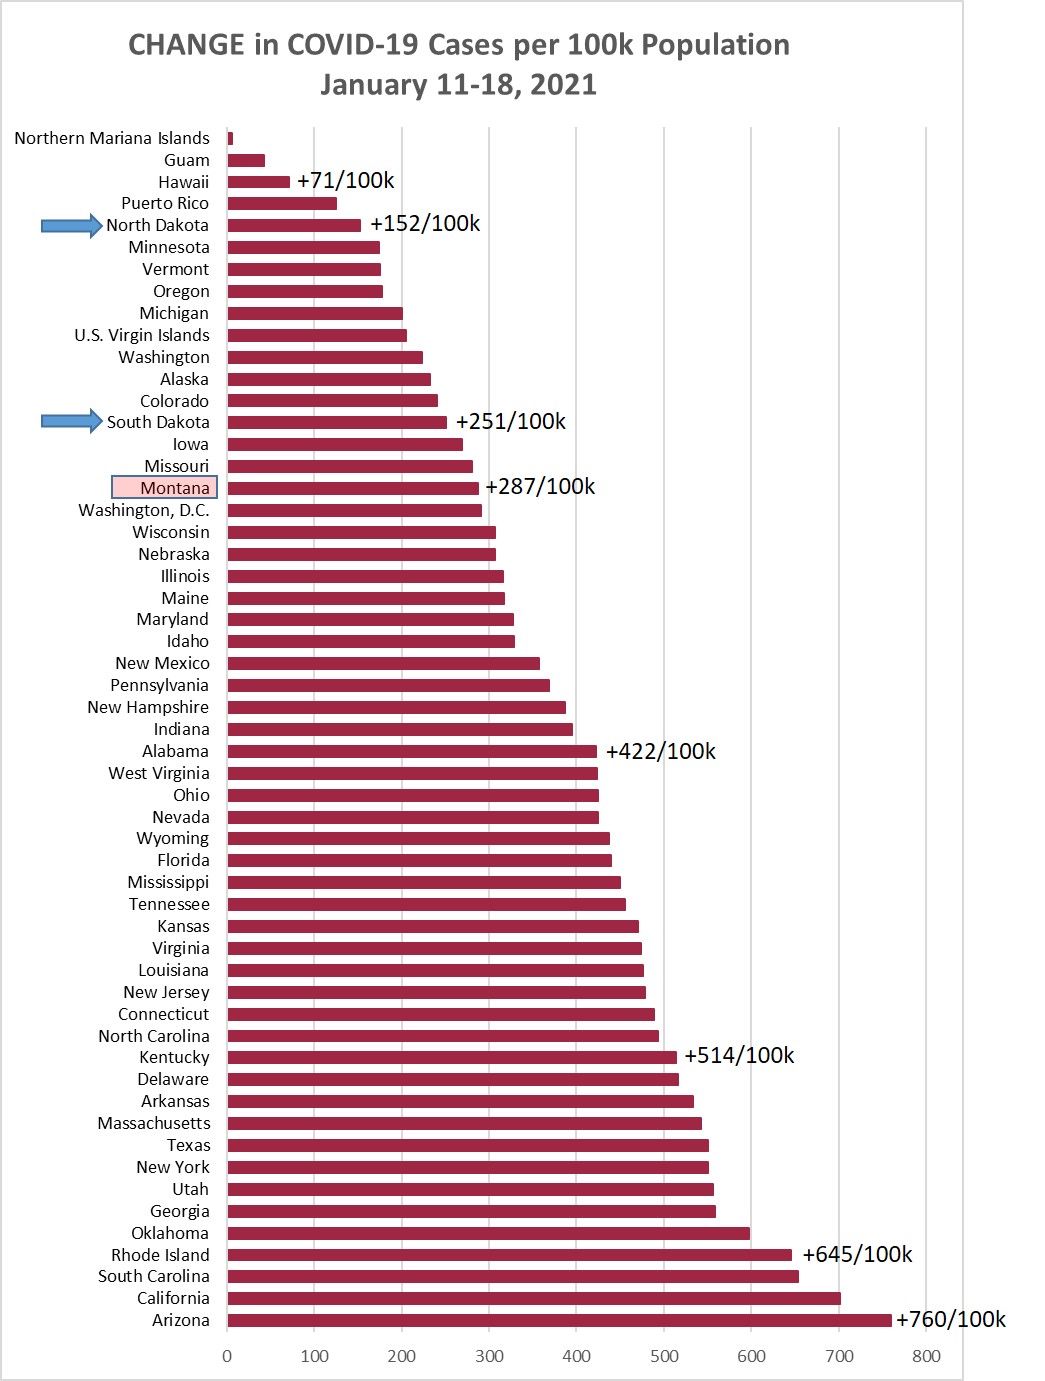
Chart 1 shows the change in cases per 100,000 population as of this morning (January
18, 2021) compared to the cases per 100,000 on January 11, 2021. Montana was up +287/100k
this week, which was lower than the +369/100k the prior week.
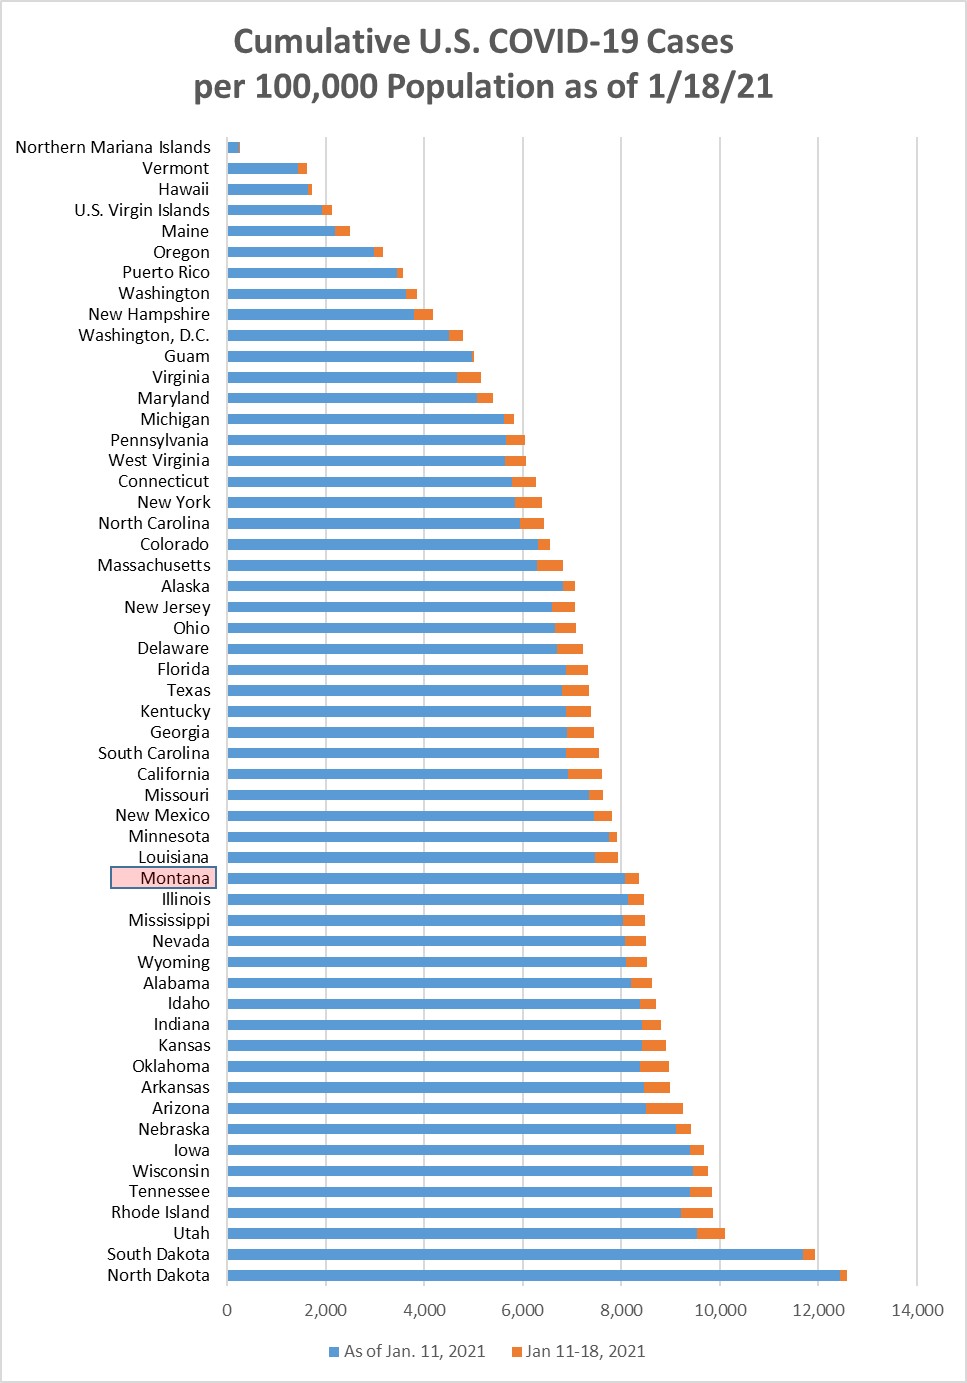
Chart 2 shows the same information as Chart 1, but with the overall cumulative cases
per 100k in each state to January 18. Montana is now down to position 36/55 (20th
highest).
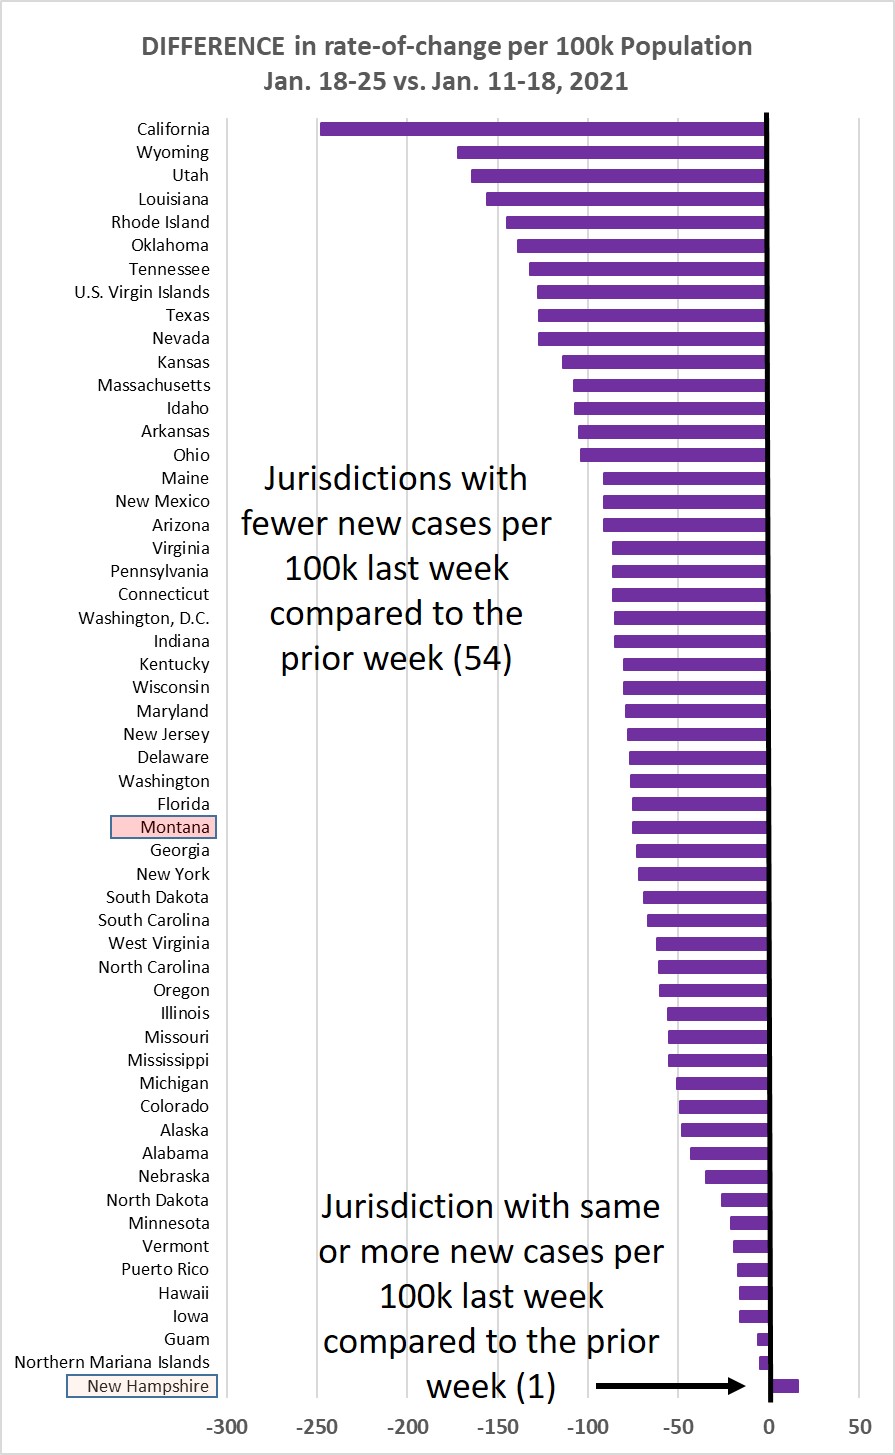
Chart 3 shows the difference in weekly new cases per 100k population for Jan. 11-18,
2021, vs. Jan. 4-11, 2021. This past week, 82% of the jurisdictions showed a lower
rate of new cases.
Monday, January 11, 2021
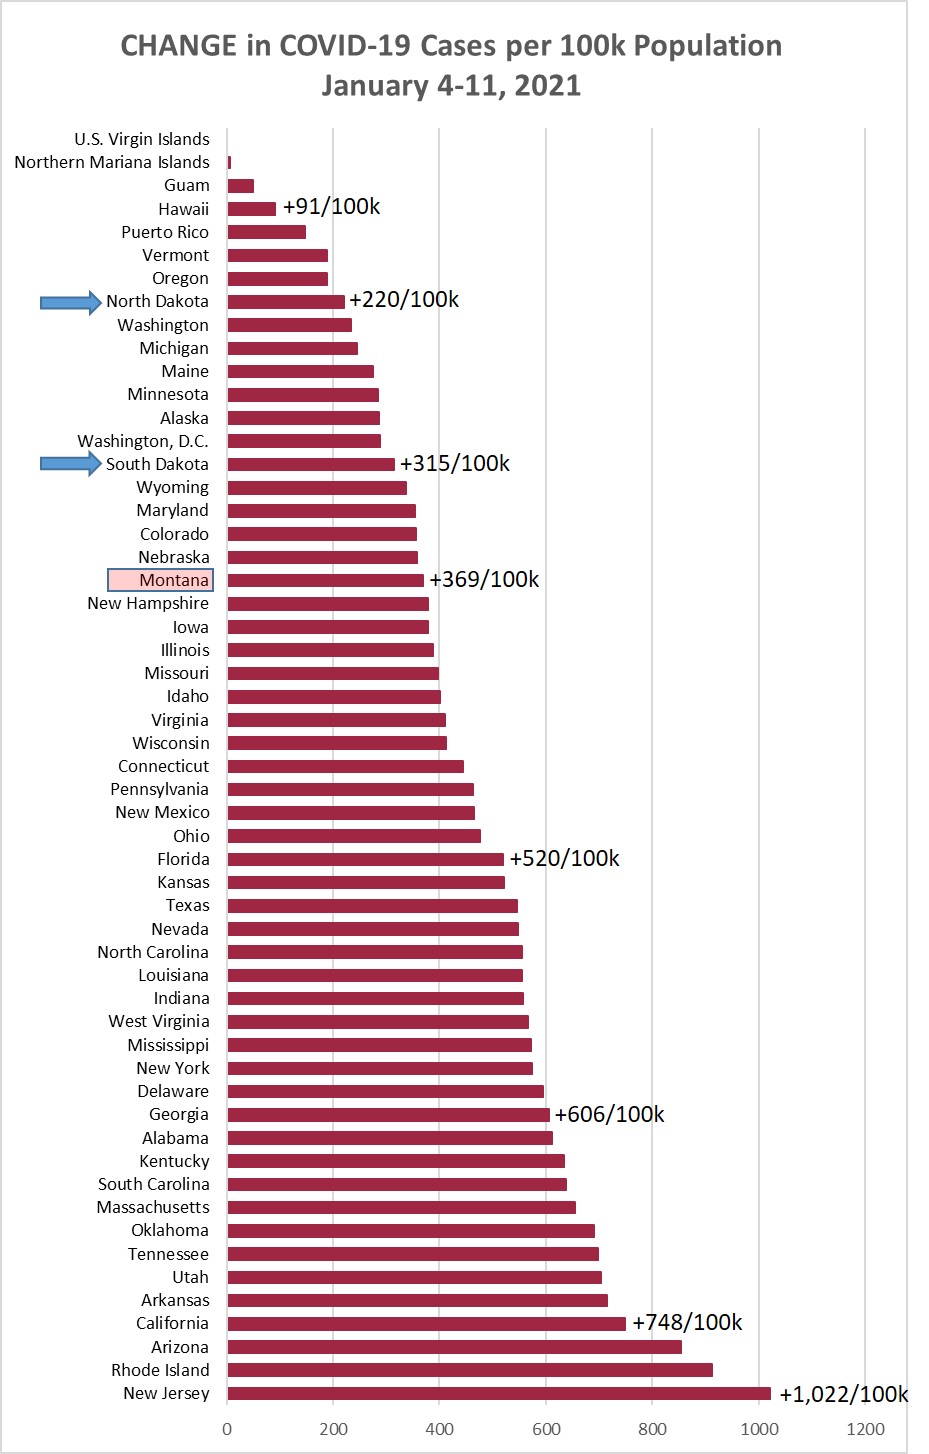
Chart 1 shows the change in cases per 100,000 population as of this morning (January
11, 2021) compared to the cases per 100,000 on January 4, 2021. Montana was up +369
/100k this week, which was higher than the +243/100k the prior week. New Jersey was
the jurisdiction with the largest weekly increase, a record increase for that state
of +1,022/100k (more than 1% of New Jersey's population had positive Covid test this
week).
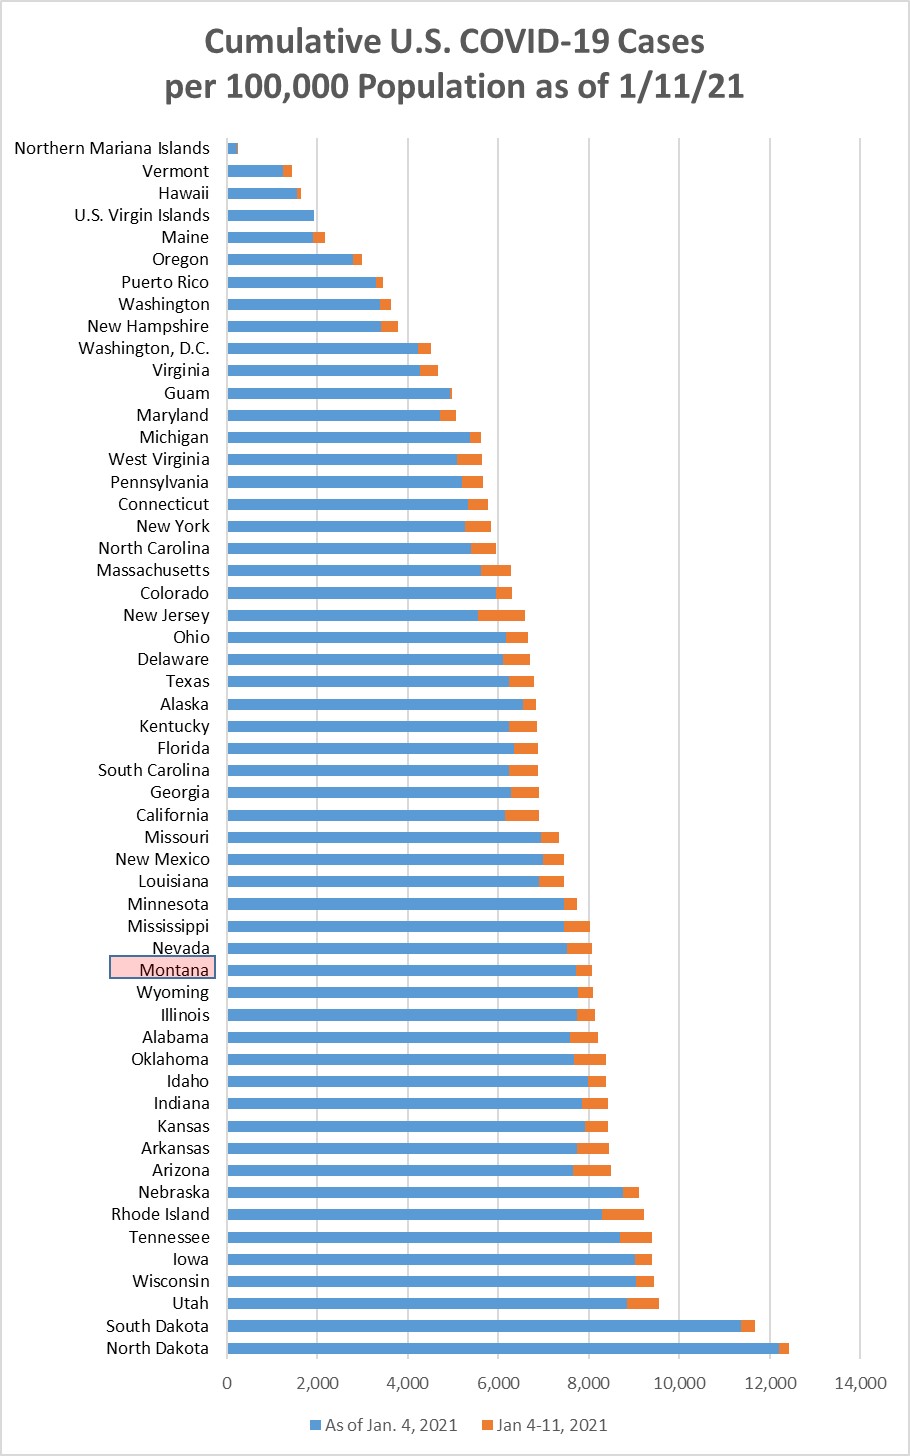
Chart 2 shows the same information as Chart 1, but with the overall cumulative cases
per 100k in each state to January 11. Montana is now down to position 38 (18th highest).
This week Montana passed 8% of our population having had a positive COVID test at
some point.
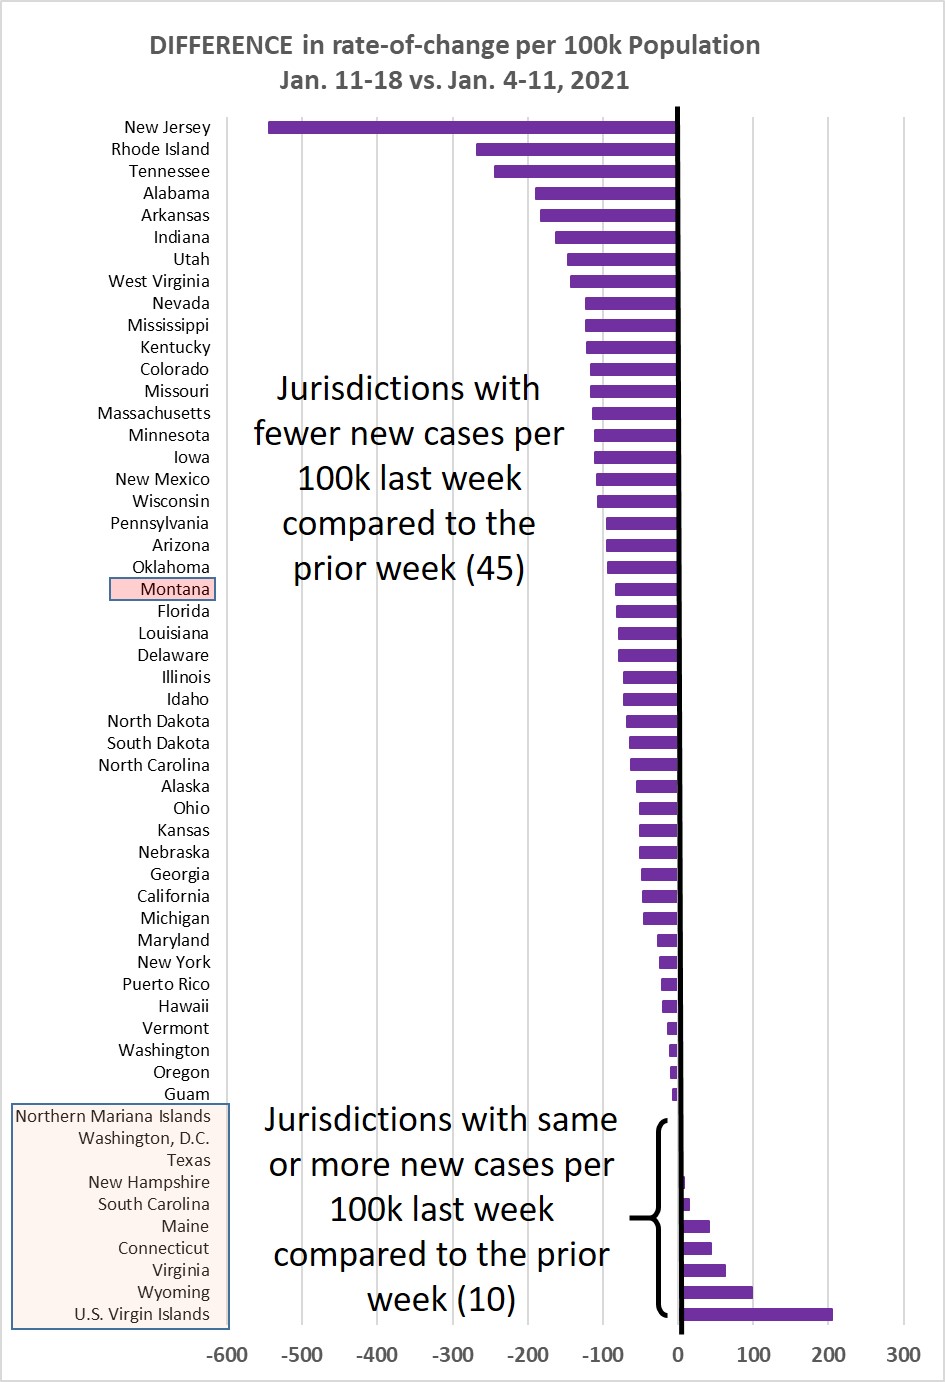
Chart 3 shows the difference in weekly new cases per 100k population for Jan. 4-11,
2021, vs. Dec. 28, 2020-Jan. 4, 2021. This past week, 84% of the jurisdictions showed
an increasing rate of cases.
Monday, January 4, 2021
Monday, January 4, 2021. First Monday of 2021.
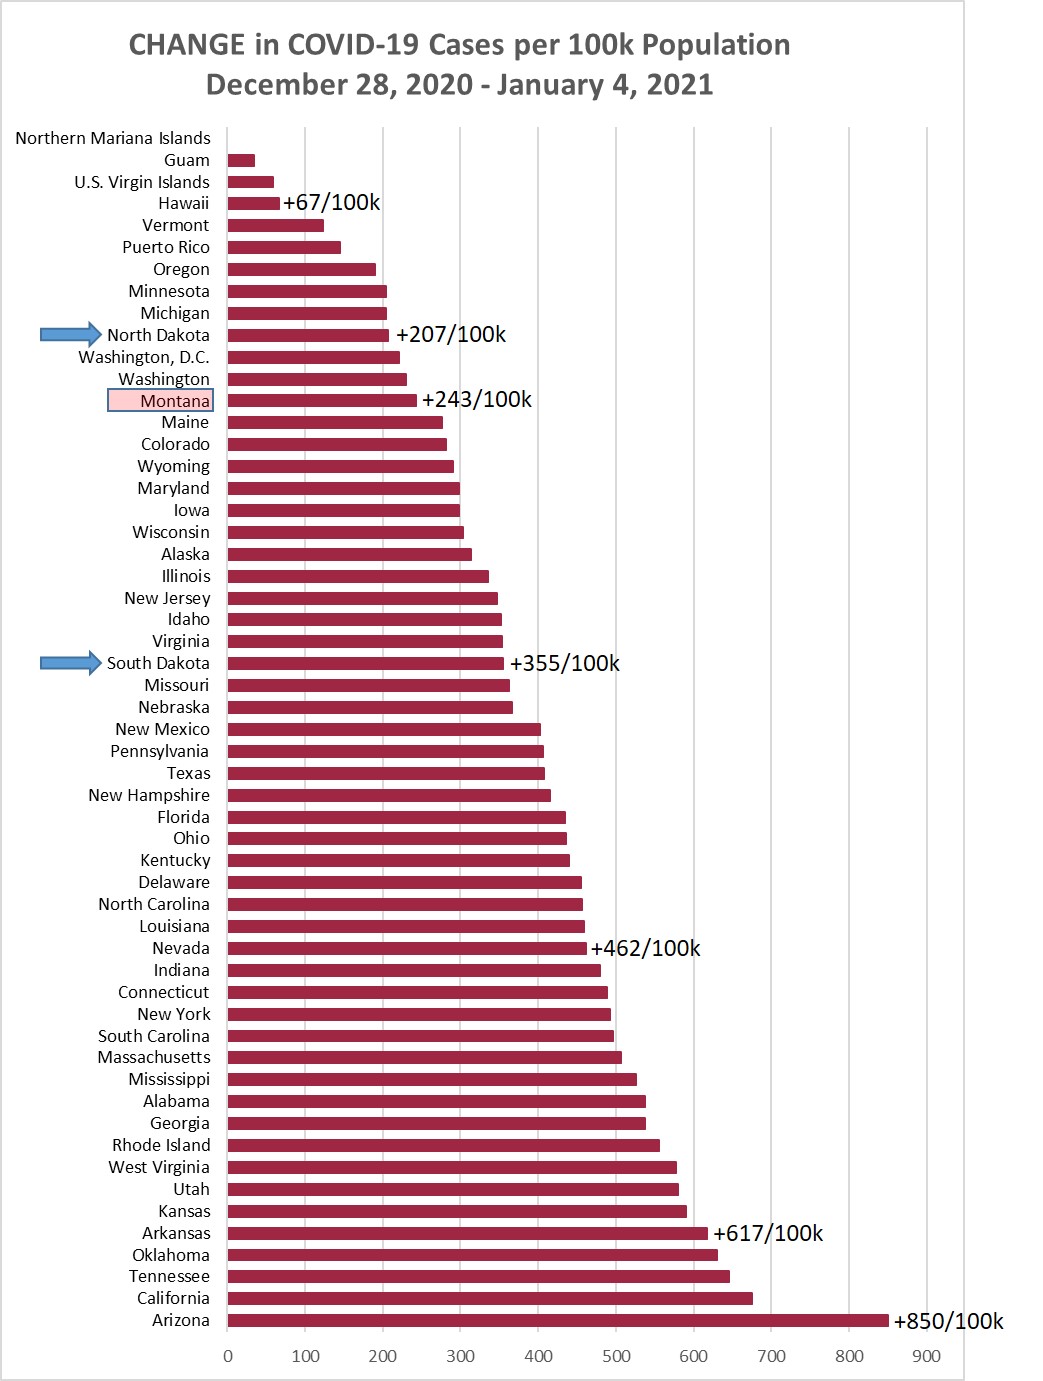
Chart 1 shows the change in cases per 100,000 population as of this morning (January
4, 2021) compared to the cases per 100,000 on December 28, 2020. Montana was up +243/100k
this week, which was slightly lower than the +245/100k the prior week, and the smallest
weekly increase since September 28. Arizona was the jurisdiction with the largest
weekly increase, a record increase for that state of +850/100k.
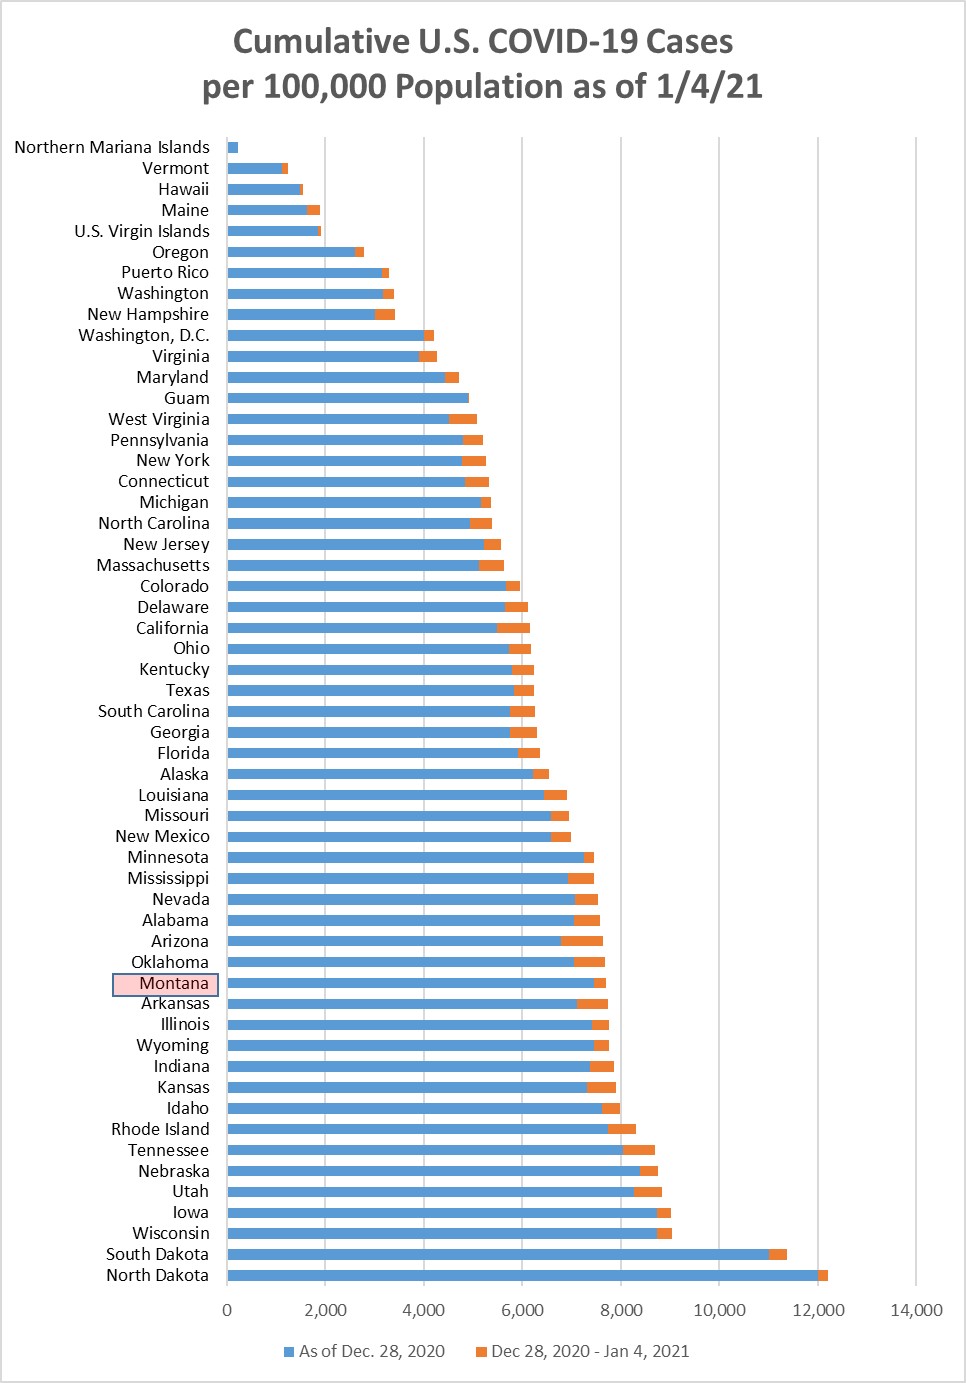
Chart 2 shows the same information as Chart 1, but with the overall cumulative cases
per 100k in each state to January 4. Montana is now down to position 41 (15th highest),
with 7.7% of our population having had a positive COVID test at some point.
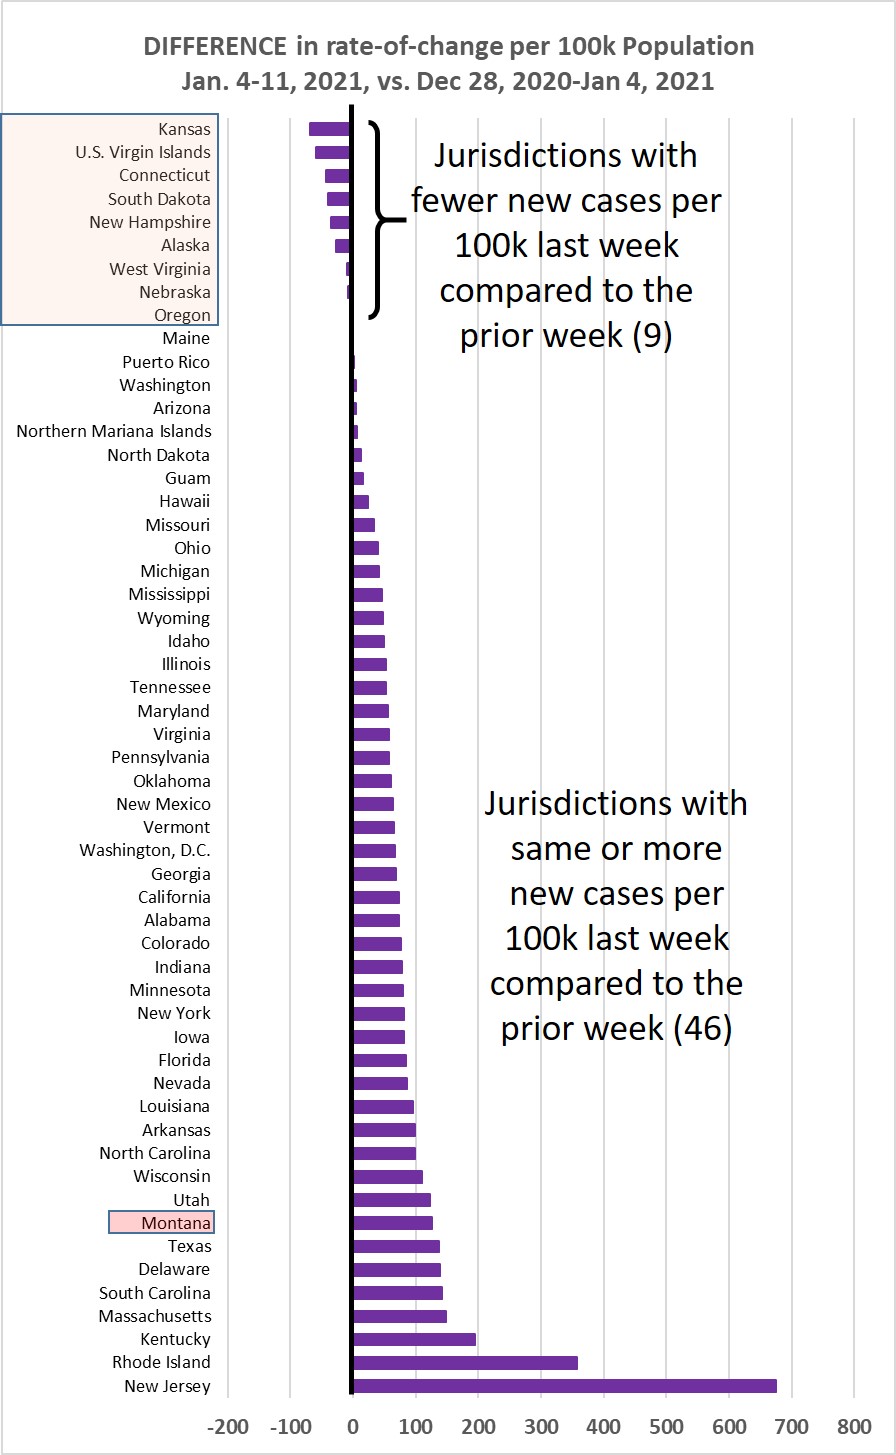
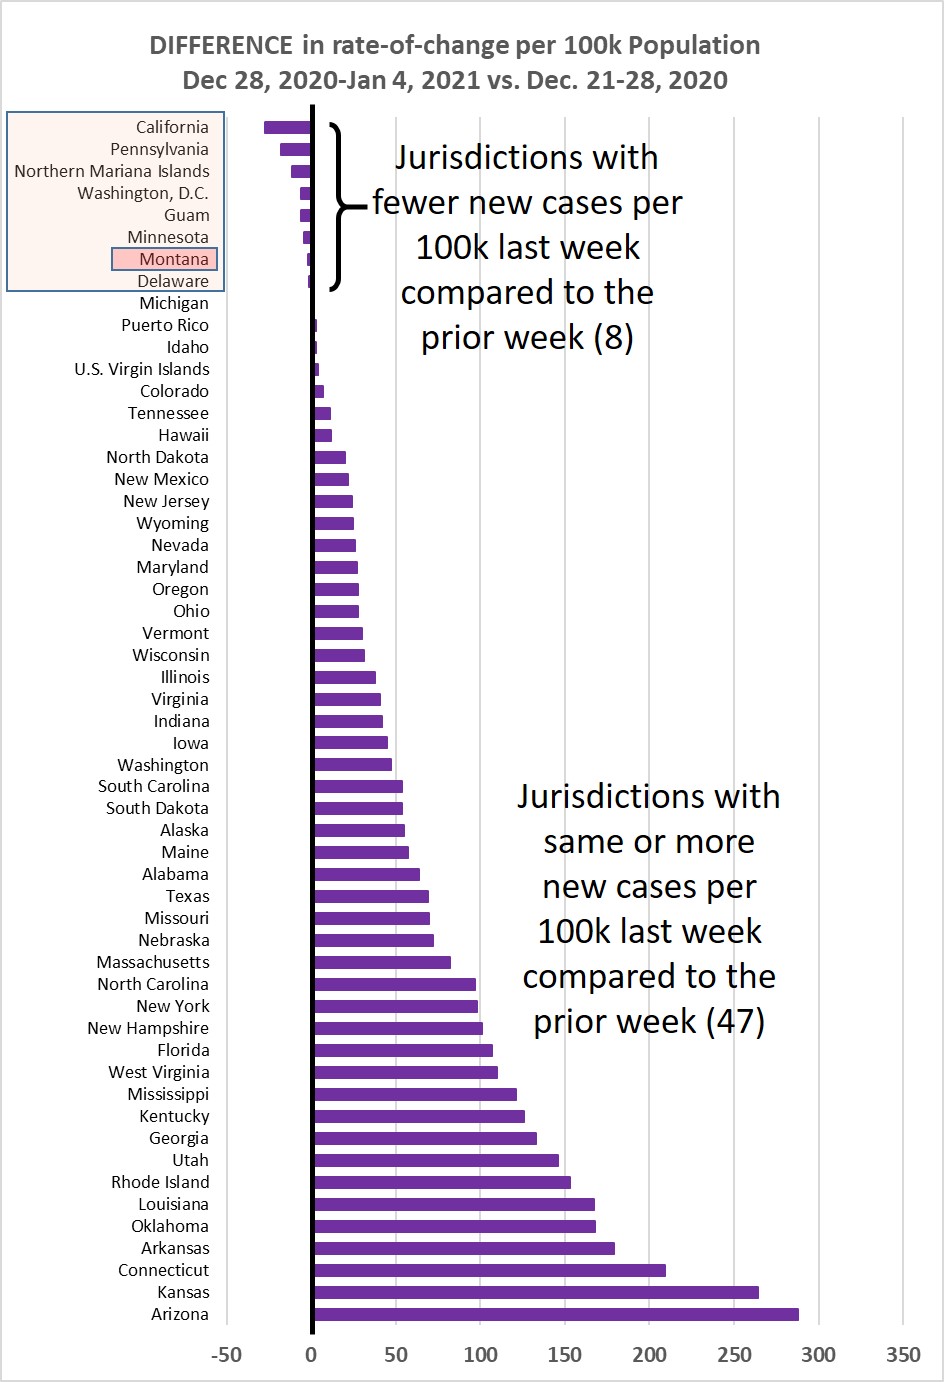
Chart 3 shows the difference in weekly new cases per 100k population for Dec. 28,
2020-Jan. 4, 2021, vs. Dec. 14-21, 2020. This past week, 85% of the jurisdictions
showed an increasing rate, compared to 5% of the jurisdictions the week before. Looks
like we are on yet another wave.
Monday, December 28, 2020
Last Monday of 2020. This week straddled the Christmas holiday, so the guidance is
that the numbers will be low for this week and next week due to fewer tests.
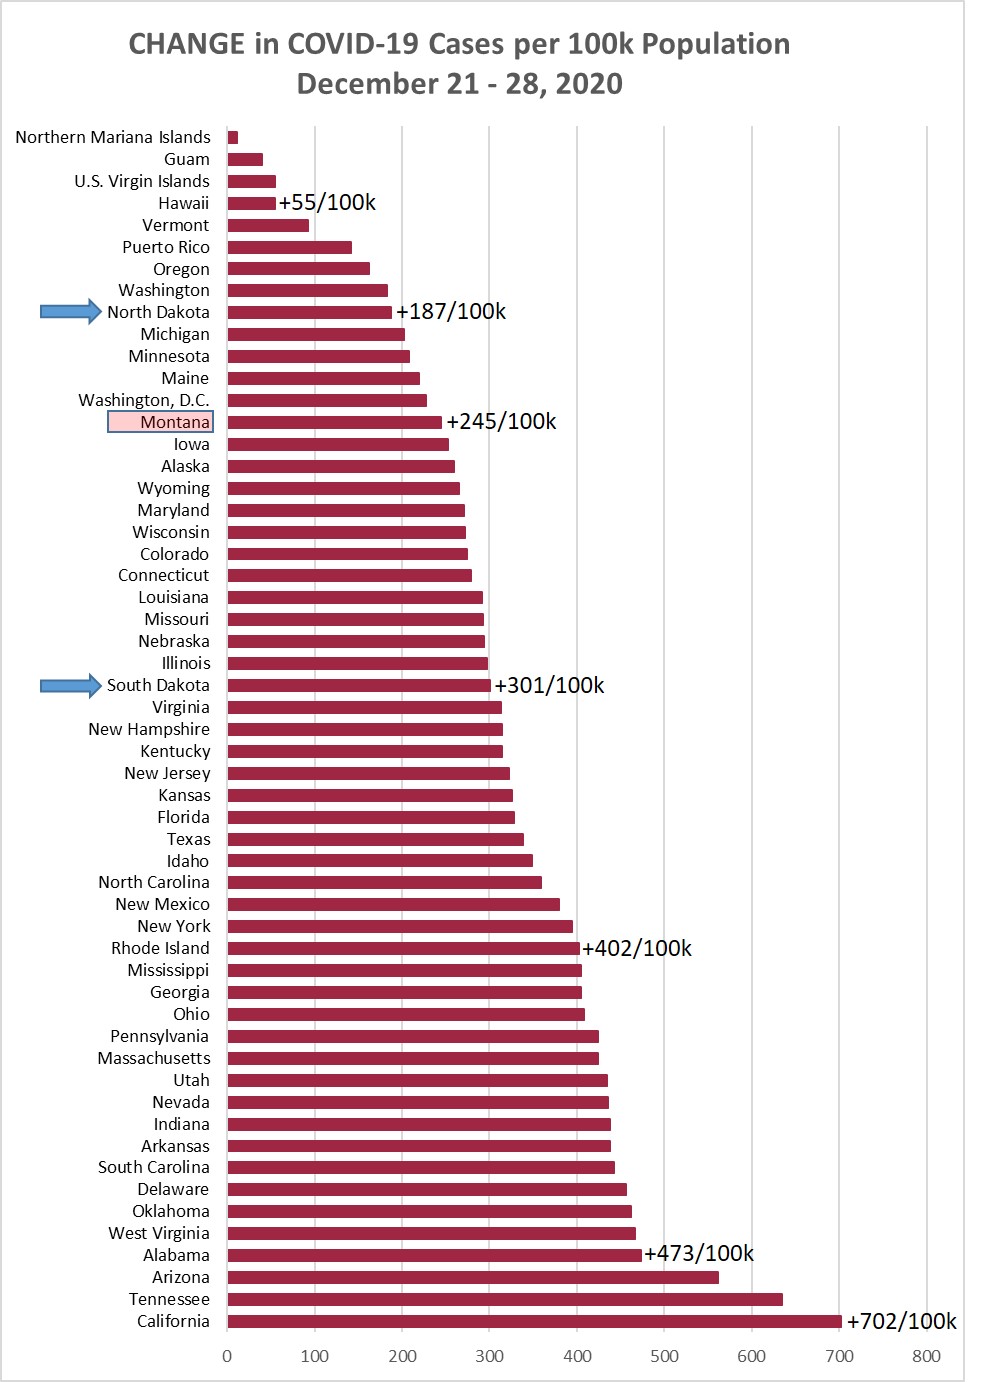
Chart 1 shows the change in cases per 100,000 population as of this morning (December
28) compared to the cases per 100,000 on December 21. Montana was up +245/100k this
week, which was lower than the +361/100k the prior week, and the smallest weekly increase
since October 5. California and Tennessee were the jurisdictions showing the biggest
increases last week, at +702/100k and +635/100k, respectively.
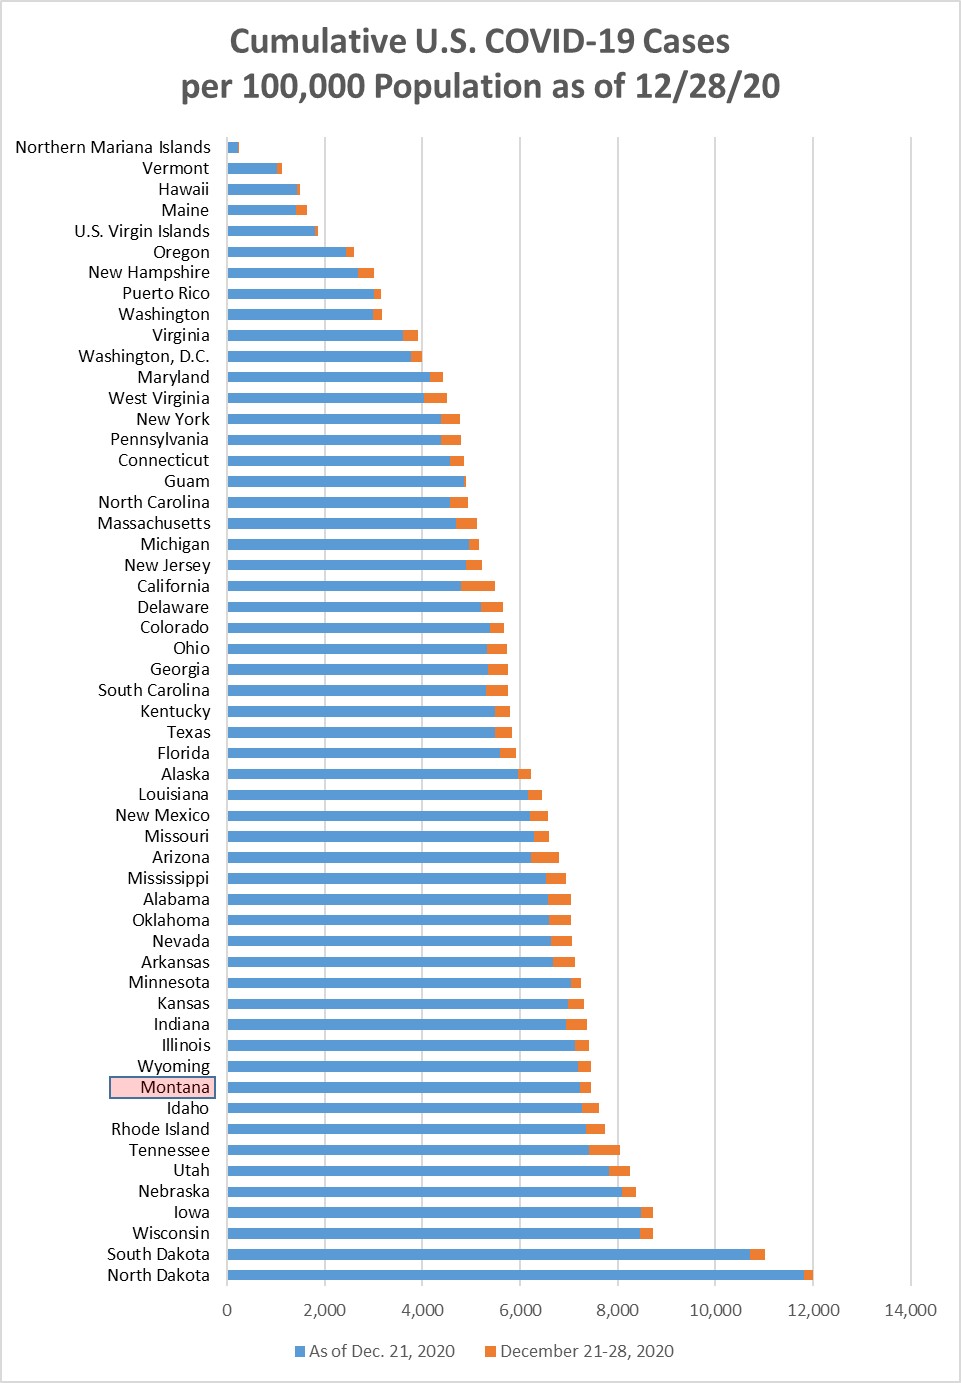
Chart 2 shows the same information as Chart 1, but with the overall cumulative cases
per 100k in each state to December 28. Montana remained in position 46 (10th highest),
with 7.5% of our population having had a positive COVID test at some point.
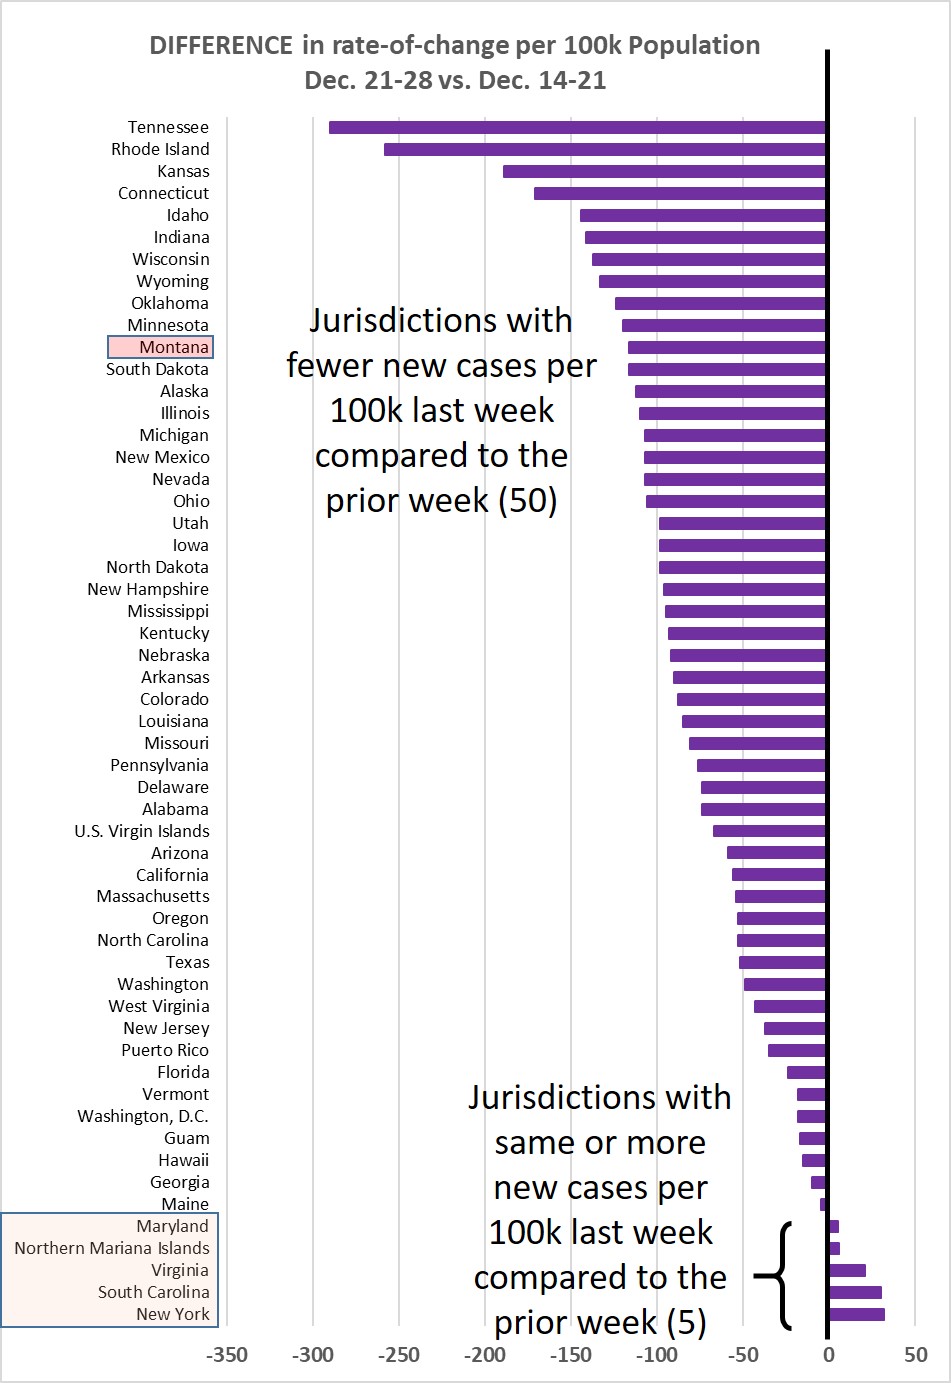
Chart 3 shows the difference in weekly new cases per 100k population for Dec. 21-28,
vs. Dec. 14-21, 2020. This past week, 9% of the jurisdictions showed an increasing
rate, compared to 31% of the jurisdictions the week before. The favorable trend continues.
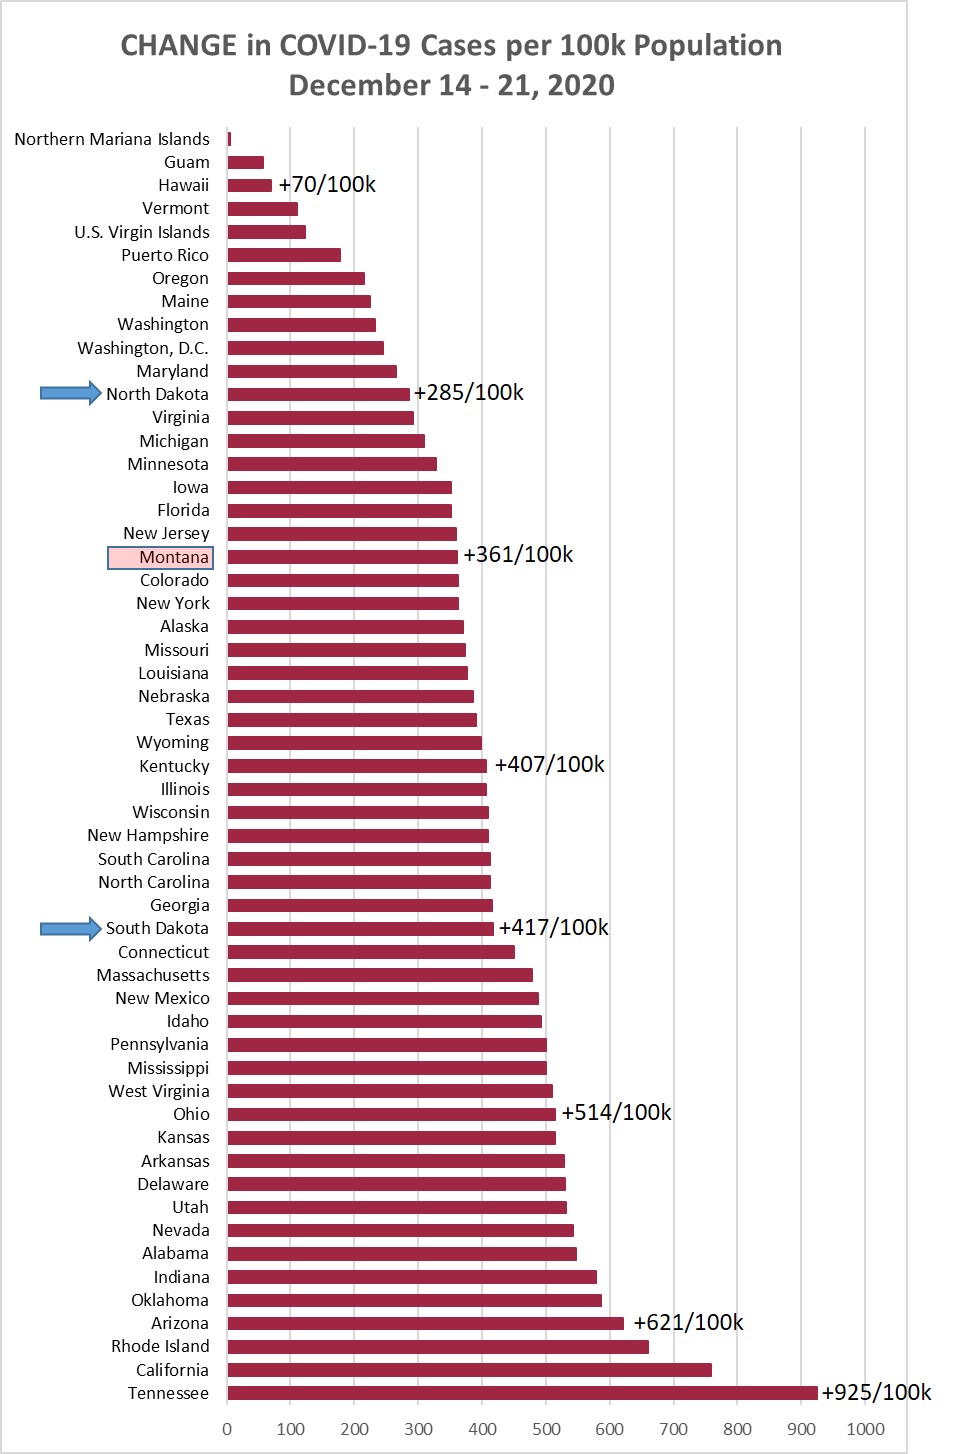
Monday, December 21, 2020
Chart 1 shows the change in cases per 100,000 population as of this morning (December
21) compared to the cases per 100,000 on December 14. Montana was up +361/100k this
week, which was lower than the +508/100k the prior week, and the smallest weekly increase
since October 5. Tennessee was the jurisdiction showing the biggest increase last
week, at +925/100k, compared to +752/100k the week before.
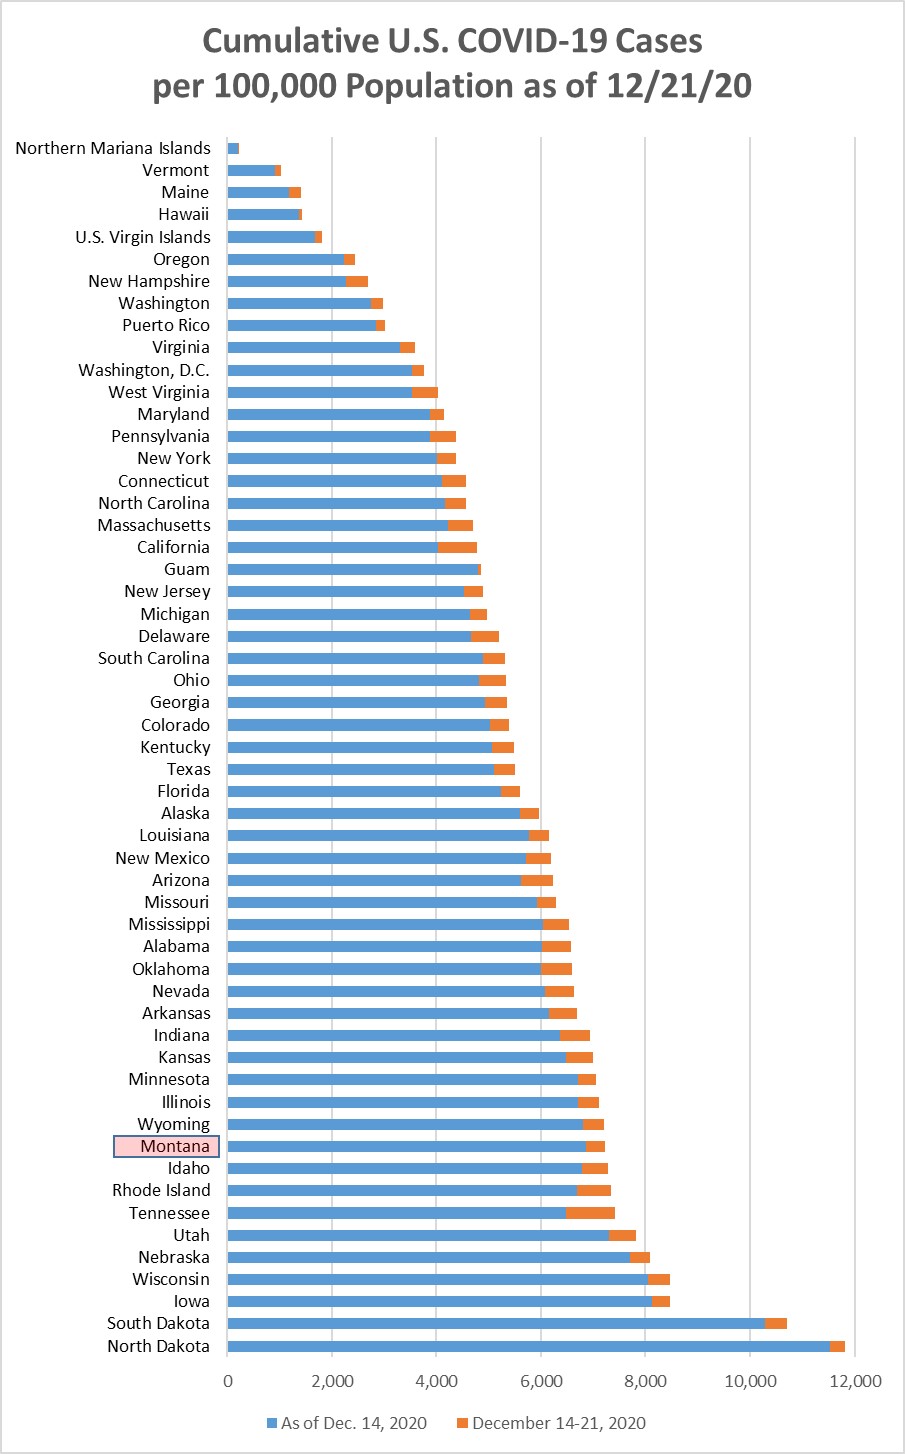
Chart 2 shows the same information as Chart 1, but with the overall cumulative cases
per 100k in each state to December 21. Montana is now in position 46 (10th highest),
down from position 49 (7th highest), with 7.2% of our population having had a positive
COVID test at some point.
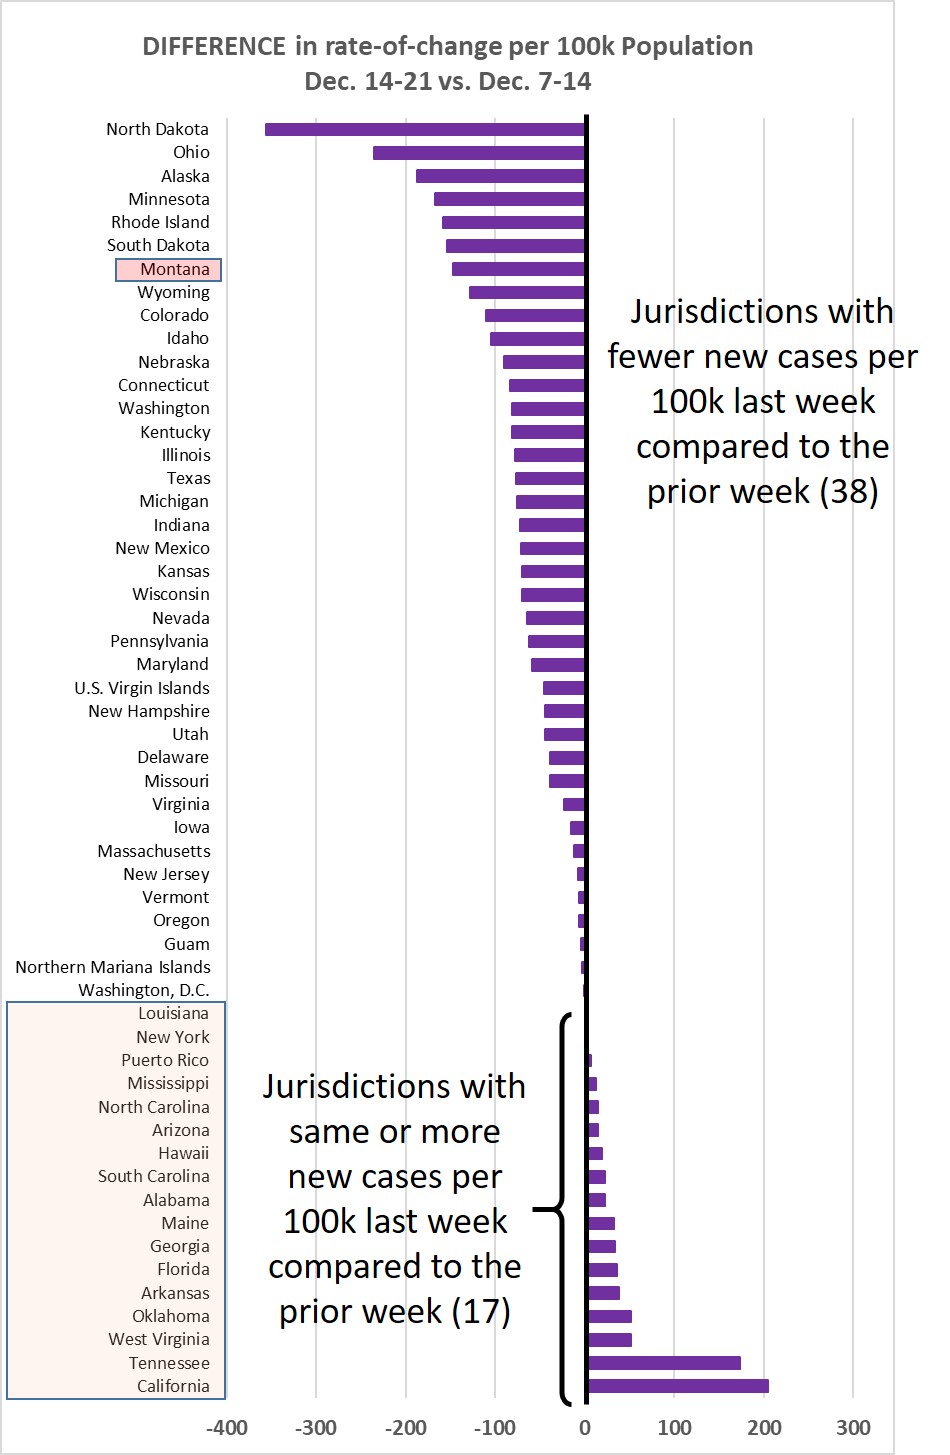
Chart 3 shows the difference in weekly new cases per 100k population for Dec. 14-21,
vs. Dec. 7-14, 2020. This past week, 31% of the jurisdictions showed an increasing
rate, compared to 62% of the jurisdictions the week before. The favorable trend continues.
Monday, December 14, 2020
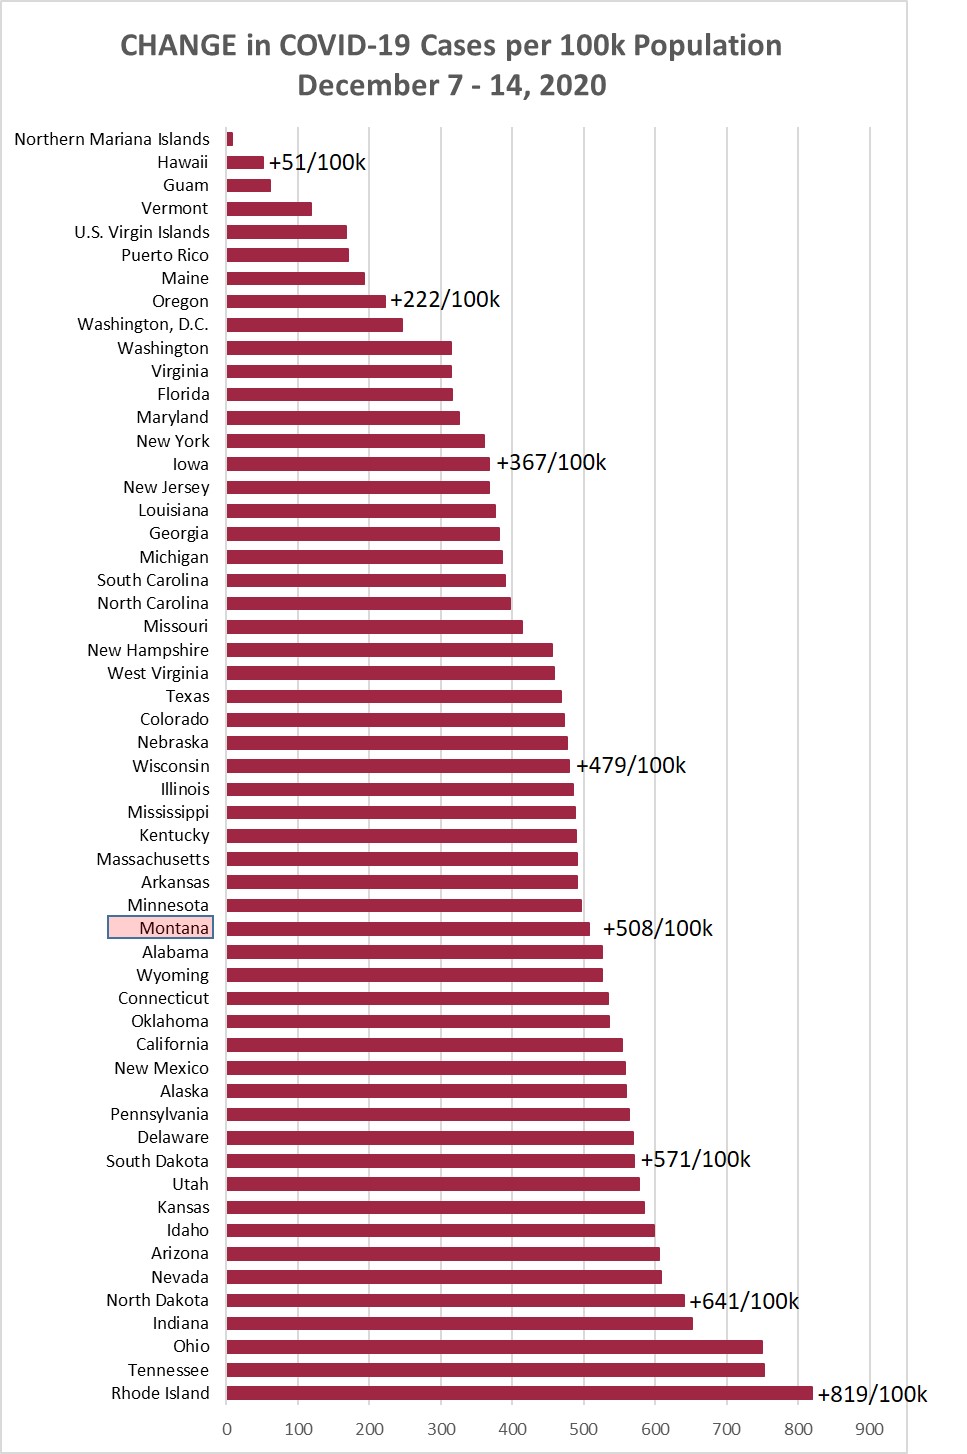
Chart 1 shows the change in cases per 100,000 population as of this morning (December
14) compared to the cases per 100,000 on December 7. Montana was up +508/100k this
week, which was lower than the +569/100k the prior week. Rhode Island was again the
jurisdiction showing the biggest increase last week, at +819/100k, compared to +773/100k
the week before.
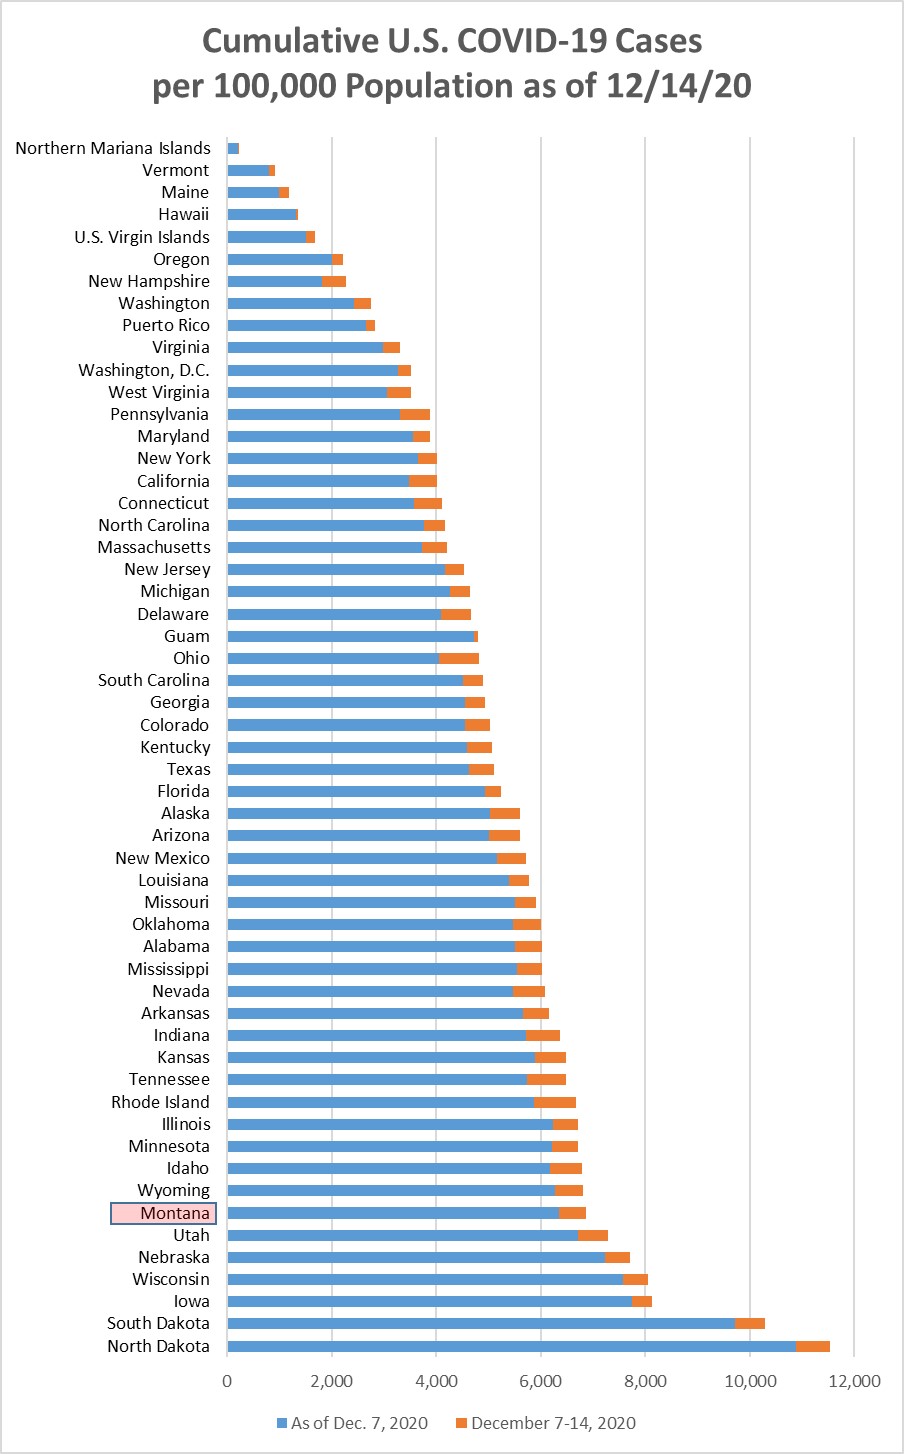
Chart 2 shows the same information as Chart 1, but with the overall cumulative cases
per 100k in each state to December 14. Montana remained in position 49 (7th highest),
with 6.9% of our population having had a positive COVID test at some point. North
Dakota appears likely to cross the 12% positive test penetration this coming week.
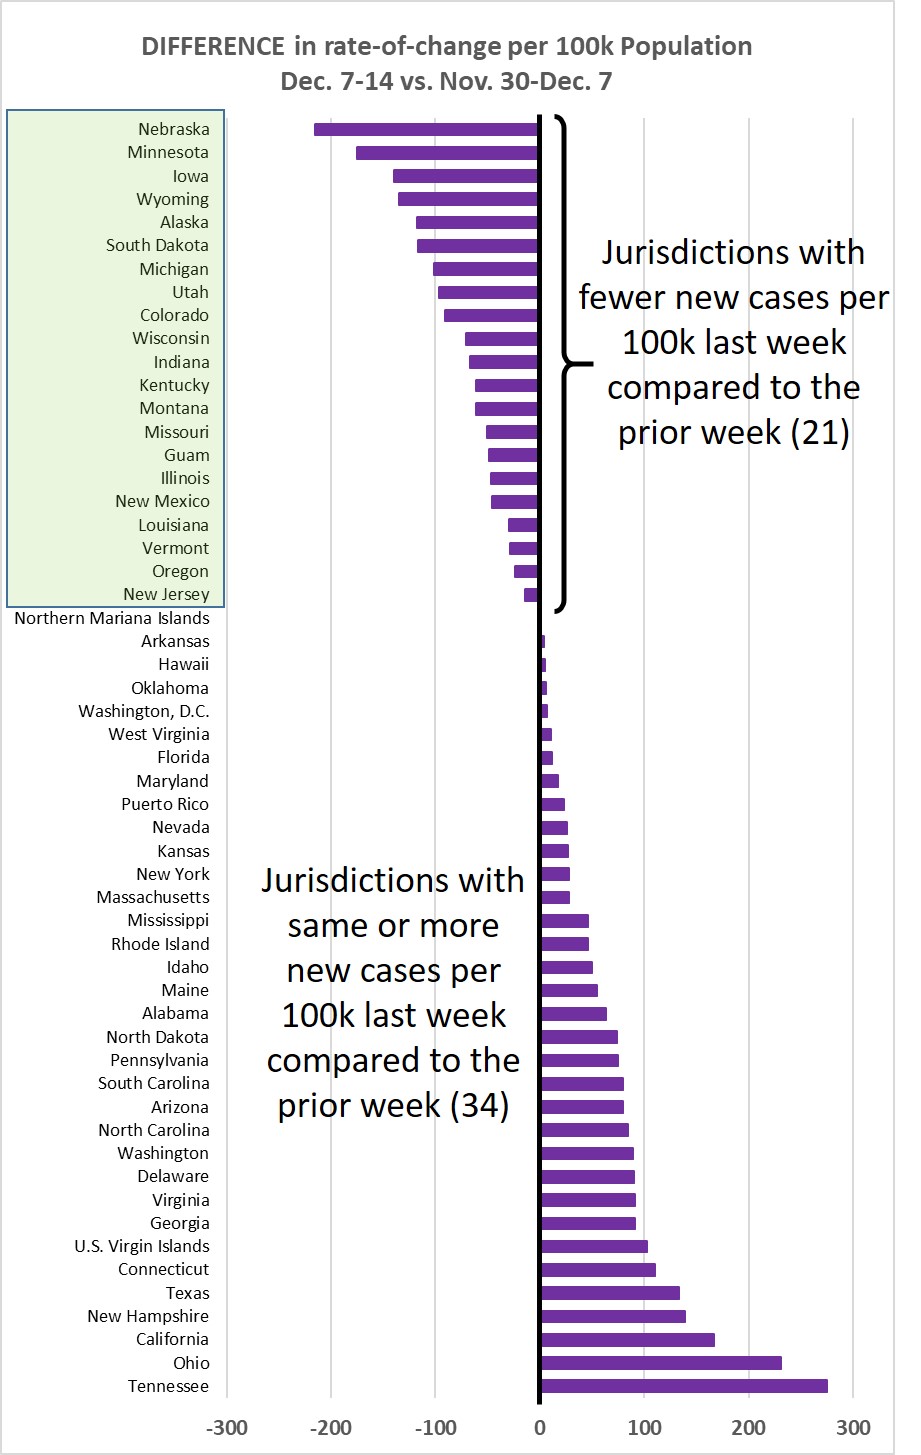
Chart 3 shows the difference in weekly new cases per 100k population for Dec. 7-14,
vs. Nov. 30-Dec. 7, 2020. This past week, 62% of the jurisdictions showed an increasing
rate, compared to 75% of the jurisdictions the week before. Hope that trend continues.
Monday, December 7, 2020
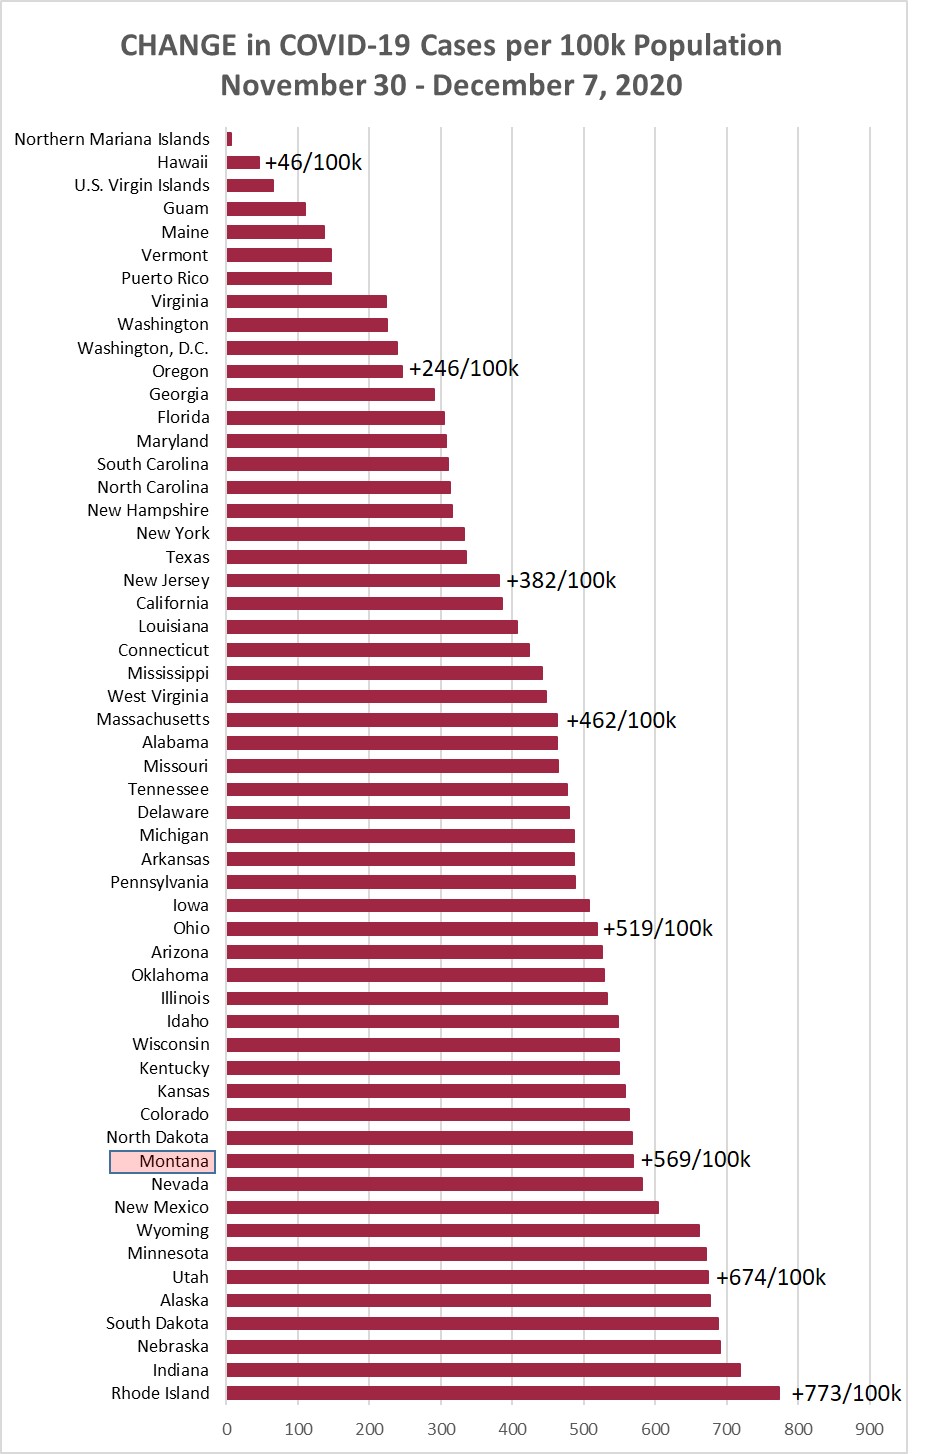
Chart 1 shows the change in cases per 100,000 population as of this morning (December
7) compared to the cases per 100,000 on November 30. Montana was up +569/100k this
week, which was slightly lower than the +572/100k the prior week. Rhode Island was
the jurisdiction showing the biggest increase last week, at +773/100k.
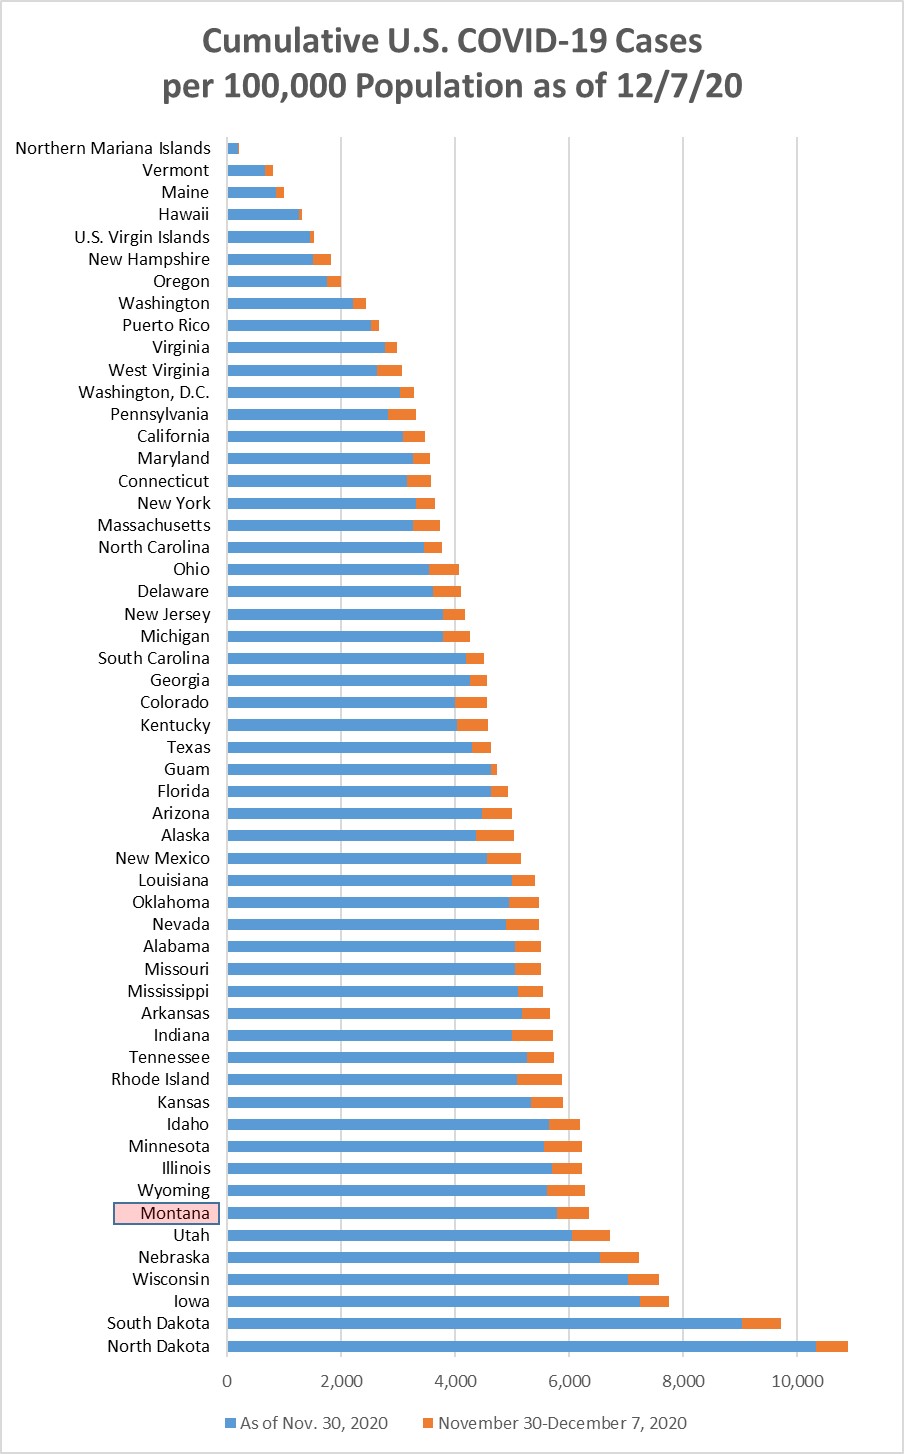
Chart 2 shows the same information as Chart 1, but with the overall cumulative cases
per 100k in each state to December 7. Montana remained in position 49 (7th highest),
with 6.4% of our population having had a positive COVID test at some point.
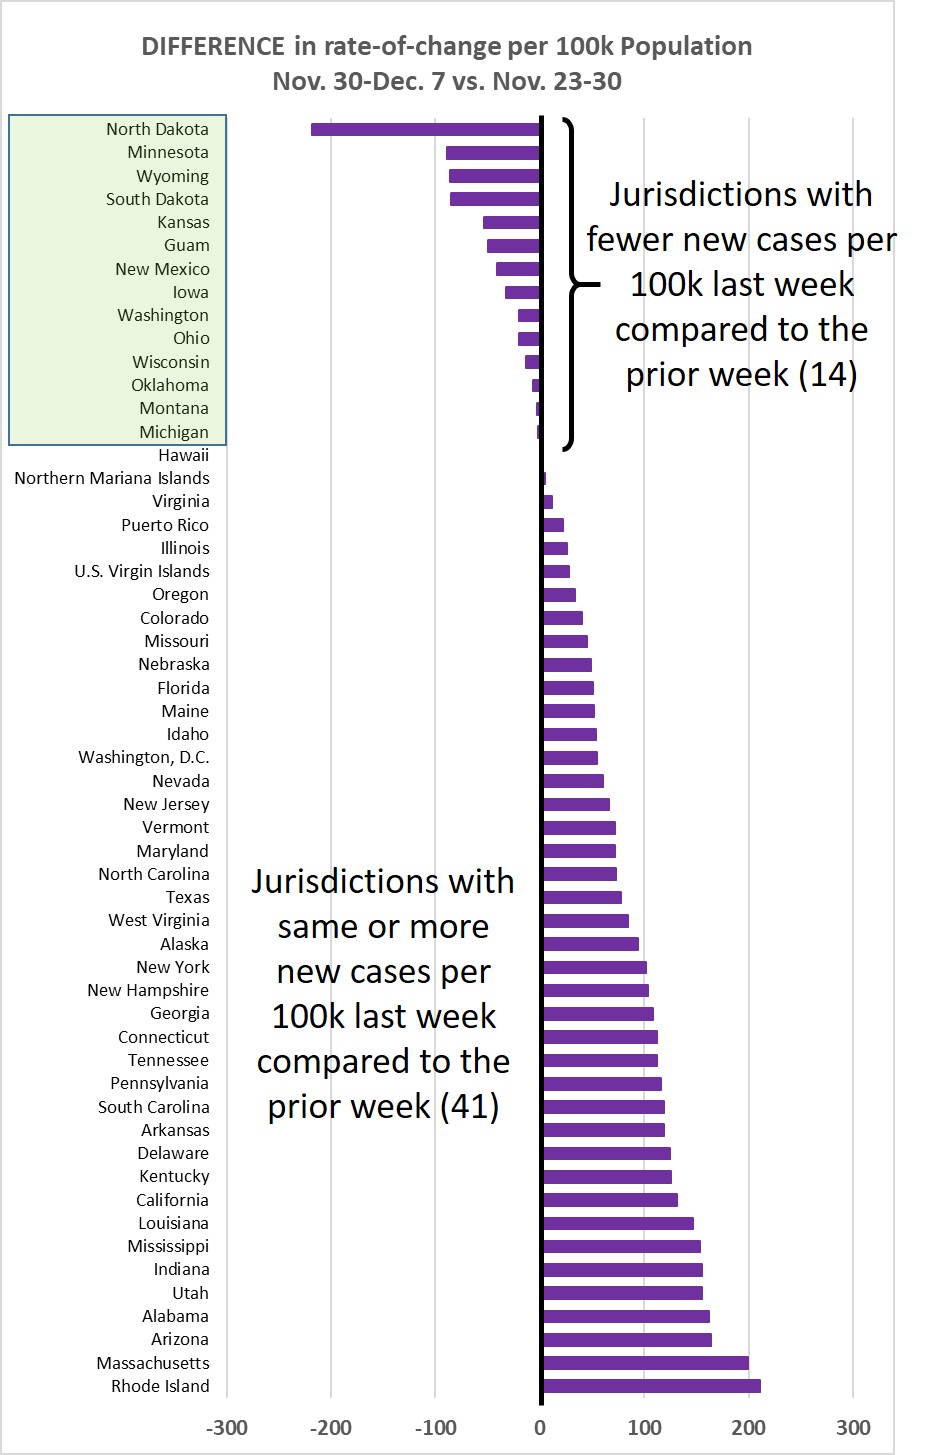
Chart 3 shows the difference in weekly new cases per 100k population for Nov. 30-Dec.
7, vs. Nov. 23-30, 2020. This week, 76% of the jurisdictions showed an increasing
rate of cases
Monday, November 30, 2020
Note: The information for the last seven days over Thanksgiving is expected to reflect
the lower testing rate of the holiday period.
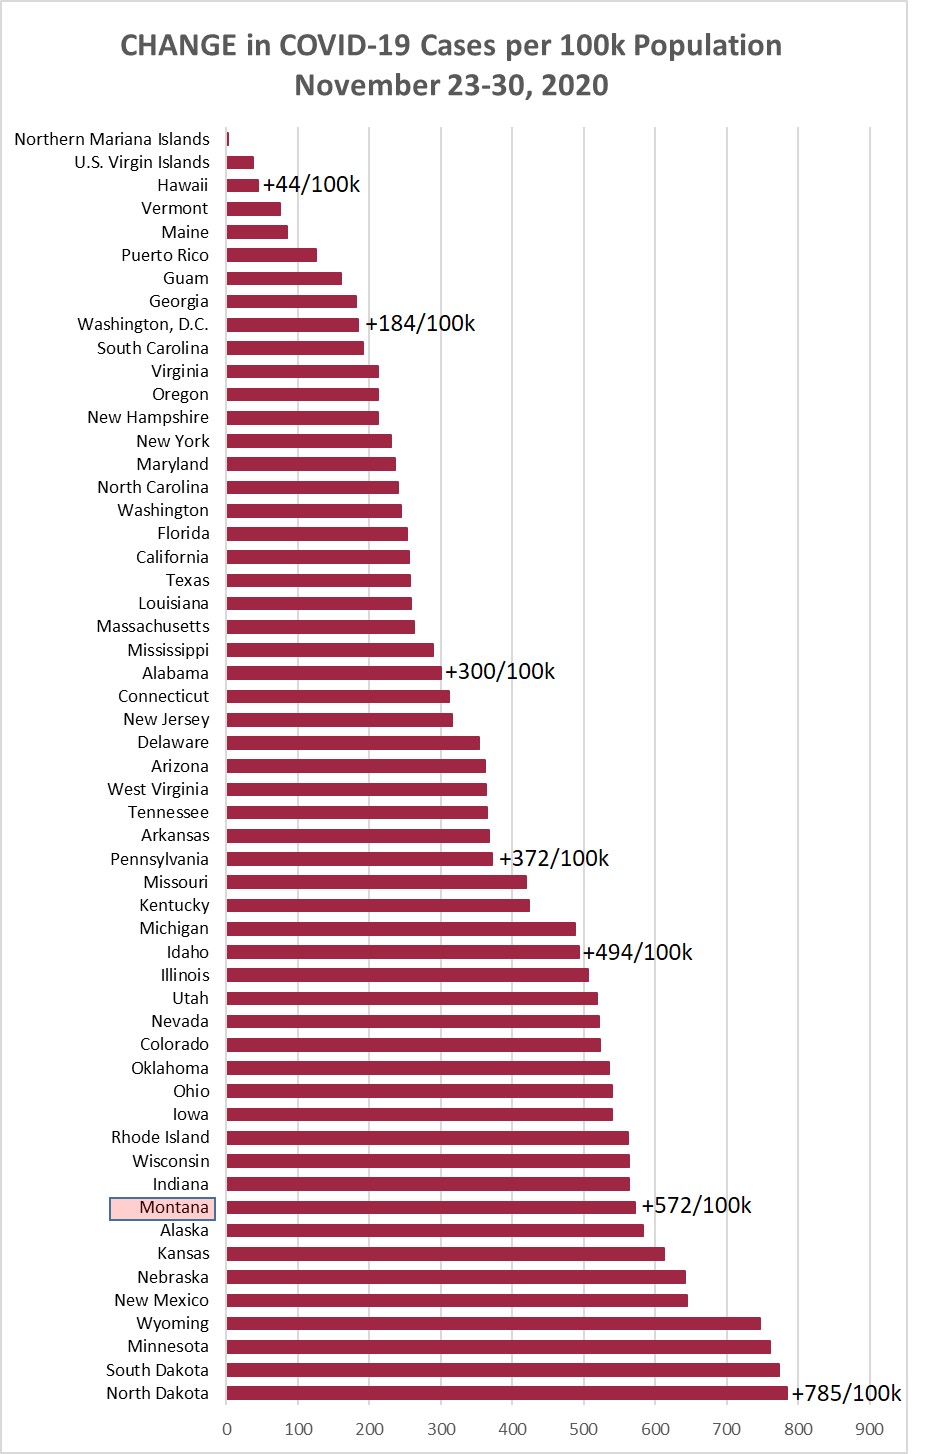
Chart 1 shows the change in cases per 100,000 population as of this morning (November
30) compared to the cases per 100,000 on November 23. Montana was up +572/100k this
week, which was lower than the +798/100k the prior week. North Dakota increased by
+785/100k, also down from +1,166/100k the prior week. The decreases are likely due
to the holiday-related decreases in testing.
Chart 2 shows the same information as Chart 1, but with the overall cumulative cases
per 100k in each state to November 30. Montana remained in position 49 (7th highest).
North Dakota now exceeds 10% of the population having had a positive Covid test at
some point during the pandemic.
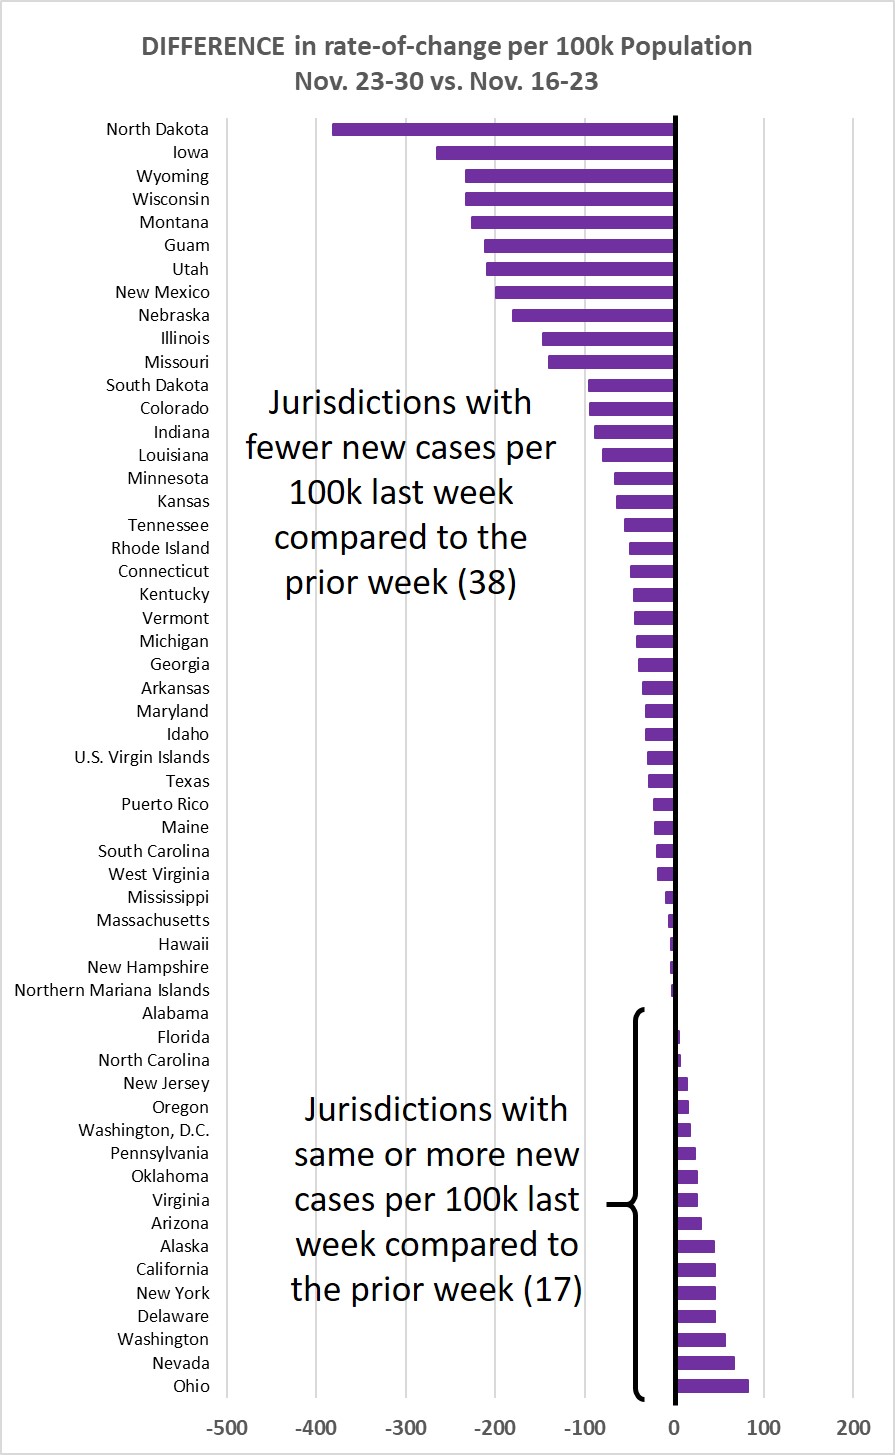
Chart 3 shows the difference in weekly new cases per 100k population for for Nov.
23-30, vs. Nov. 16-23, 2020. This week, 69% of the jurisdictions showed a decreasing
rate of cases, but this may be attributable to the holiday.

Monday, November 23, 2020
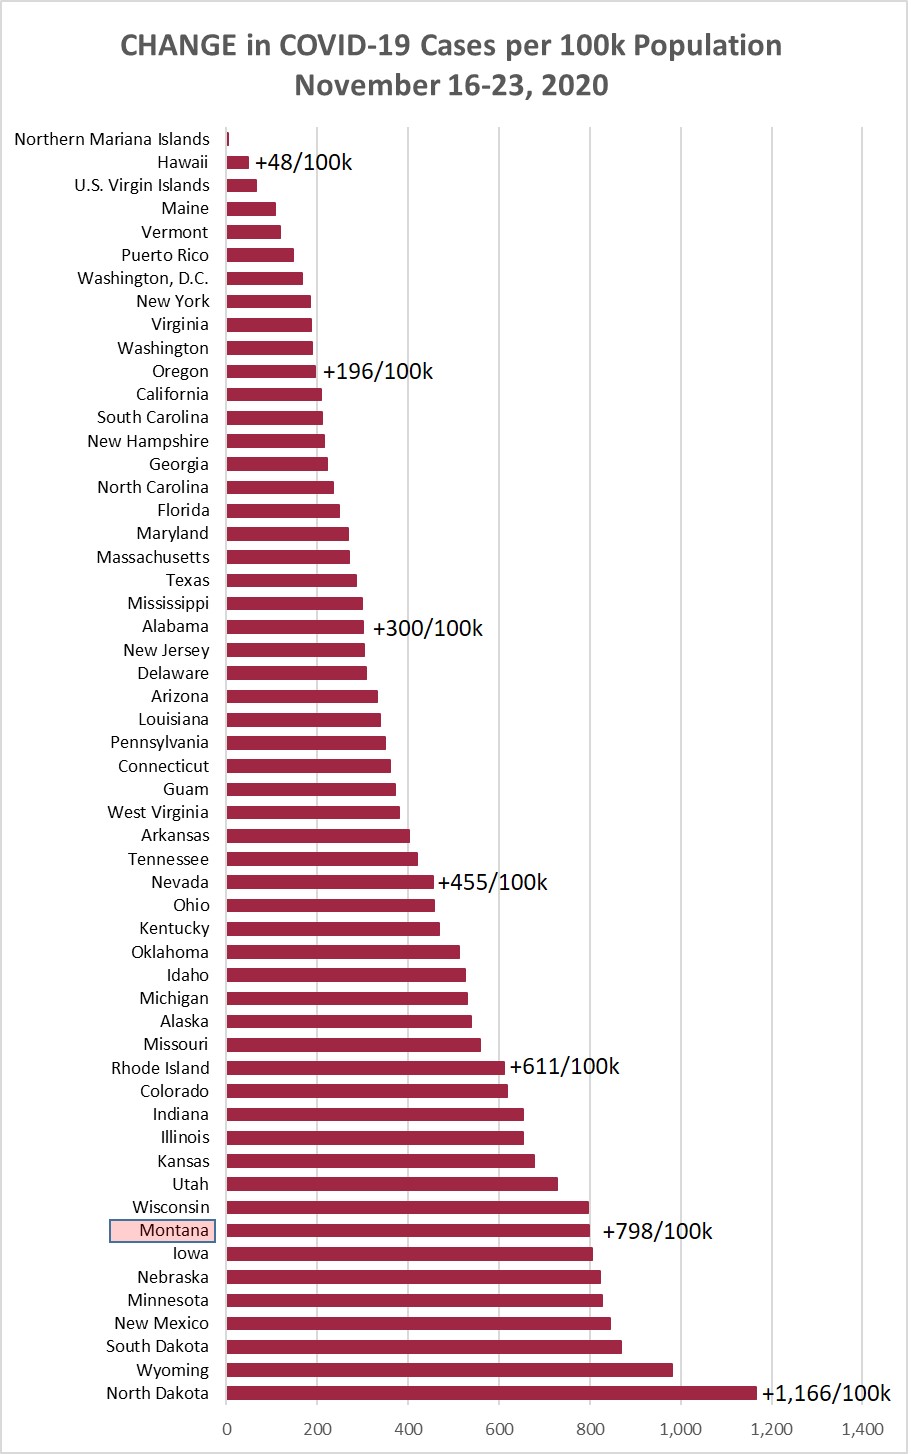
Chart 1 shows the change in cases per 100,000 population as of this morning (November
23) compared to the cases per 100,000 on November 16. Montana jumped another new record
+798/100k this week (again 8th highest in the country). The highest previous jump
in Montana was the prior week at +699/100k. North Dakota increased by +1,166/100k,
down slightly from the prior week's 1,245/100k. North Dakota has managed to infect
more than 1% of the population there each week for the past two weeks.
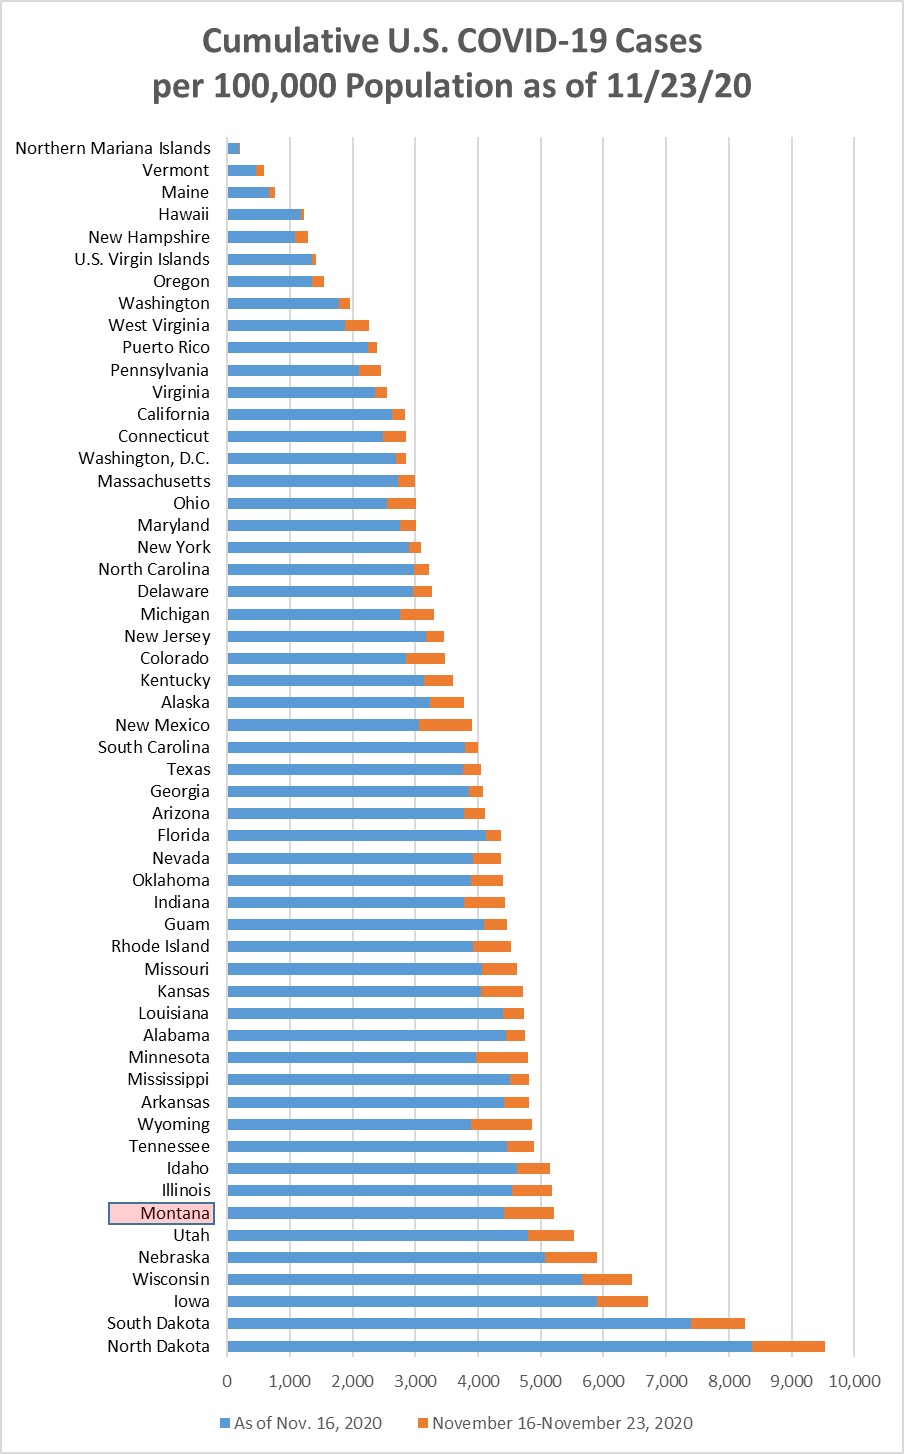
Chart 2 shows the same information as Chart 1, but with the overall cumulative cases
per 100k in each state to November 23. Montana jumped from position 44 to position
49 (now 7th highest).
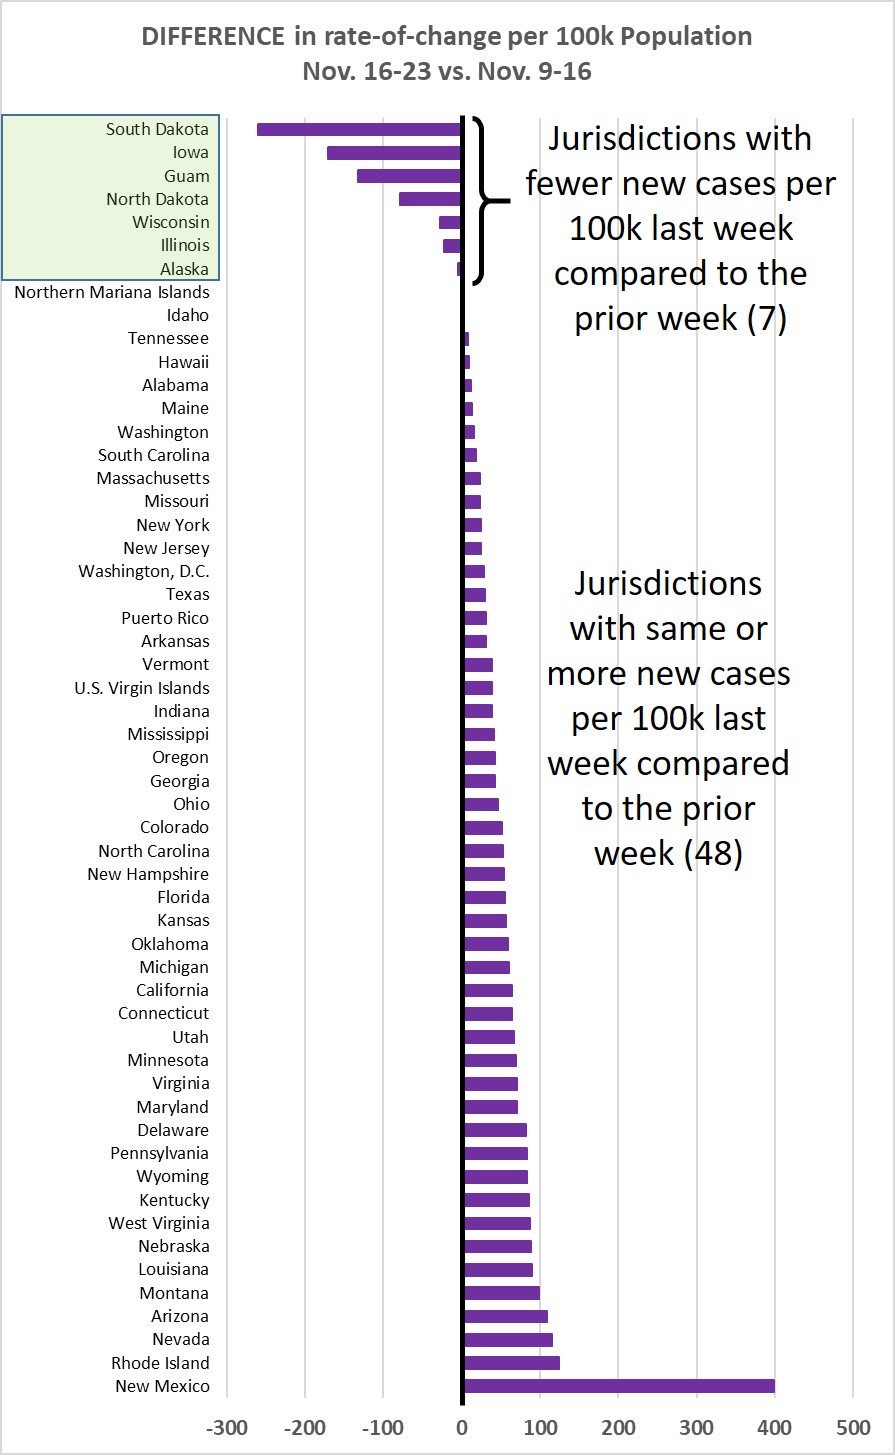
Chart 3 shows the difference in weekly new cases per 100k population for for Nov.
16-23, vs. Nov. 9-16, 2020. This week, 87% of the jurisdictions showed steady or increasing
rate of cases, but there might be an indication that North and South Dakota have crested
the surge--or can't test enough to keep up.
Monday, November 16, 2020
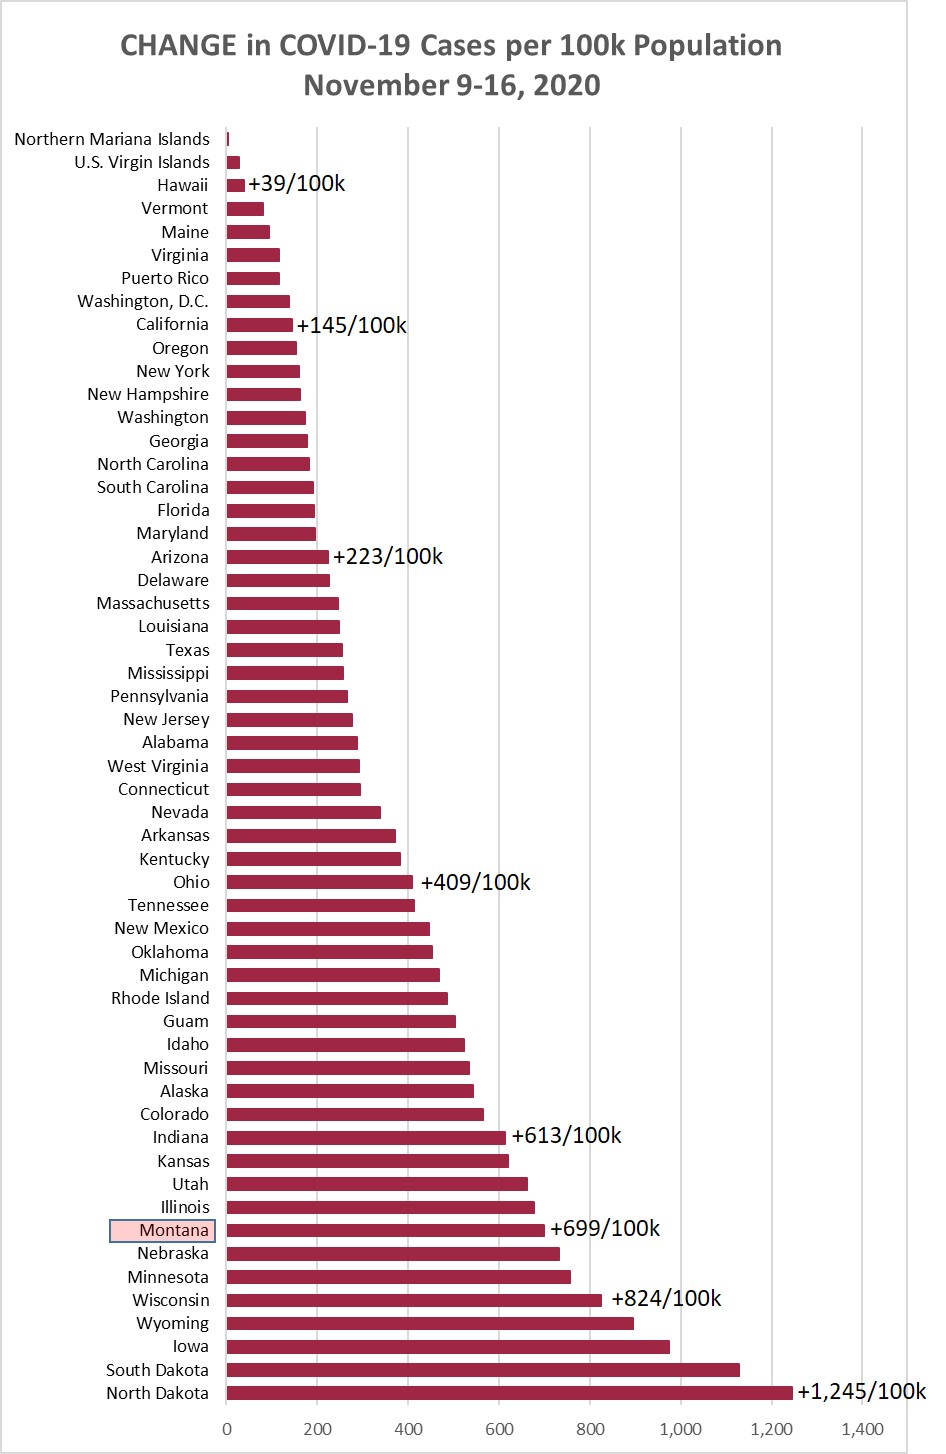
Chart 1 shows the change in cases per 100,000 population as of this morning (November
16) compared to the cases per 100,000 on November 9. Montana jumped another new record
+699/100k this week (8th highest in the country). The highest previous jump in Montana
was the prior week at +579/100k. North and South Dakota increased by +1,245/100k and
+1,128/100k, respectively. The Dakotas managed to infect more than 1% of their populations
in just the last week alone.
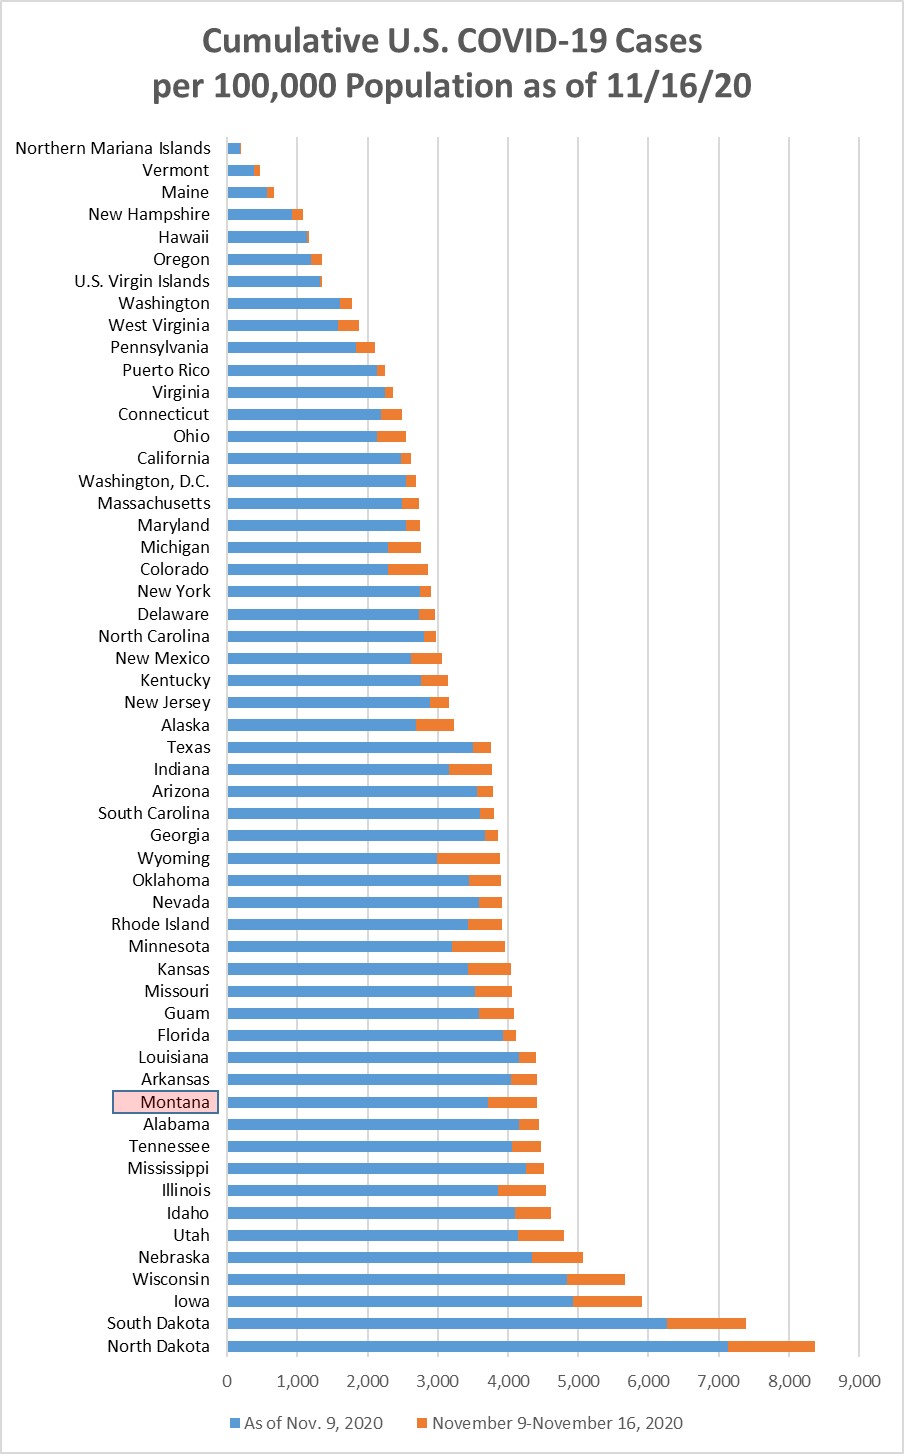
Chart 2 shows the same information as Chart 1, but with the overall cumulative cases
per 100k in each state to November 16. Montana jumped from position 41 to position
44 (now 12th highest).
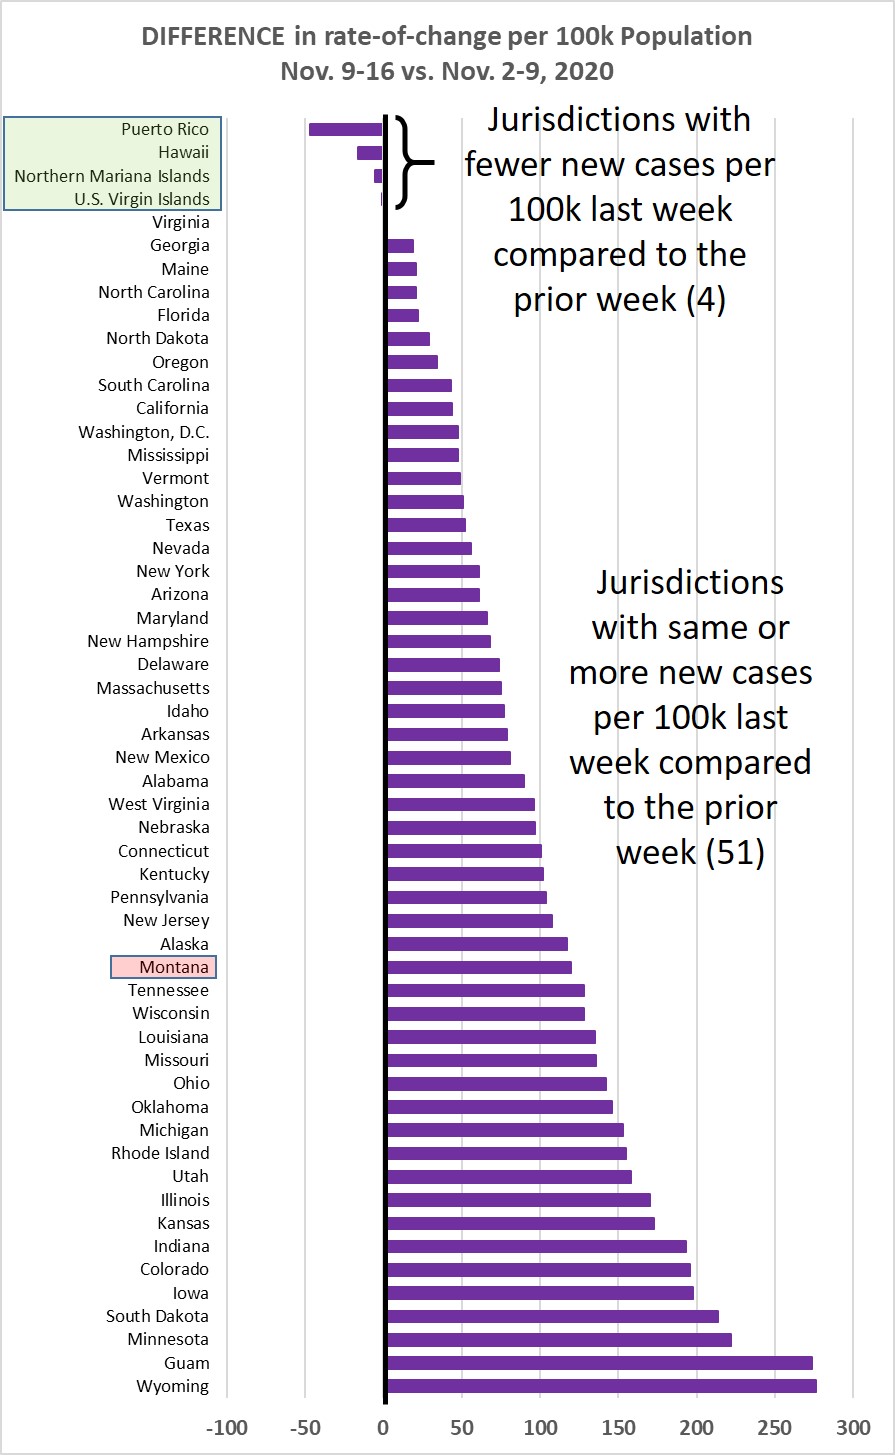
Chart 3 shows the difference in weekly new cases per 100k population for for Nov.
9-16, vs. Nov. 2-9, 2020. This week, 93% of the jurisdictions showed steady or increasing
rate of cases.
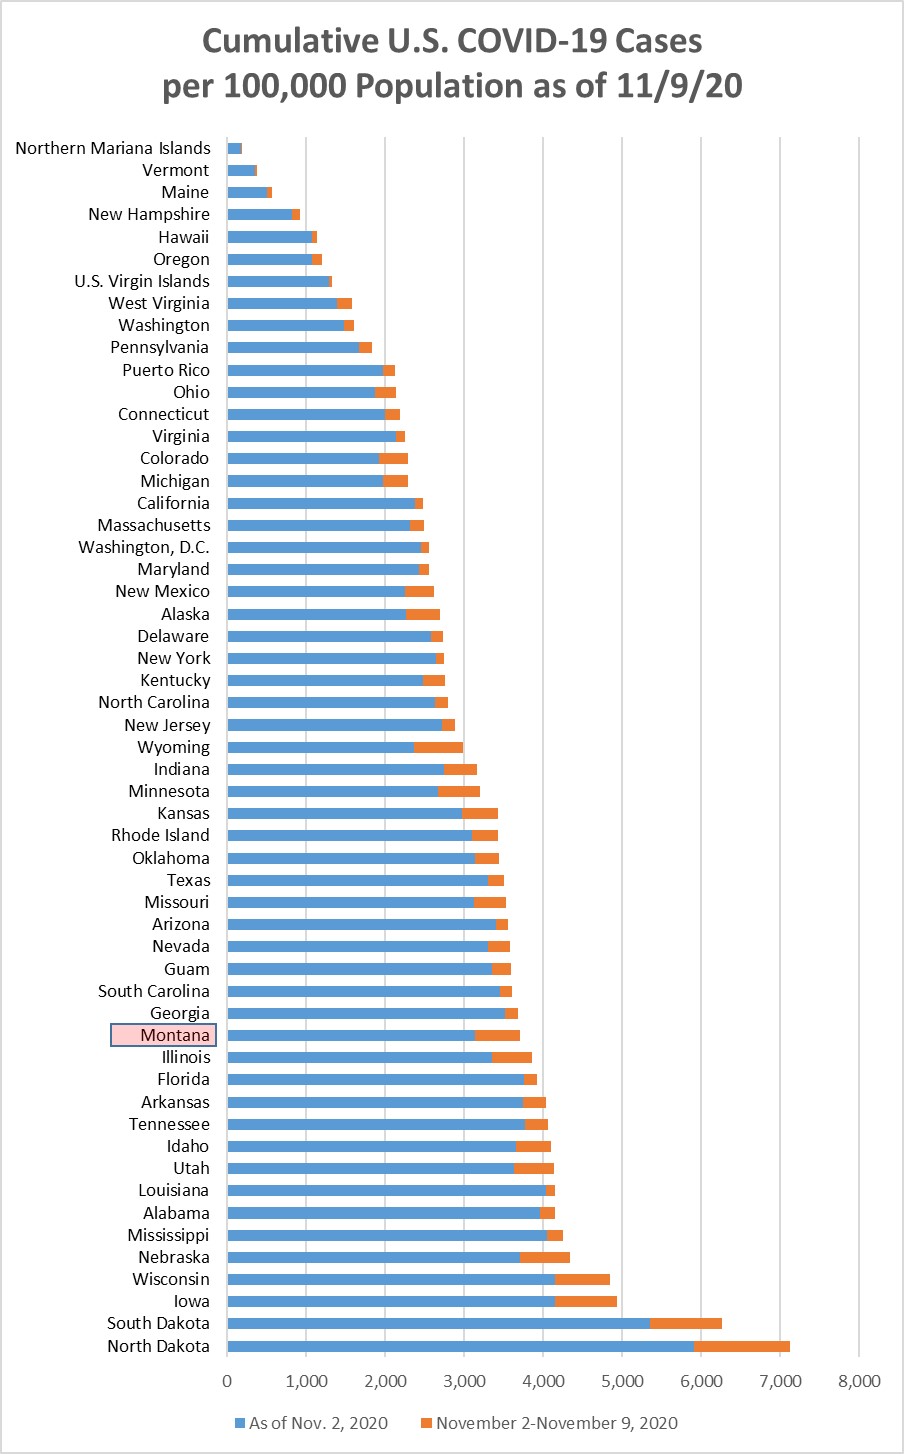
Monday, November 9, 2020
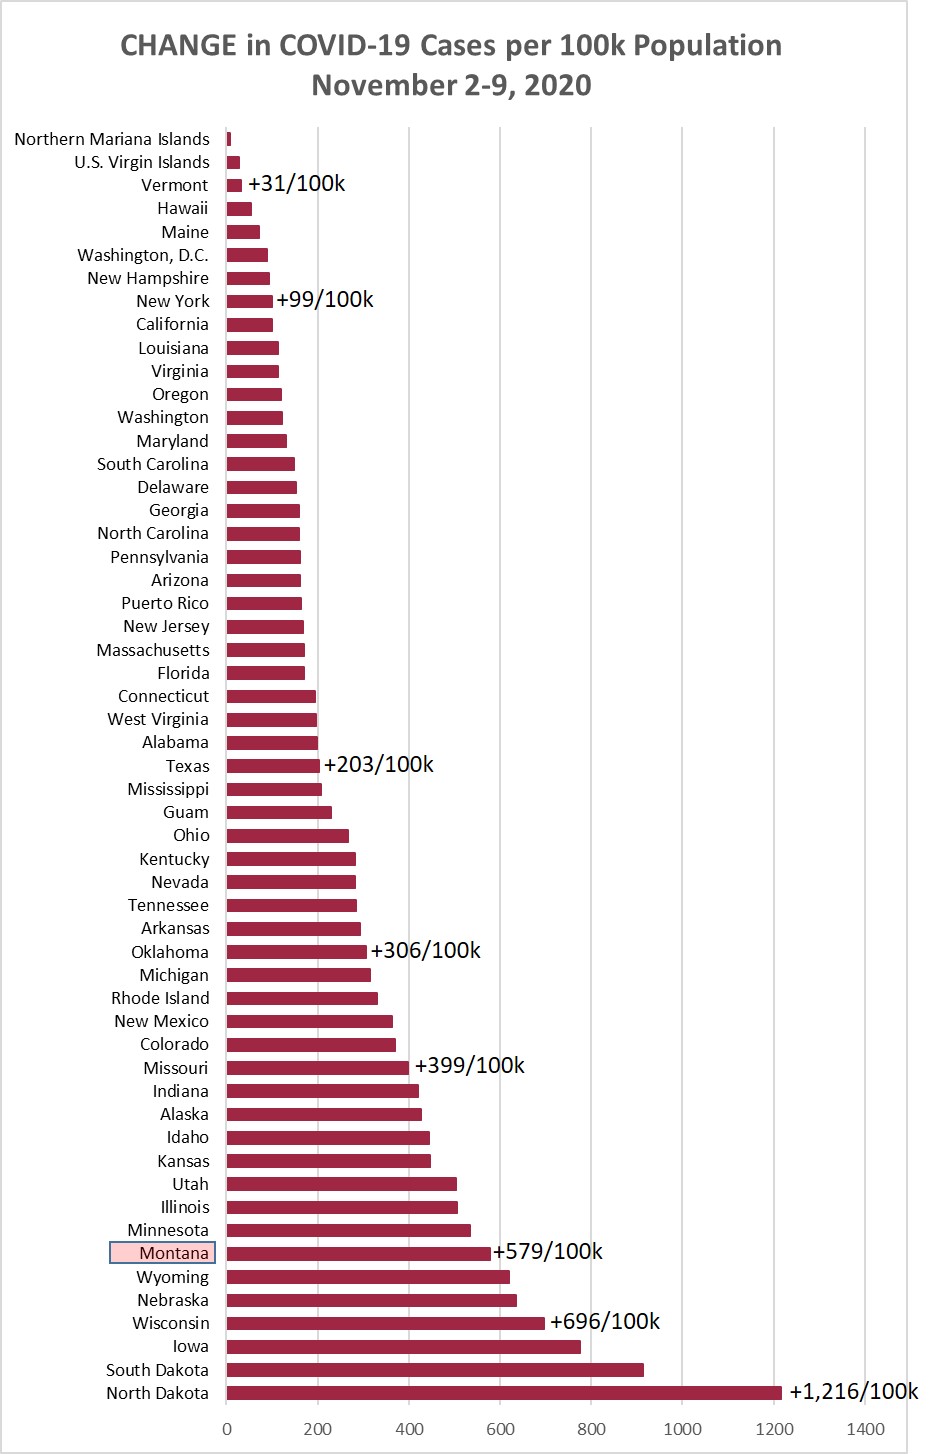
Chart 1 shows the change in cases per 100,000 population as of this morning (November
9) compared to the cases per 100,000 on November 2. Montana jumped another new record
+579/100k this week (7th highest in the country). The highest previous jump in Montana
was the prior week at +525/100k. North and South Dakota increased by +1,216/100k and
+914/100k, respectively. North Dakota shows by far the greatest weekly increase in
any jurisdiction since the pandemic began. South Dakota's rate is down slightly from
its record +918/100k the prior week.
Chart 2 shows the same information as Chart 1, but with the overall cumulative cases
per 100k in each state to November 9. Montana jumped from position 34 to position
41 (now 15th highest).
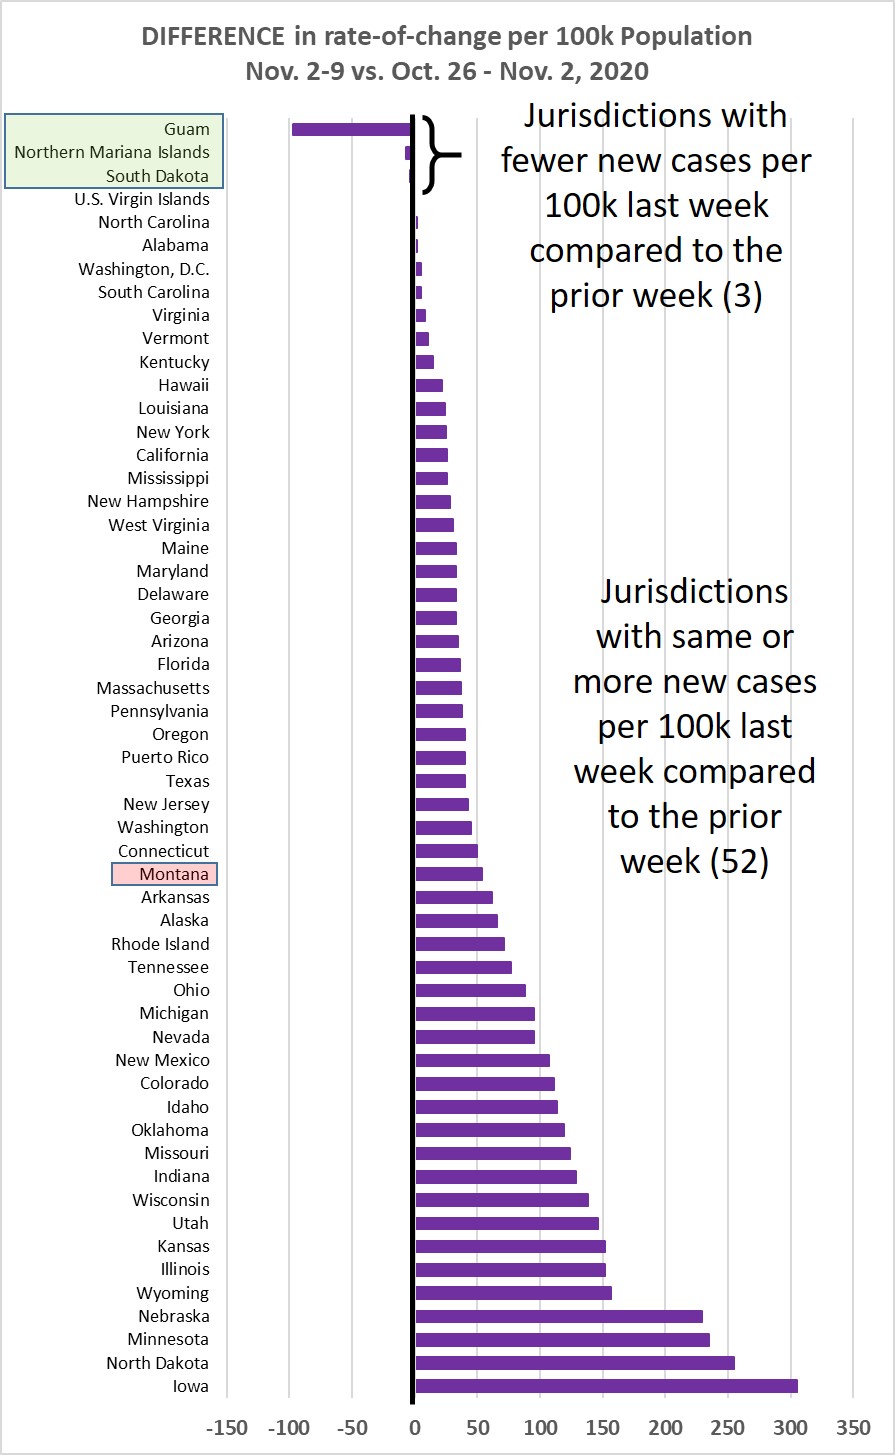
Chart 3 shows the difference in weekly new cases per 100k population for Nov. 2-9,
vs. Oct. 26-Nov. 2, 2020. This week, 95% of the jurisdictions showed steady or increasing
rate of cases.
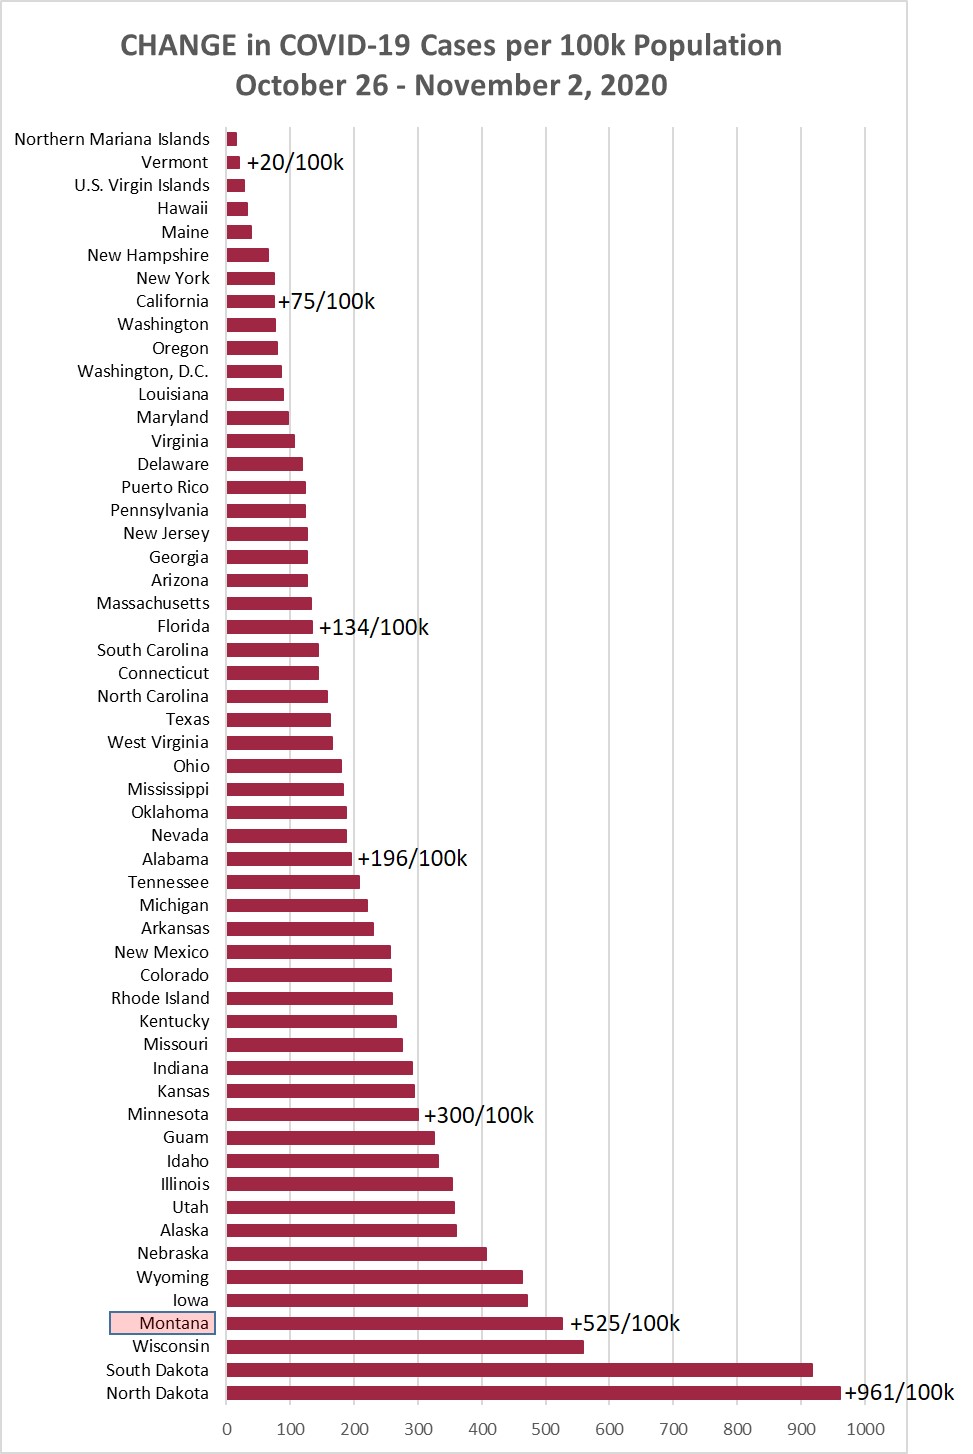
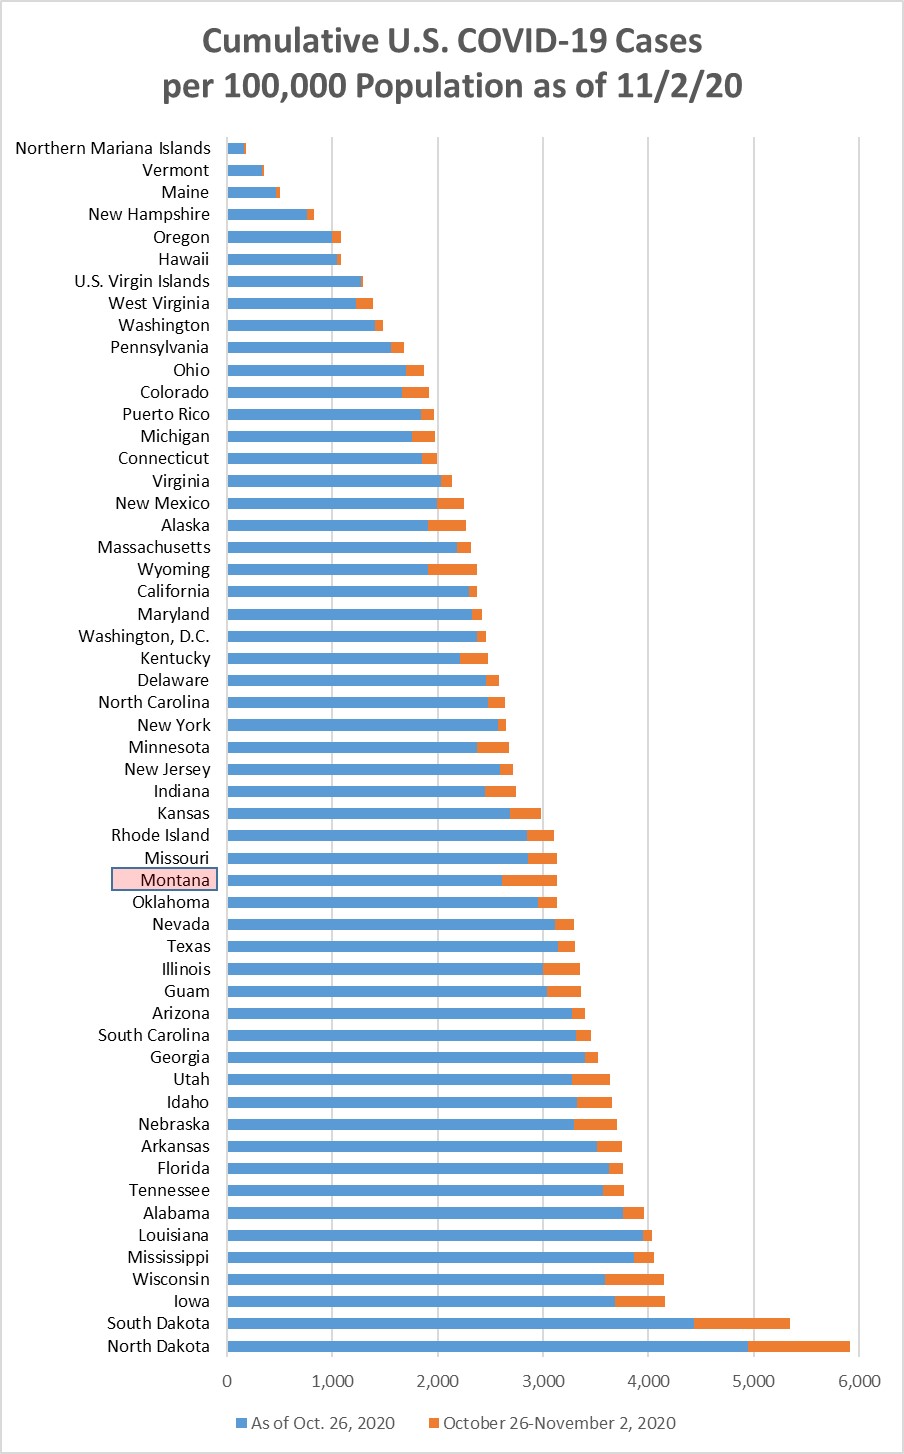
Monday, November 2, 2020
Chart 1 shows the change in cases per 100,000 population as of this morning (November
2) compared to the cases per 100,000 on October 26. Montana jumped another new record
+525/100k this week (4th highest in the country). The highest previous jump in Montana
was the prior week at +474/100k. North and South Dakota increased by +961/100k and
+918/100k, respectively. Not slowing down.
Chart 2 shows the same information as Chart 1, but with the overall cumulative cases
per 100k in each state to November 2. Montana jumped from position 31 to position
34.
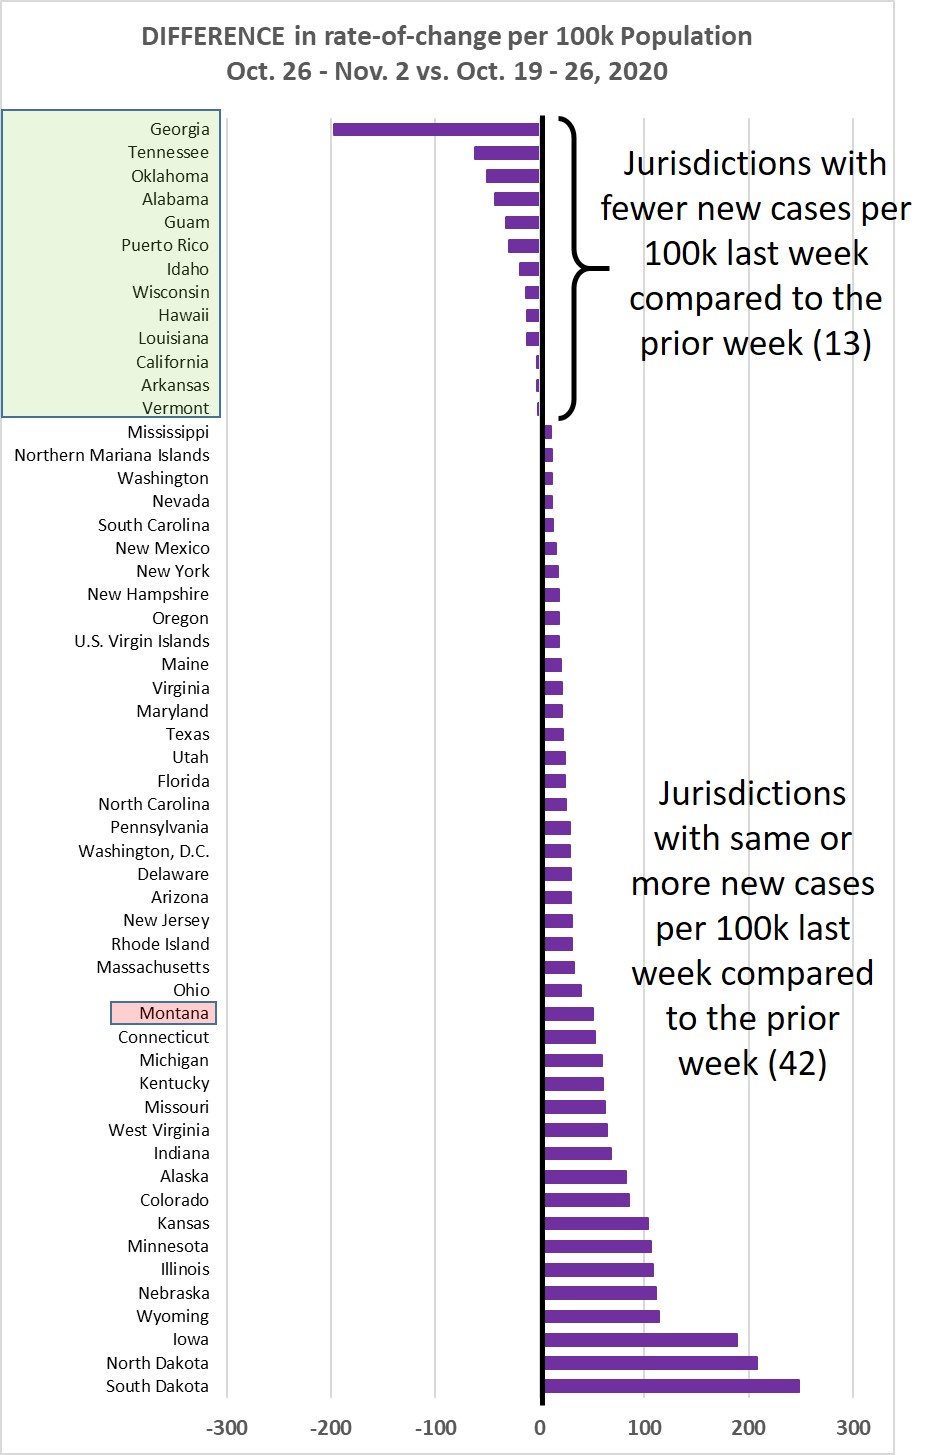
Chart 3 shows the difference in weekly new cases per 100k population for Oct. 26-Nov.
2, vs. Oct. 19-26, 2020. This week, 76% of the jurisdictions showed steady or increasing
rate of cases.
Monday, October 26, 2020
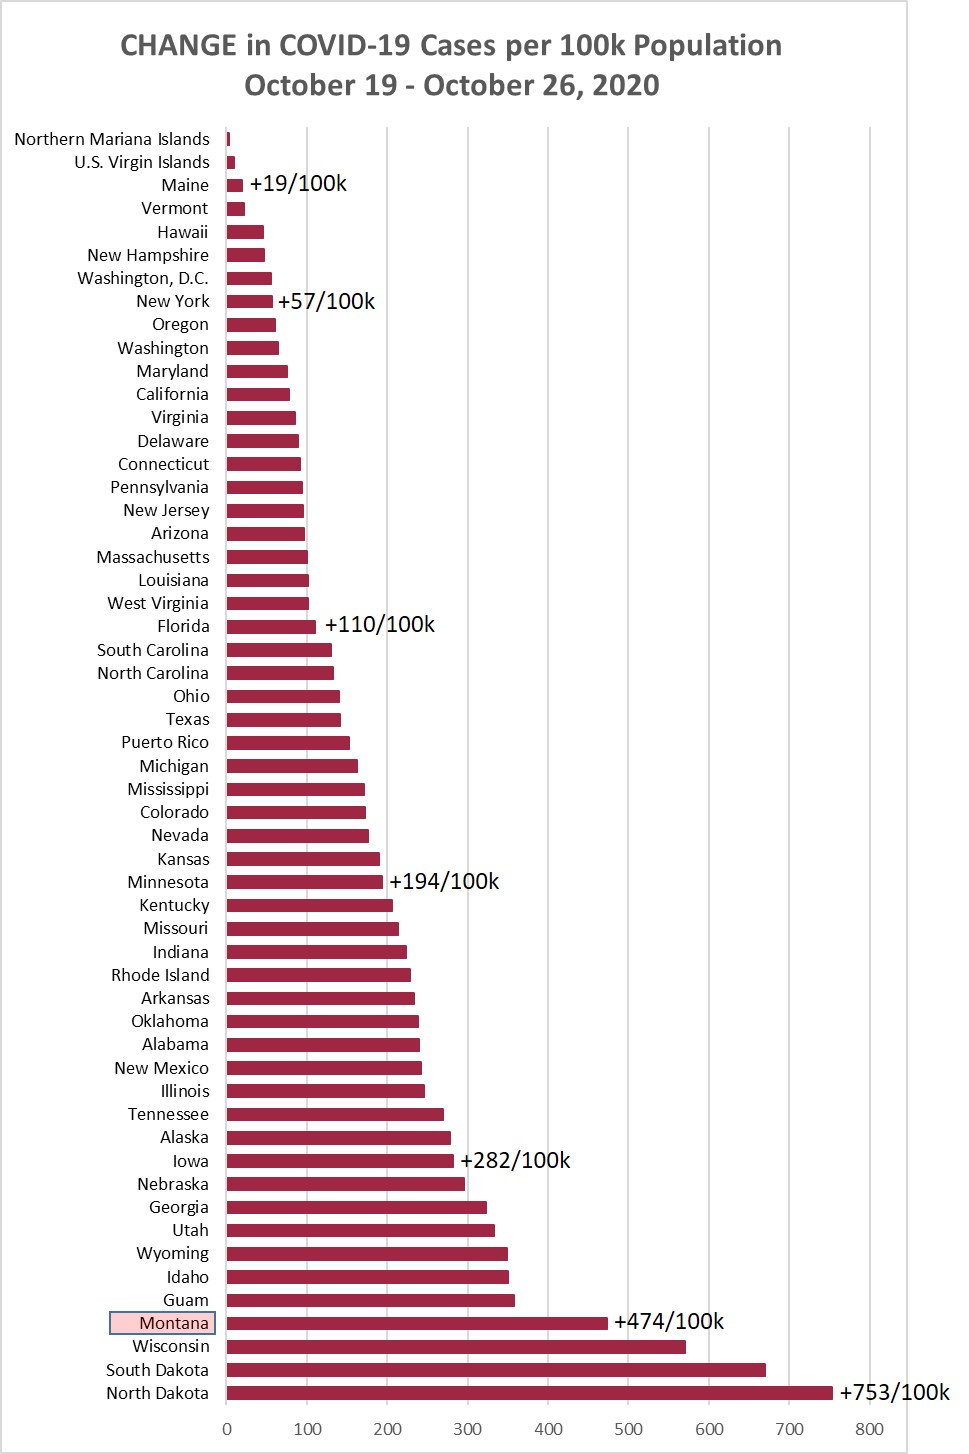
Chart 1 shows the change in cases per 100,000 population as of this morning (October
26) compared to the cases per 100,000 on October 19. Montana jumped another new record
+474/100k this week (4th highest in the country). The highest previous jump in Montana
was the prior week at +382/100k.
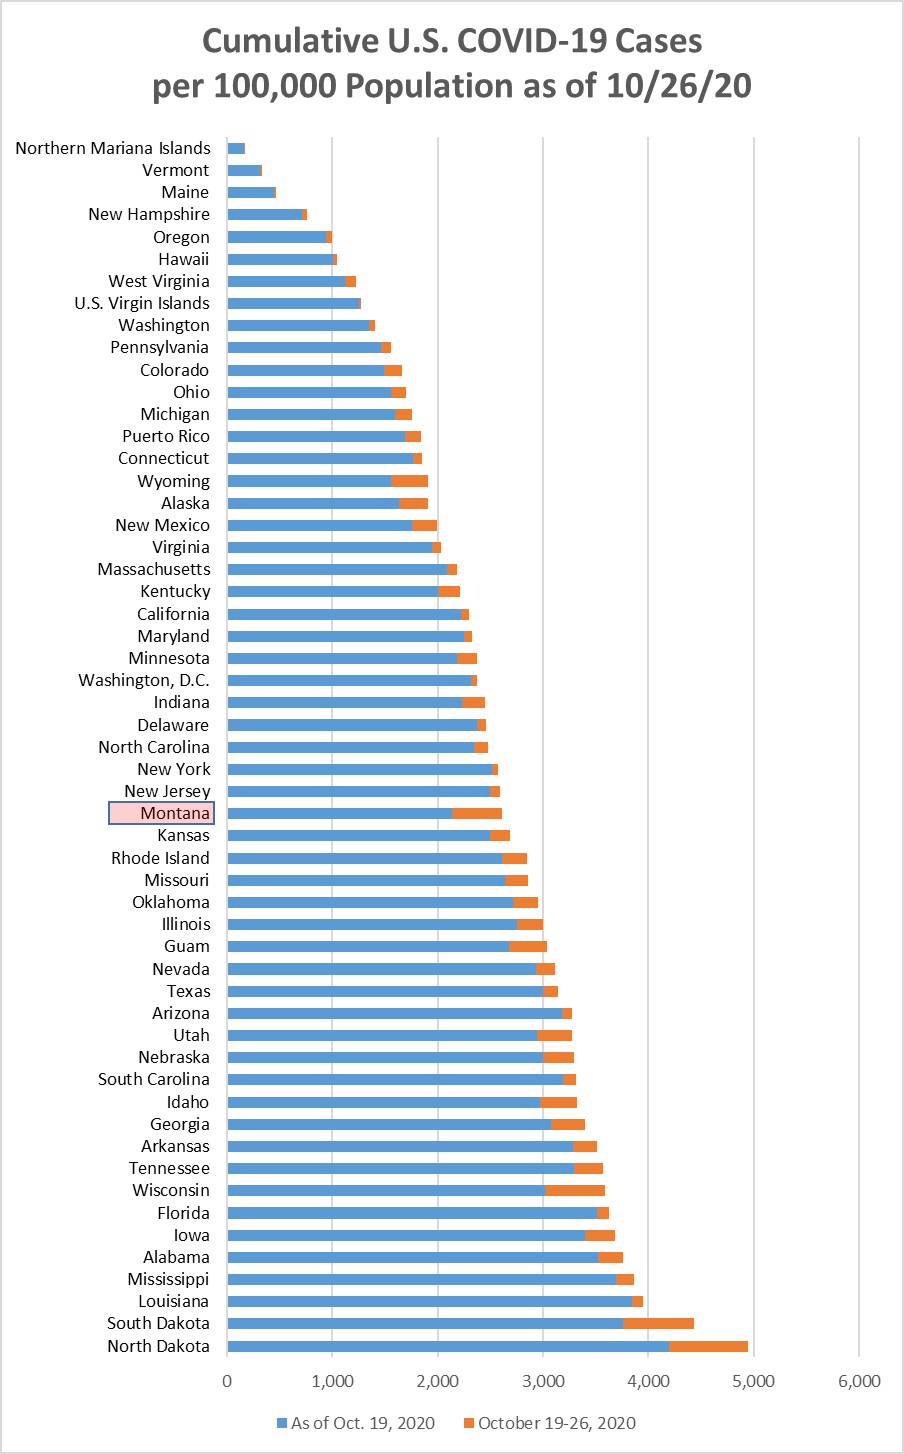
Chart 2 shows the same information as Chart 1, but with the overall cumulative cases
per 100k in each state to October 26. Montana jumped from position 22 to position
31, so now in the top half of cumulative case penetration--this week surpassing even
New York and New Jersey.
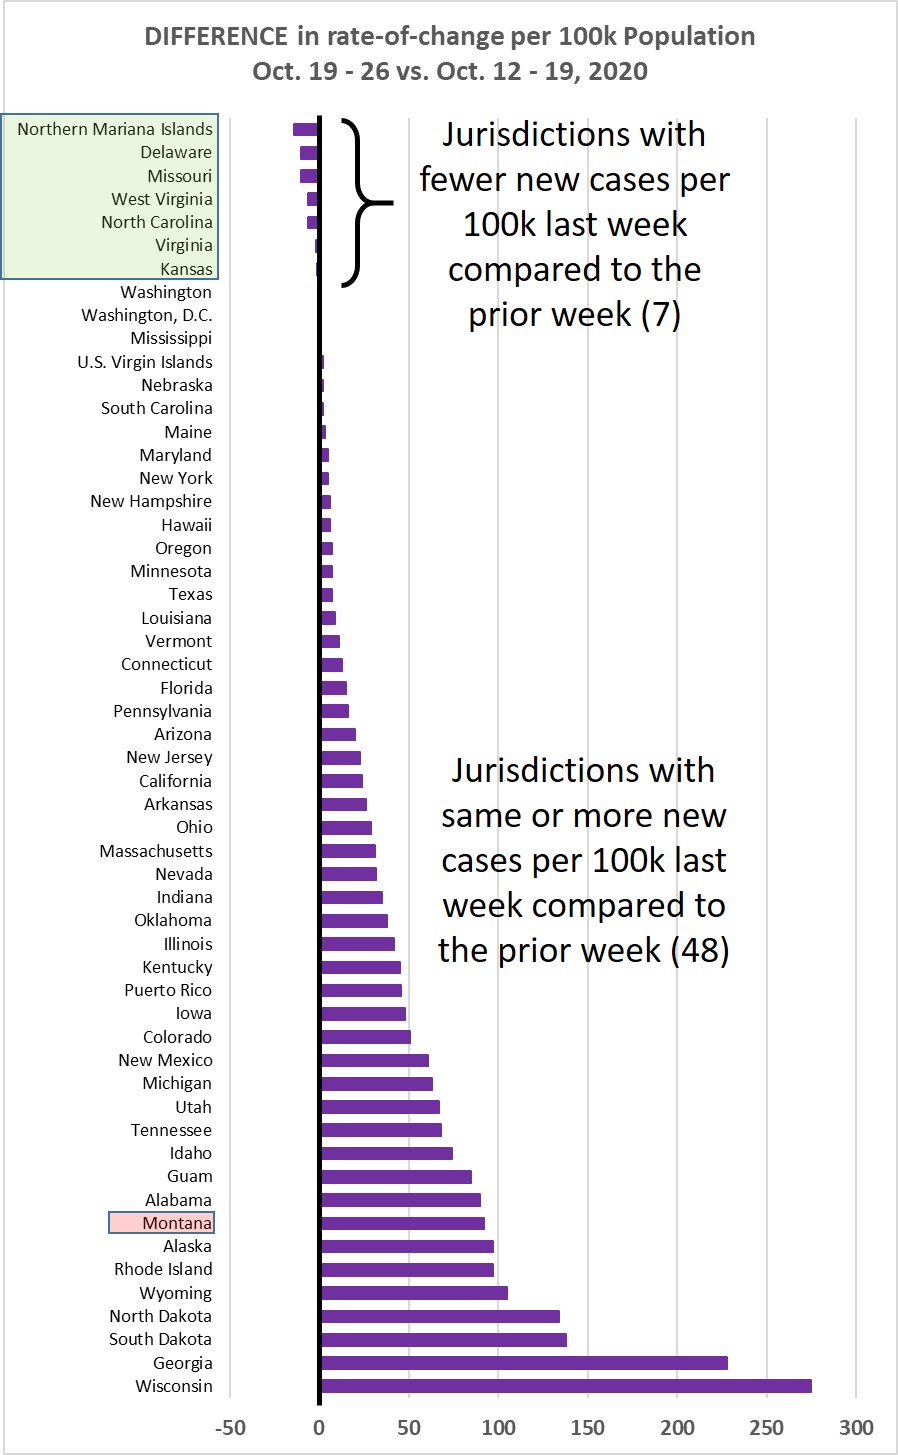
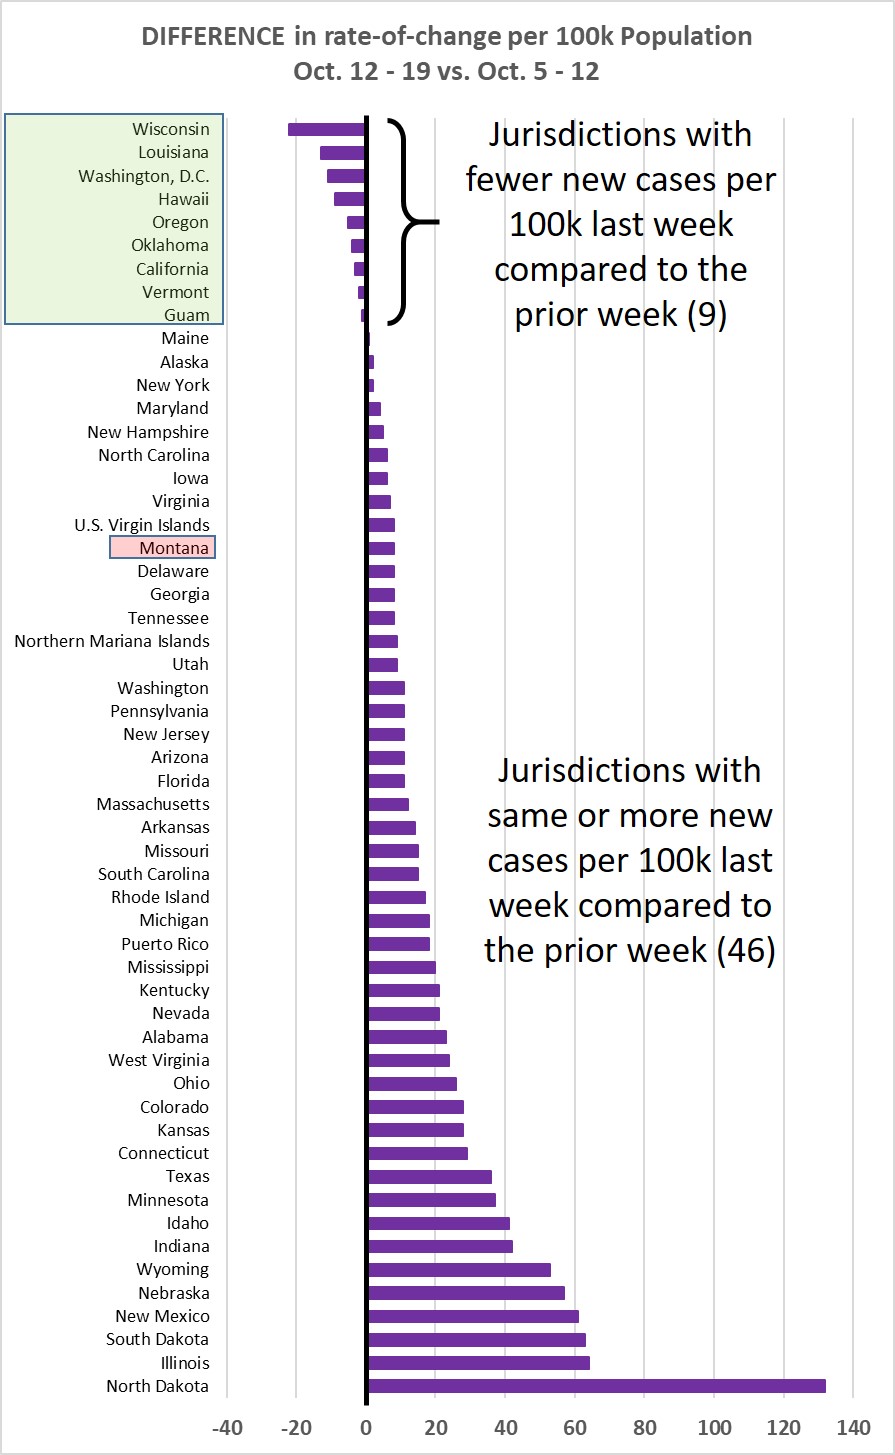
Chart 3 shows the difference in weekly new cases per 100k population for Oct. 19-26,
vs. Oct. 12-19, 2020. This week, 87% of the jurisdictions showed steady or increasing
rate of cases.
Monday, October 19, 2020
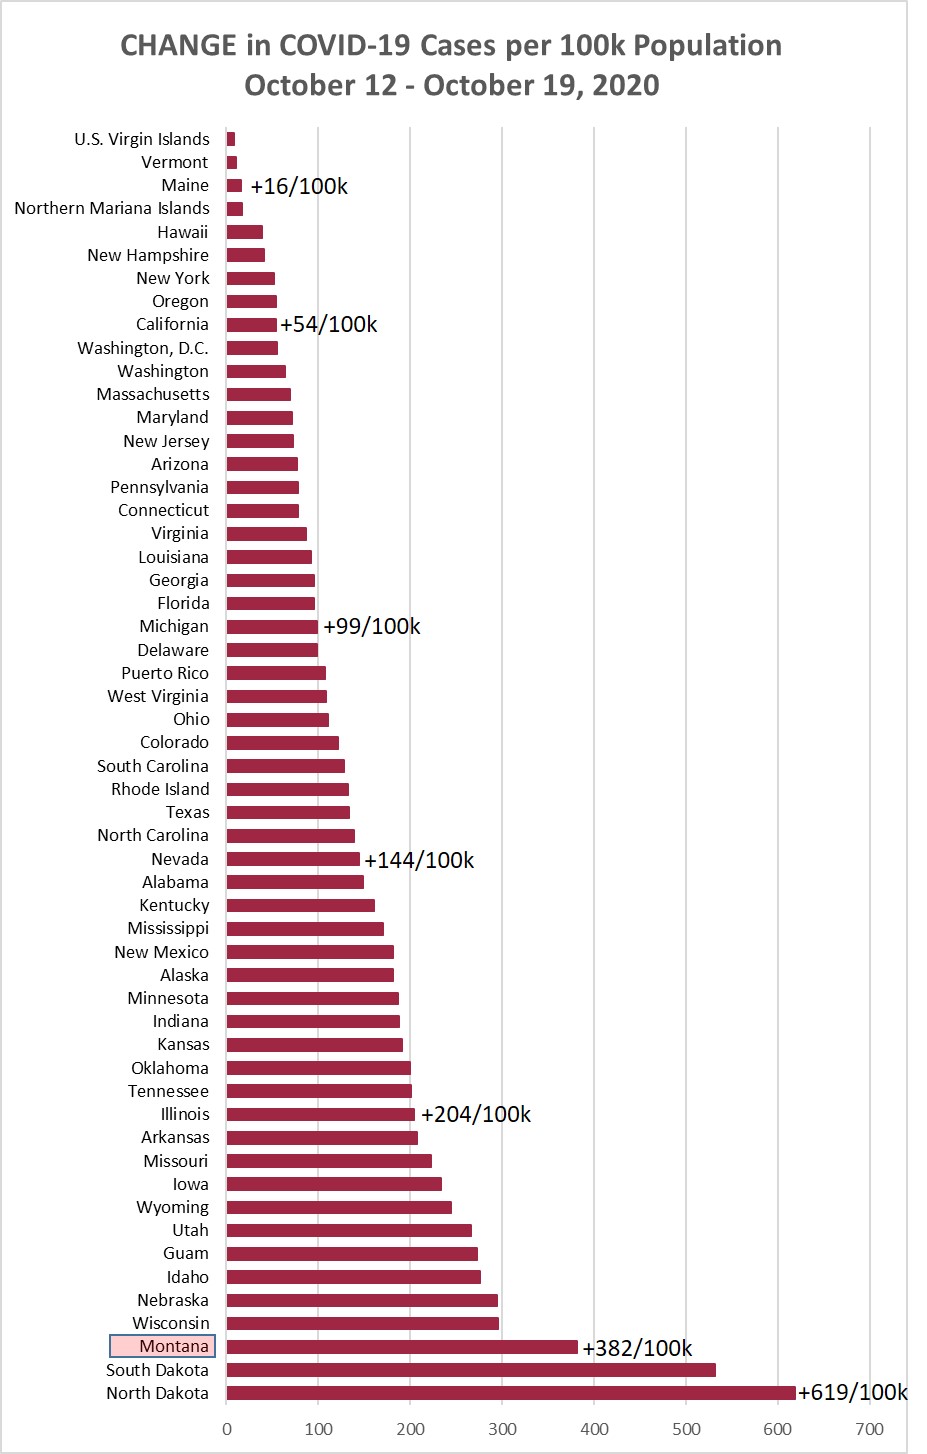
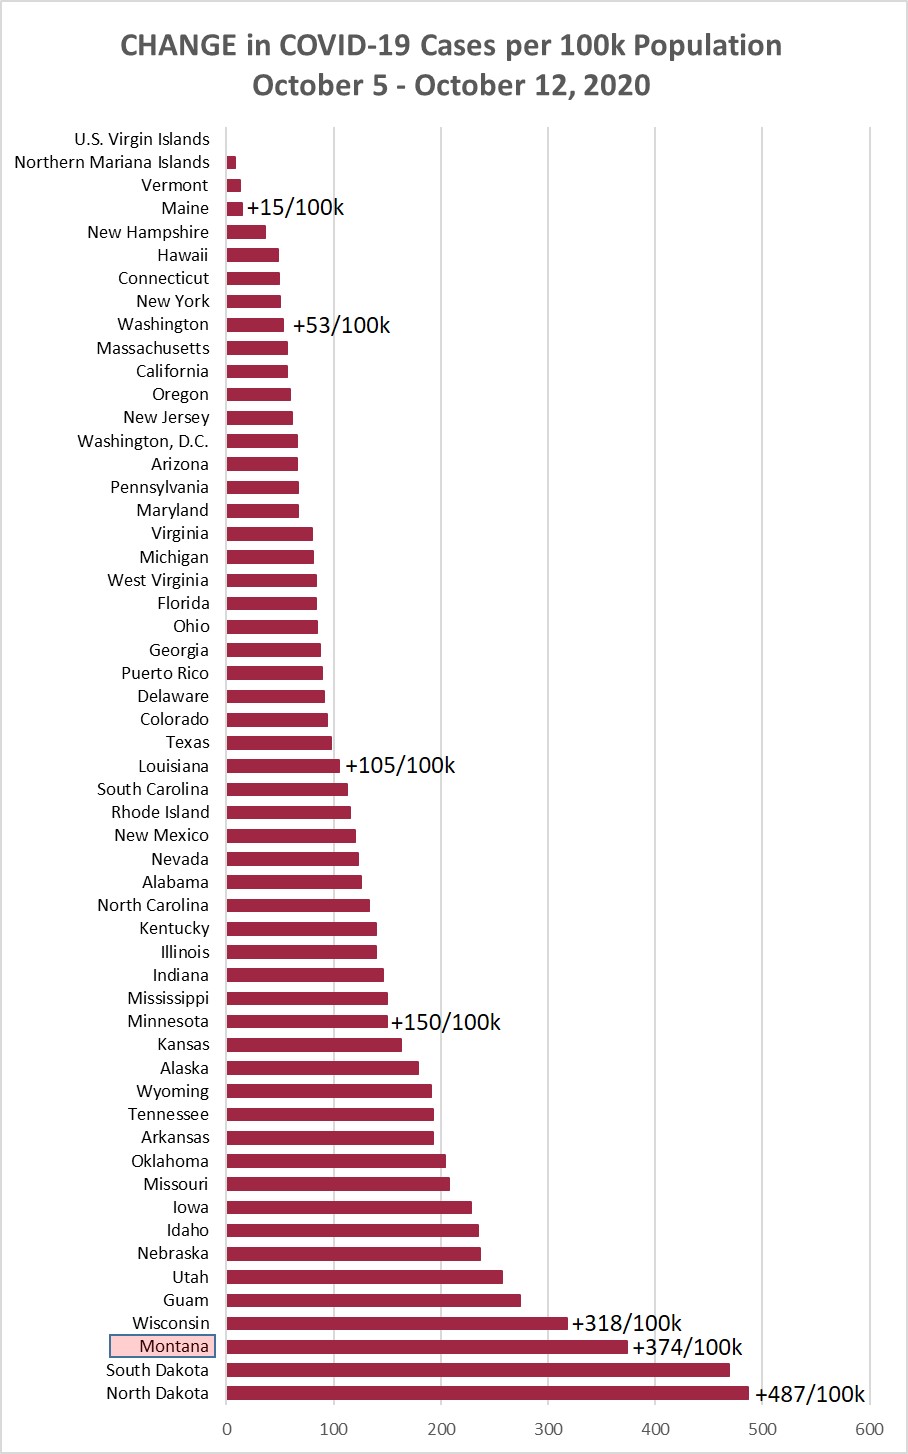
Chart 1 shows the change in cases per 100,000 population as of this morning (October
19) compared to the cases per 100,000 on October 12. Montana jumped another new record
+382/100k this week (again 3rd highest in the country). The highest previous jump
in Montana was the prior week at +374/100k.
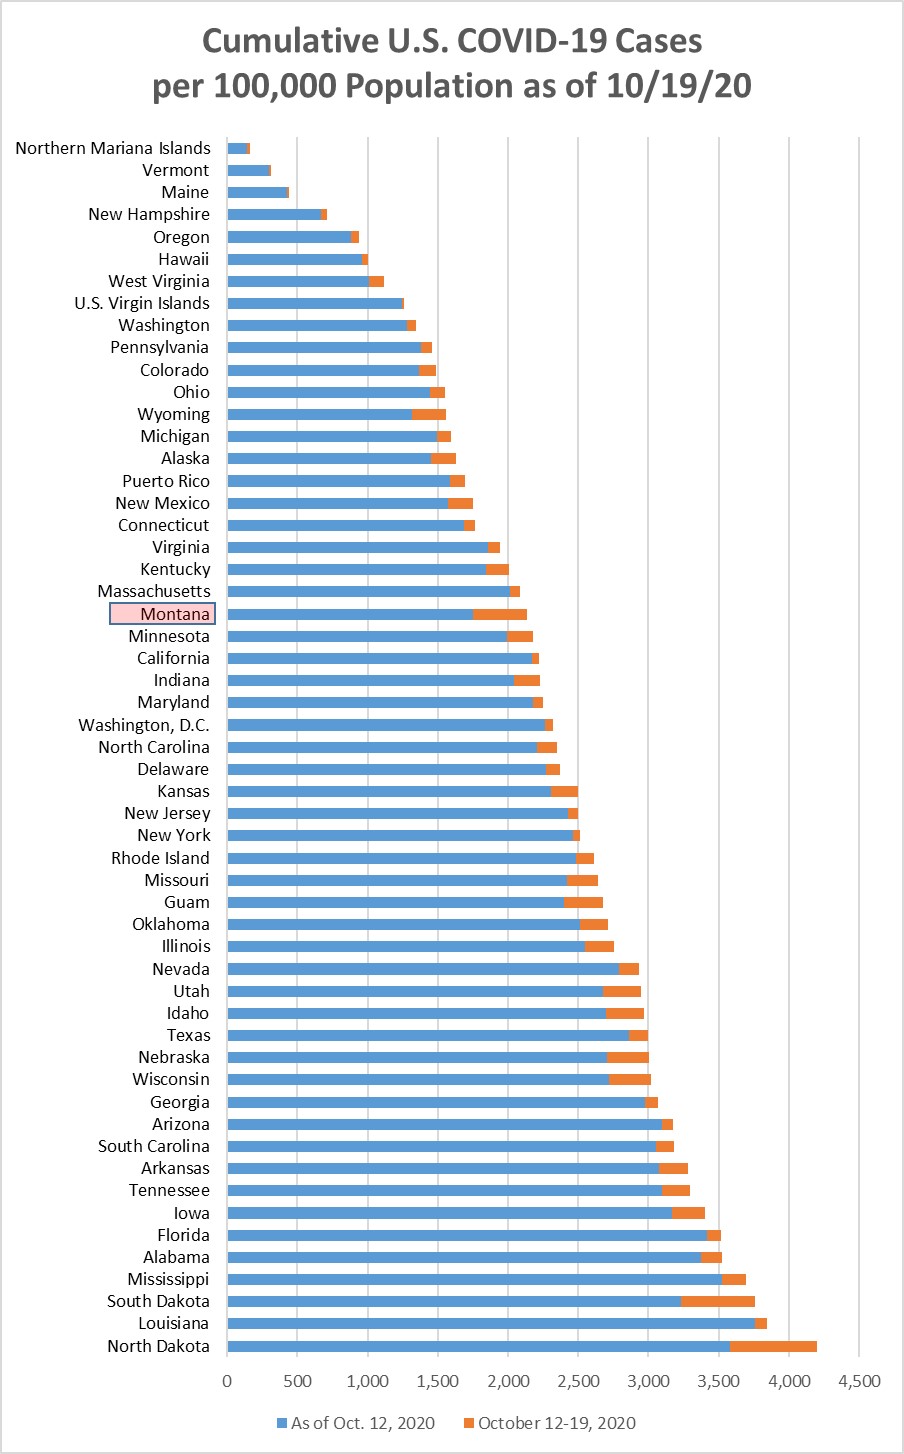
Chart 2 shows the same information as Chart 1, but with the overall cumulative cases
per 100k in each state to October 19. Montana jumped from position 19 to position
22, now passing Virginia, Kentucky, and even Massachusetts.
Chart 3 shows the difference in weekly new cases per 100k population for Oct. 12-19,
vs. Oct. 5-12, 2020. Again this week, 84% of the jurisdictions showed steady or increasing
rate of cases.
Monday, October 12, 2020
Chart 1 shows the change in cases per 100,000 population as of this morning (October
12) compared to the cases per 100,000 on October 5. Montana jumped another new record
+374/100k this week (3rd highest in the country). The highest previous jump in Montana
was the prior week at +244/100k.
Chart 2 shows the same information as Chart 1, but with the overall cumulative cases
per 100k in each state to October 12. Montana was holding position 9 out of 55, but
last week jumped to position 15, and this week Montana is up to position 19. That's
now higher than Connecticut, New Mexico, Michigan, Ohio, Pennsylvania, etc.
Chart 3 shows the difference in weekly new cases per 100k population for Oct. 5-12,
vs. Sept. 28-Oct. 5, 2020. 84% of the jurisdictions this week showed steady or increasing
rate of cases. It would be hard to argue that the virus is disappearing across the
country.
Monday, October 5, 2020
Chart 1 shows the change in cases per 100,000 population as of this morning (October
5) compared to the cases per 100,000 on September 28. Montana jumped another new record
+244/100k this week (4th highest in the country). The highest previous jump in Montana
was the prior week at +169/100k.
Chart 2 shows the same information as Chart 1, but with the overall cumulative cases
per 100k in each state to October 5. Montana was holding position 9 out of 55, but
this week jumped all the way up to position 15, now exceeding states like Alaska,
Colorado, Pennsylvania, and Ohio.
Chart 3 shows the difference in weekly new cases per 100k population for Sept. 28-Oct.
5, vs. Sept. 21-28, 2020. More than 60% of the jurisdictions showed steady or increasing
rate of cases. Sadly, Montana showed the largest overall week-to-week increase per
100k.
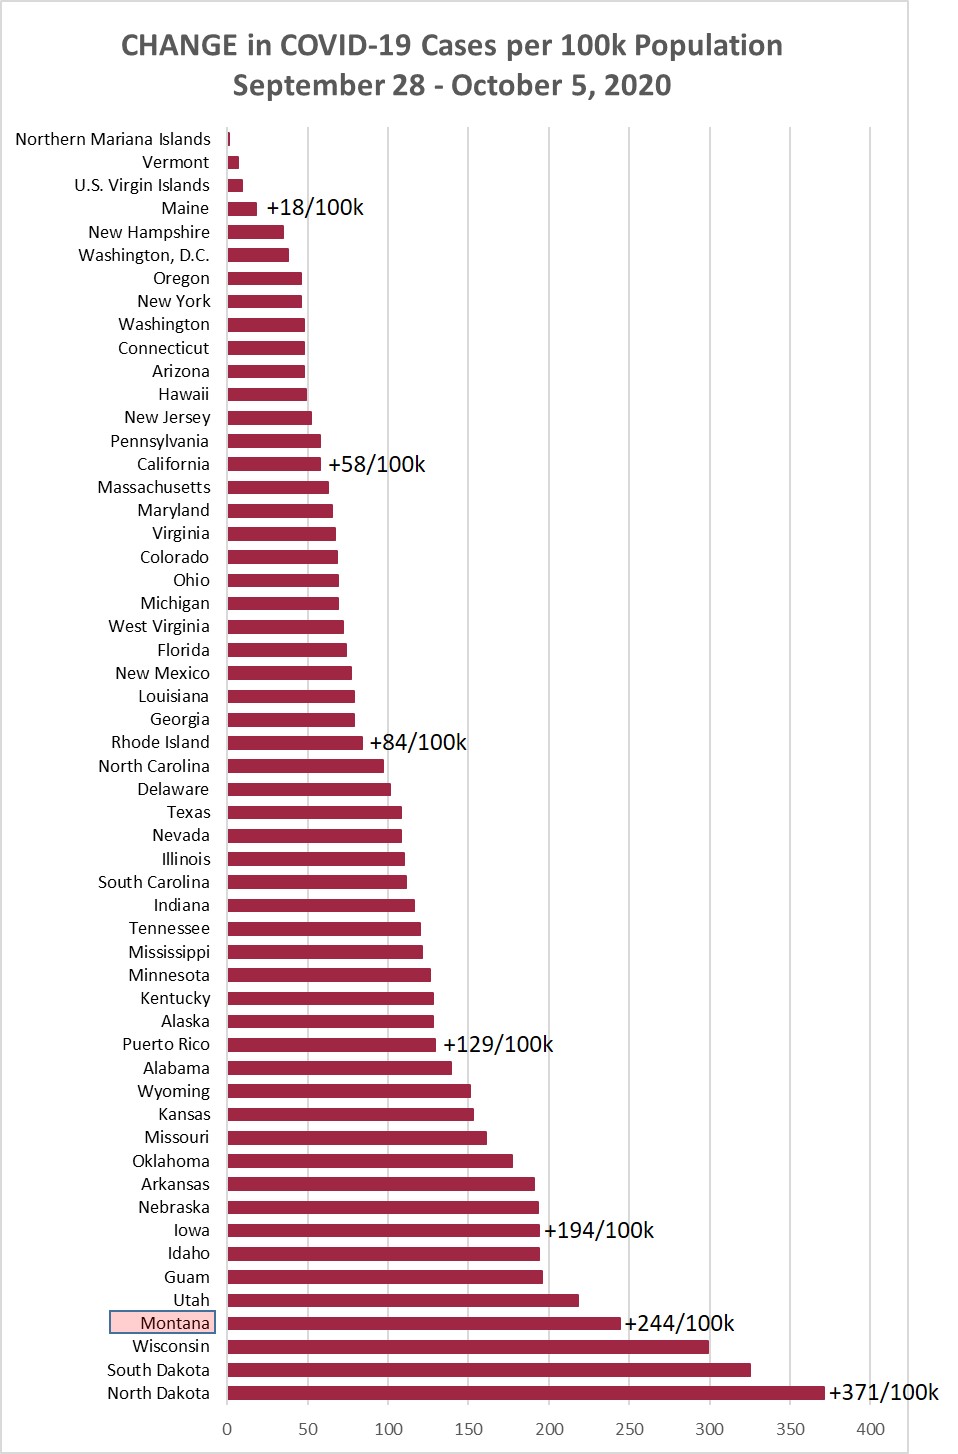
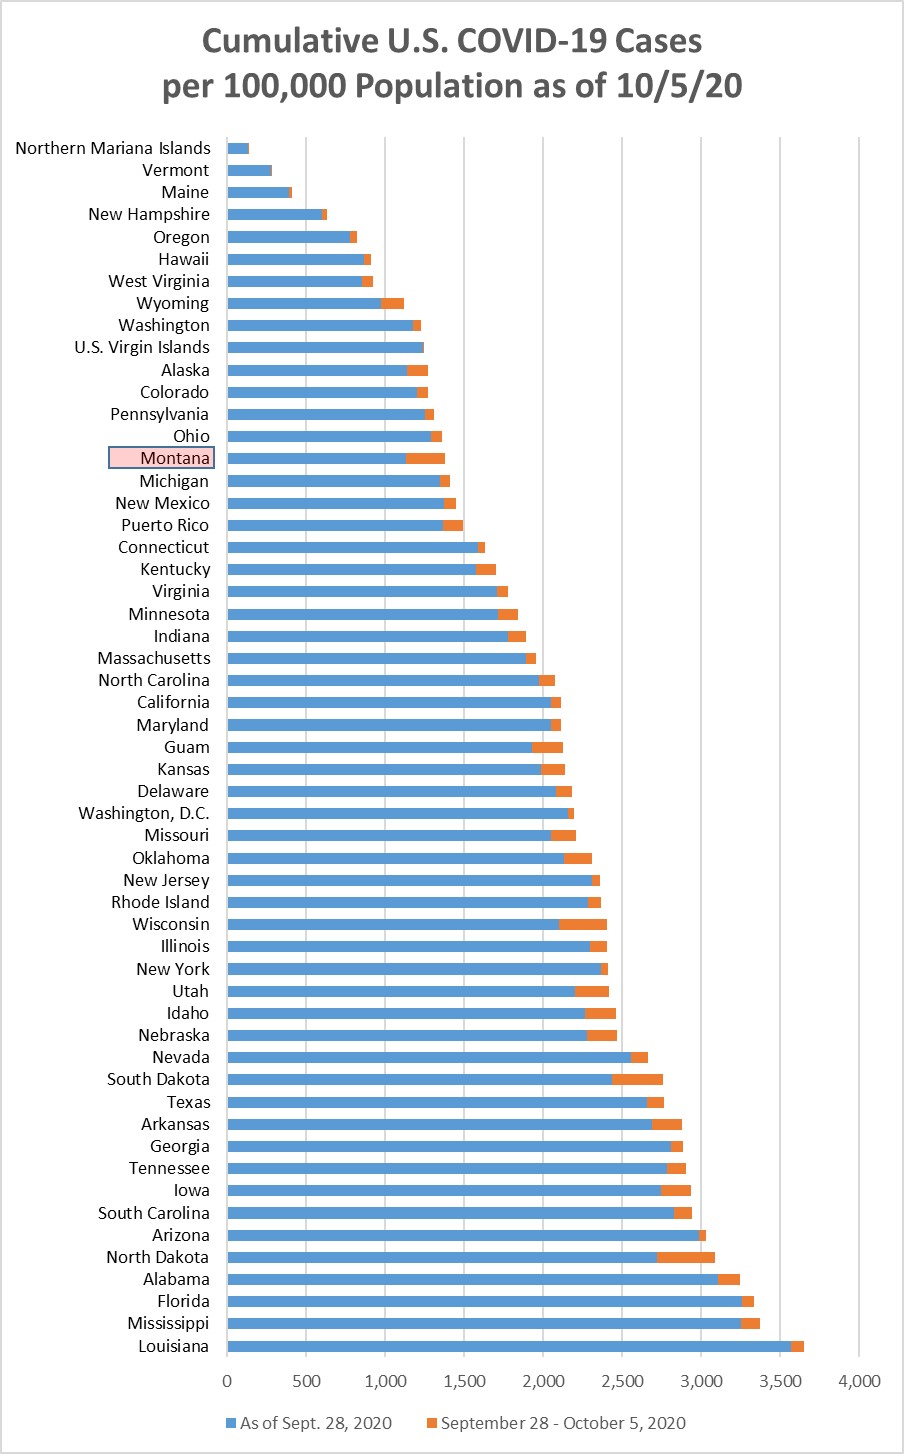
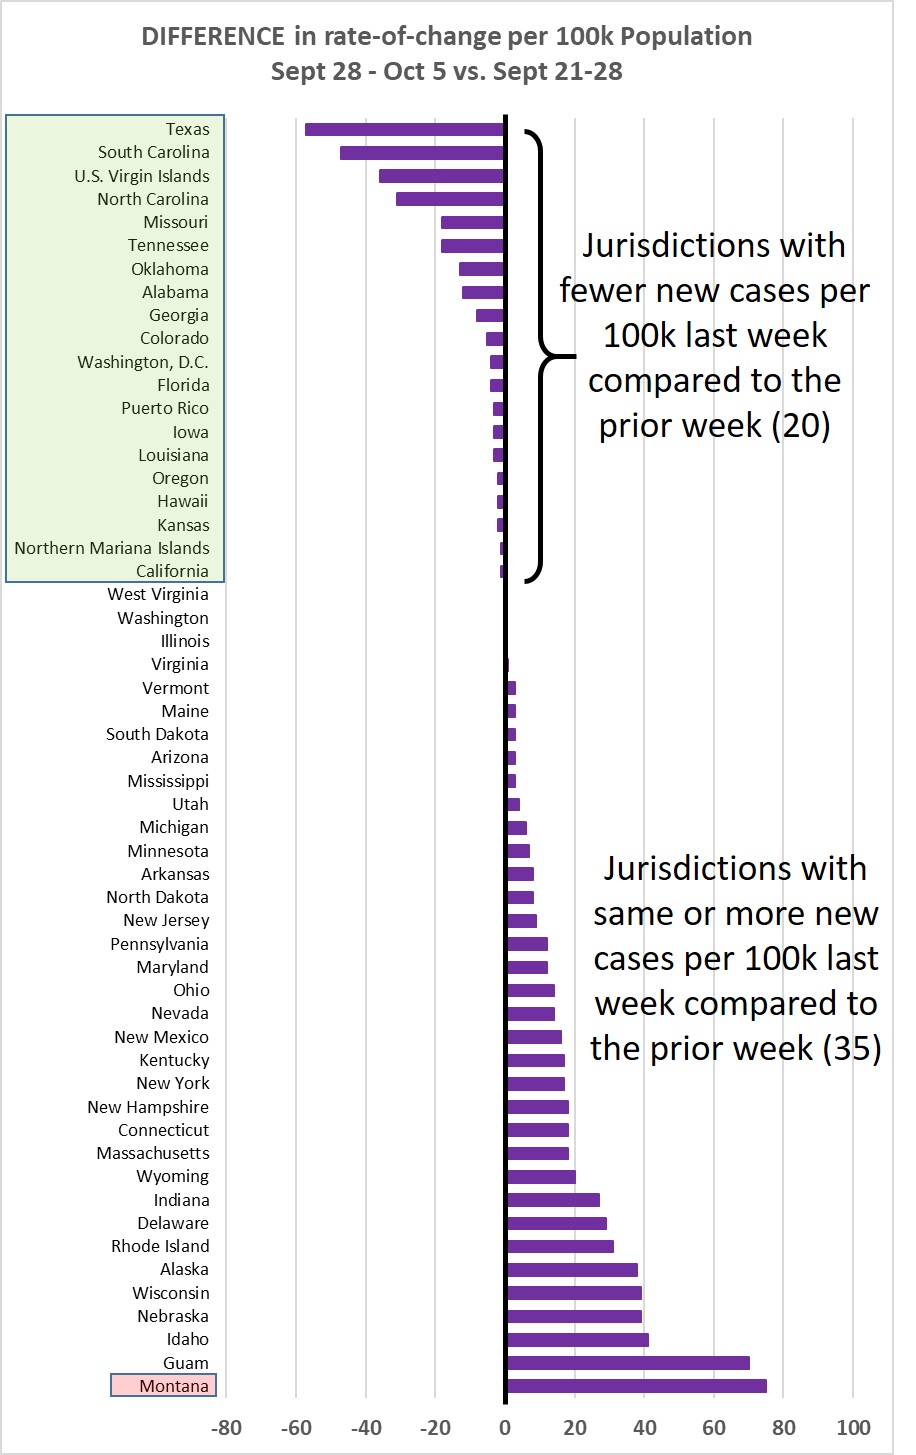
Monday, September 28, 2020
Chart 1 shows the change in cases per 100,000 population as of this morning (September
28) compared to the cases per 100,000 on September 21. Montana jumped a new record
+169/100k this week (9th highest in the country). The highest previous jump in Montana
was the prior week at +120/100k.
Chart 2 shows the same information as Chart 1, but with the overall cumulative cases
per 100k in each state to September 28. Montana crossed the 1% line this week, but
stayed in position 9 out of 55. I think it seems likely Montana will move into position
10 or even 11 this coming week, based upon the recent case trajectories of Montana
and Alaska.
Chart 3 shows the difference in weekly new cases per 100k population for Sept. 21-28,
vs. Sept. 14-21, 2020. More than 60% of the jurisdictions showed a greater rate of
increase in cases.
Monday, September 21, 2020
Chart 1 shows the change in cases per 100,000 population as of this morning (September
21) compared to the cases per 100,000 on September 14. Montana jumped a new record
+120/100k this week. The highest previous jump had been +87.
Chart 2 shows the same information as Chart 1, but with the overall cumulative cases
per 100k in each state to September 21. Montana stayed in position 9 out of 55.
Chart 3 shows the difference in weekly new cases per 100k population for Sept. 14-21,
vs. Sept. 7-14, 2020. After things looked somewhat better the prior week, this past
week more than 80% of the jurisdictions showed a greater rate of increase in cases.
Monday, September 14, 2020
Chart 1 shows the change in cases per 100,000 population as of this morning (September
14) compared to the cases per 100,000 on September 7. Montana ended its recent streak
of record weekly increases, jumping by +72/100k, vs +87/100k the prior week.
Chart 2 shows the same information as Chart 1, but with the overall cumulative cases
per 100k in each state to September 14. Montana stayed in position 9 out of 55. North
Dakota is now in position 38 out of 55: ND had been in position 19 back at the start
of August.
Chart 3 shows the difference in weekly new cases per 100k population for Sept. 7-14,
vs. Aug 31-Sept 7, 2020. About 2/3 of the jurisdictions showed a slowing rate of increasing
cases this week.
Monday, September 7, 2020
Chart 1 shows the change in cases per 100,000 population as of this morning (September
7) compared to the cases per 100,000 on August 31. Montana showed another record weekly
increase, jumping by +87/100k.
The Dakotas and Iowa continued to have increasing cases, but South Dakota and Iowa
at least had a lower rate of increase.
Chart 2 shows the same information as Chart 1, but with the overall cumulative cases
per 100k in each state to September 7. Montana stayed in position 9 out of 55.
Chart 3 shows the difference in weekly new cases per 100k population for Aug 31-Sept
7, vs. Aug 24-31, 2020. About equal number of jurisdictions showing decreasing and
increasing rates.
*NOTE that the data for Massachusetts is anomalous this week: there was some sort
of downward adjustment in the NYT data of cumulative case rates for that state, so
I inserted a nominal rate.
Monday, August 31, 2020
Chart 1 shows the change in cases per 100,000 population as of this morning (August
31) compared to the cases per 100,000 on August 24. Montana showed its biggest weekly
increase since the pandemic started, jumping by +84/100k.
Iowa (+258/100k) had a big jump in cases, as did the Dakotas.
Chart 2 shows the same information as Chart 1, but with the overall cumulative cases
per 100k in each state to August 31. Montana moved up to position 9 out of 55, now
exceeding Wyoming in total case penetration.
Chart 3 shows the difference in weekly new cases per 100k population for Aug 24-31,
vs. Aug. 17-24, 2020. The majority of jurisdictions (31/55) showed more new cases
this past week compared to the prior week. Not what I had expected.
Monday, August 24, 2020
Chart 1 shows the change in cases per 100,000 population as of this morning (August
24) compared to the cases per 100,000 on August 17.
Chart 2 shows the same information as Chart 1, but with the overall cumulative cases
per 100k in each state to August 24. Montana moved from position 7 to position 8 out
of 55, now exceeding Oregon in total case penetration.
Chart 3 shows the difference in weekly new cases per 100k population for Aug. 17-24,
vs. Aug. 10-17, 2020. The majority of jurisdictions (36/55) showed fewer new cases
this past week compared to the prior week.
Monday, August 17, 2020
Chart 1 shows the change in cases per 100,000 population as of this morning (August
17) compared to the cases per 100,000 on August 10.
Chart 2 shows the same information as Chart 1, but with the overall cumulative cases
per 100k in each state to August 17. Montana moved from position 6 to position 7 out
of 55.
Chart 3 shows the difference in weekly new cases per 100k population for Aug. 10-17,
vs Aug. 3-10, 2020. The majority of jurisdictions (30/55) showed fewer new cases this
past week compared to the prior week, but the previous week there were 36/55 showing
a decreasing trend.
Monday, August 10, 2020
Chart 1 shows the change in cases per 100,000 population as of this morning (August
10) compared to the cases per 100,000 on August 3.
Chart 2 shows the same information as Chart 1, but with the overall cumulative cases
per 100k in each state to August 10. Montana is still in position 6 out of 55. This
week Mississippi moved ahead of New York, joining Florida, Arizona, and Louisiana
at the top penetration overall.
Chart 3 shows the difference in weekly new cases per 100k population for Aug. 3-10,
vs July 27-Aug. 3, 2020. The majority of jurisdictions (36/55) showed fewer new cases
this past week compared to the prior week, meaning that while the cases are still
increasing everywhere, they are not increasing as fast. This continues to be a hopeful
sign.
Monday, August 3, 2020
Chart 1 shows the change in cases per 100,000 population as of this morning (August
3) compared to the cases per 100,000 on July 27.
Chart 2 shows the same information as Chart 1, but with the overall cumulative cases
per 100k in each state to August 3. Montana has now moved ahead of West Virginia.
This week Florida moved ahead of New York, joining Louisiana and Arizona overall.
Chart 3 shows the difference in weekly new cases per 100k population for July 27-Aug.
3, 2020, vs. July 20-27. The majority of jurisdictions (44/55) showed fewer new cases
this past week compared to the prior week, meaning that while the cases are still
increasing everywhere, they are not increasing as fast. This is a hopeful sign.
Montana is still among the lowest in cumulative cases per 100k, and was among those
showing a slightly lower rate of new cases this week compared to the prior week. Hope
these trends continue.
Monday, July 27, 2020
Chart 1 shows the change in cases per 100,000 population as of this morning (July
27) compared to the cases per 100,000 on July 20.
Chart 2 shows the same information as Chart 1, but with the overall cumulative cases
per 100k in each state to July 27. Montana has now moved ahead of Hawaii, Vermont,
and Maine. This week both Louisiana AND Arizona have moved ahead of New York overall.
Chart 3 shows the difference in weekly new cases per 100k population for July 20-27,
2020, vs. July 13-20. There continue to be many more jurisdictions (44 out of 55)
with the same or INCREASING rate of new cases compared to the prior week.
Montana is still among the lowest in cumulative cases per 100k. Louisiana, Mississippi,
etc., are a concern because of the large number of cases and the week-to-week acceleration.
Monday, July 20, 2020
Chart 1 shows the change in cases per 100,000 population as of this morning (July
20) compared to the cases per 100,000 on July 13.
Chart 2 shows the same information as Chart 1, but with the overall cumulative cases
per 100k in each state to July 20. Montana has now moved ahead of Hawaii and Vermont.
Chart 3 shows the difference in weekly new cases per 100k population for July 13-20,
2020 vs. July 6-13. There continue to be many more jurisdictions (47 out of 55) with
the same or INCREASING rate of new cases compared to the prior week.
Montana is still among the lowest in cumulative cases per 100k, but has gone from
around 55th to 30th in week-to-week increase.
Monday, July 13, 2020
Chart 1 shows the change in cases per 100,000 population as of this morning (July
13) compared to the cases per 100,000 on July 6.
Chart 2 shows the same information as Chart 1, but with the overall cumulative cases
per 100k in each state to July 13.
Chart 3 shows the difference in weekly new cases per 100k population for July 6-13,
2020 vs. June 29-July 6. There continue to be many more jurisdictions (48 out of 55)
with the same or INCREASING rate of new cases compared to the prior week.
Montana is still among the lowest in cumulative cases per 100k, but is now up to 21st
in week-to-week increase.
Monday, July 6, 2020
Chart 1 shows the change in cases per 100,000 population as of this morning (July
6) compared to the cases per 100,000 on June 29.
Chart 2 shows the same information as Chart 1, but with the overall cumulative cases
per 100k in each state to July 6.
Chart 3 shows the difference in weekly new cases per 100k population for June 29-July
6, 2020 vs. June 22-29. There continue to be many more jurisdictions (45 out of 55)
with the same or INCREASING rate of new cases compared to the prior week.
Connecticut and New Hampshire have shown a declining rate 3 weeks in a row.
There are 21 jurisdictions out of 55 that have shown an INCREASING rate of new cases
3 weeks in a row.
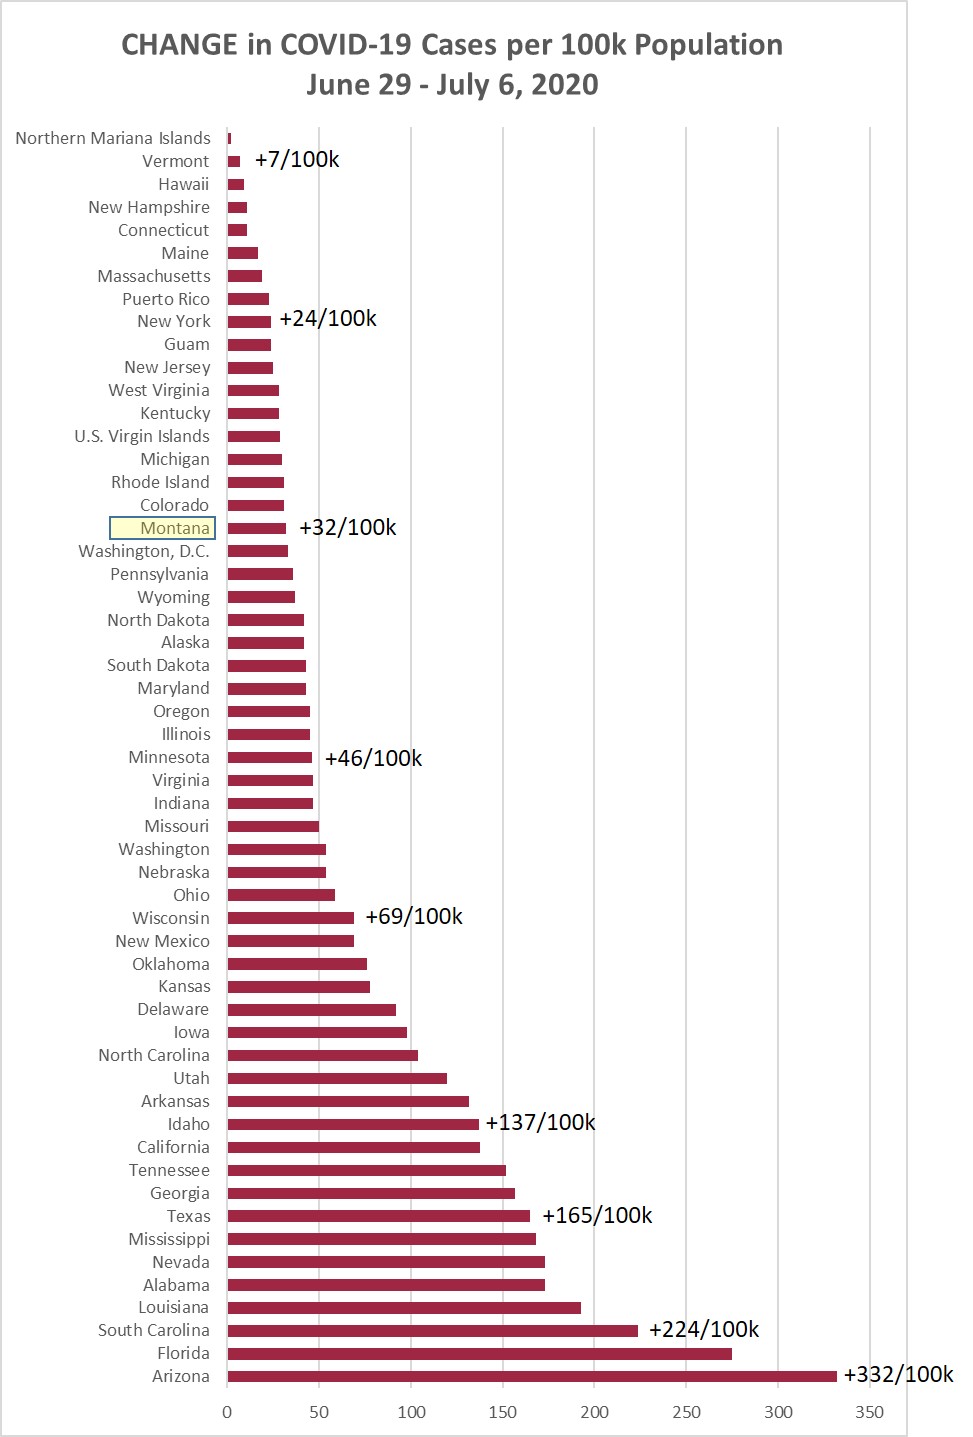
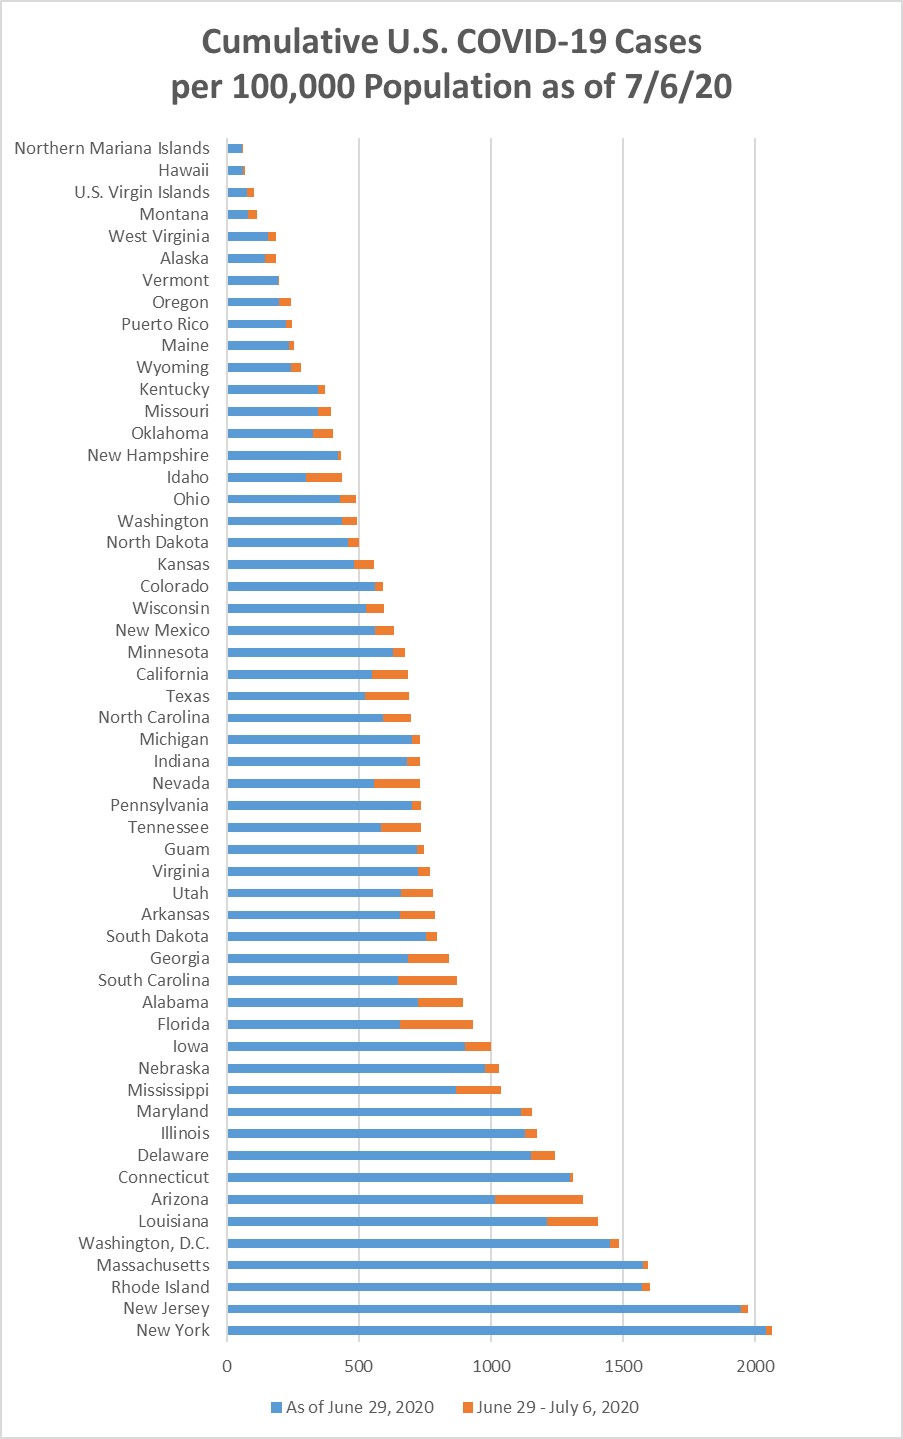
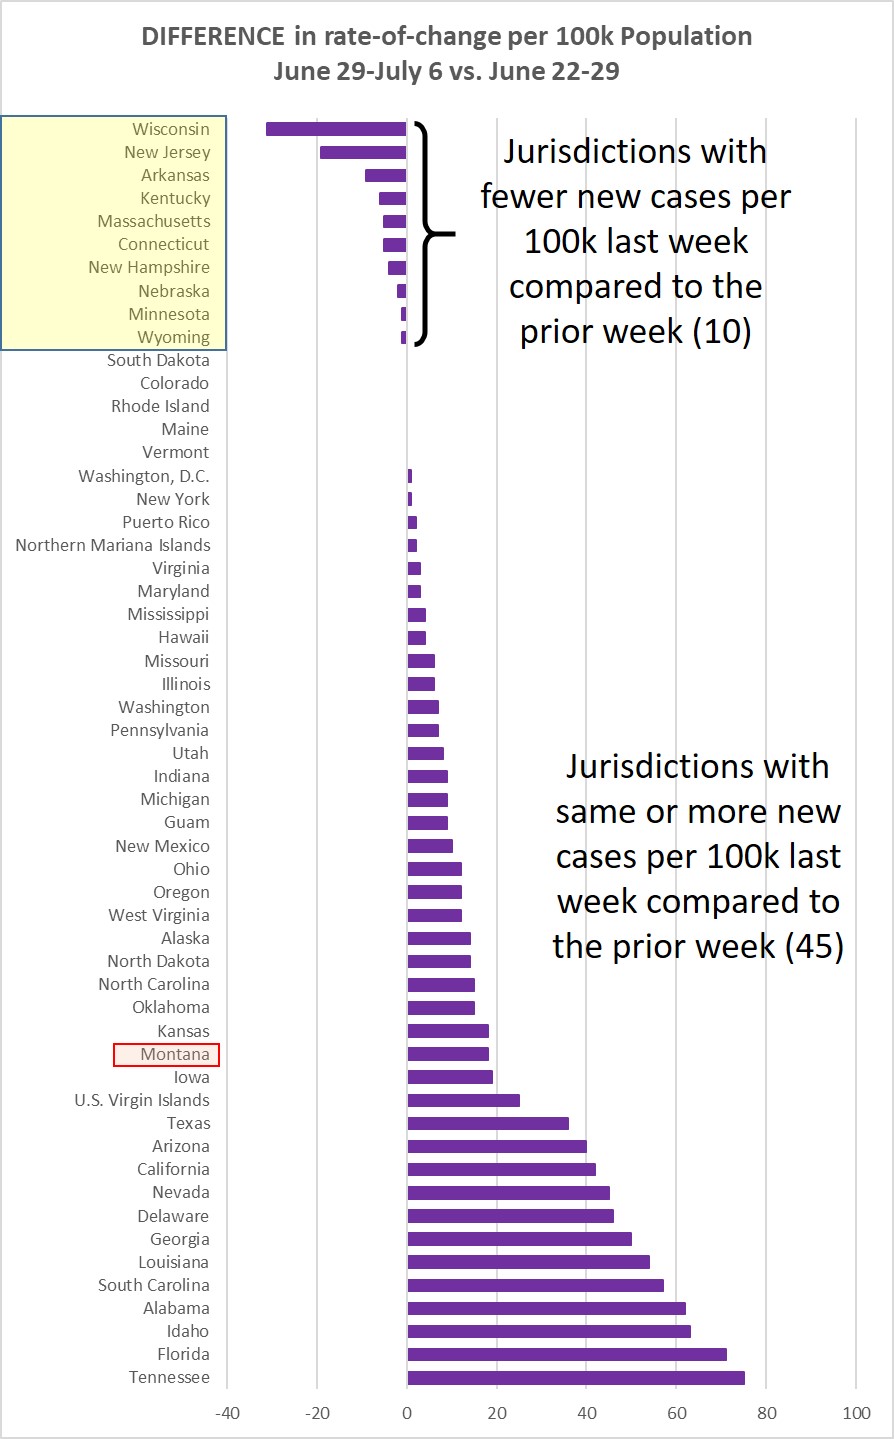
Monday, June 29, 2020
Chart 1 shows the change in cases per 100,000 population as of this morning (June
29) compared to the cases per 100,000 on June 22.
Chart 2 shows the same information as Chart 1, but with the overall cumulative cases
per 100k in each state to June 29.
Chart 3 shows the difference in weekly new cases per 100k population for June 22-29,
2020 vs. June 15-22. There are now many more jurisdictions (44 out of 55) with the
same or INCREASING rate of new cases compared to the prior week.
There are 8 jurisdictions out of 55 that have shown a DECLINING rate of increase two
weeks in a row: New York, Puerto Rico, South Dakota, Connecticut, New Hampshire, Maryland,
Washington, D.C., and Rhode Island.
There are 25 jurisdictions out of 55 that have shown an INCREASING rate of new cases
two weeks in a row.
Monday, June 22, 2020
Chart 1 shows the change in cases per 100,000 population as of this morning (June
22) compared to the cases per 100,000 on June 15.
Chart 2 shows the same information as Chart 1, but with the overall cumulative cases
per 100k in each state to June 22.
Chart 3 shows the difference in weekly new cases per 100k population for June 15-22,
2020 vs. June 8-15. There are now more jurisdictions (30 out of 55) with an INCREASING
rate of new cases compared to the prior week.
Monday, June 15, 2020
Chart 1 shows the change in cases per 100,000 population as of this morning (June
15 ) compared to the cases per 100,000 on June 8.
Chart 2 shows the same information as Chart 1, but with the overall cumulative cases
per 100k in each state to June 15.
Chart 3 shows the difference in weekly new cases per 100k population for June 8-15,
2020 vs. June 1-8. There are more jurisdictions (34 out of 55) with a decreasing rate
of new cases compared to the prior week.
Monday, June 8, 2020
Chart 1 shows the change in cases per 100,000 population as of this morning (June
8 ) compared to the cases per 100,000 on June 1.
Chart 2 shows the same information as Chart 1, but with the overall cumulative cases
per 100k in each state to June 8.
Chart 3 shows the difference in weekly new cases per 100k population for June 1-8,
2020 vs. May 25-June 1. Unlike last week, this week there are more jurisdictions (32
out of 55) with an increasing rate of cases compared to the prior week.
Monday, June 1, 2020
Chart 1 shows the change in cases per 100,000 population as of this morning (June
1) compared to the cases per 100,000 on May 25.
Chart 2 shows the same information as Chart 1, but with the overall cumulative cases
per 100k in each state.
Chart 3 shows the difference in weekly new cases per 100k population for May 25-June
1 vs. May 18-25. In the majority of states, the number of new cases May 25-June 1
was less than the number of new cases the prior week.
Monday, May 25, 2020
Chart 1 shows the change in cases per 100,000 population as of this morning (May 25)
compared to the cases per 100,000 on May 18.
Chart 2 shows the same information as Chart 1, but with the overall cumulative cases
per 100k in each state. According to the data, New York is approaching 2% of the population
having a positive test at some point.
Chart 3 shows the difference in weekly new cases per 100k population for May 18-25
vs. May 12-18. In the majority of states, the number of new cases May 18-25 was greater
than the number of new cases the prior week.