
Steps of the A3 Process
The following steps will guide you through the A3 Process. To get a more in-depth explanation of the step, click on the step and a popup window will appear with more information. If you're using Internet Explorer and have popups blocked, you will have to unblock them to see the window.
- Step 0: Identify a problem or need
- Step 1: Conduct research to understand the current situaion
- Step 2: Conduct root cause analysis
- Step 3: Devise countermeasures to address root causes
- Step 4: Develop a target state
- Step 5: Create an implementation plan
- Step 6: Develop a follow-up plan with predicted outcomes
The results of steps 0-6 can be recorded on an A3 report. Click here to download an MS Word template of an A3 Report.
- Step 7: Discuss plans with all affected parties
- Step 8: Obtain approval for implementation
- Step 9: Implement plans
- Step 10: Evaluate the results
Note that the A3 process is rooted in the more basic PDCA cycle. Steps 1-8 are the Plan step (with step 5 planning the Do step and step 6 planning the Check step). Step 9 is the Do step, and step 10 is the Check step. Based on the evaluation, another problem may be identified and the A3 process starts again (Act).
Step 0: Identify Problem or Need
Whenever the way work happens is not ideal, or when a goal or objective is not being met, you have a problem (or, if you prefer, a need). The bes problems to work on are those that arise in day-to-day work and prevent you from doing your best.
Example:
Patients in a hospital were not arriving to the diagnostic departments during their allotted time. Because the patients were late, the diagnostic departments were getting backed up. Thus the problem to be addressed was: reducing patient back-ups in the hospital's diagnostic departments due to late arriving patients.
Step 1: Understand Current Situation
Before a problem can be properly addressed, one must have a firm grasp of the current situation. To do this, Toyota suggests that problem-solvers:
- Observe the work processes first hand, and document one’s observations.
- Create a diagram that shows how the work is currently done. Any number of formal process charting or mapping tools can be used, but often simple stick figures and arrows will do the trick.
- Quantify the magnitude of the problem (e.g., % of customer deliveries that are late, # of stock outs in a month, # of errors reported per quarter, % of work time that is value-added); if possible, represent the data graphically.
Example:
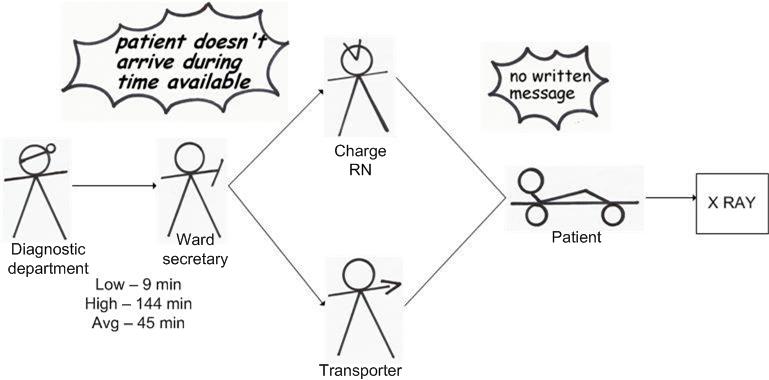
Below is an example of the diagram representing the current condition of patient transport in a hospital, showing how transporters are contacted to transport patients with mobility difficulties to their appointments in the diagnostic departments. The storm bursts call out problems with the current situation. The data indicate the ranges and averages of patient delivery time.
Step 2: Root Cause Analysis
Once you have a good understanding of how the process (i.e., the one that needs to be fixed) currently works, it's time to figure out what the root causes are to the errors or inefficiency. To accomplish this, first make a list of the main problem(s). Next, ask the appropriate "why?" questions until you reach the root cause. A good rule-of-thumb is that you haven't reached the root cause until you've asked "why?" at least five times in series.
Example:
A team trying to improve patient transport processes recognized that the main problem was that patients were not arriving on time for their diagnostic procedures, causing severe back ups in the diagnostic departments. In this case, three causes to patients arriving late were identified by observation, and each was pursued to a root cause, as shown below.
Problem: Backups in diagnostic departments.
Why?:
- Patients arriving late
- Transporter not called on time
- Ward secretaries are busy and often forget
- No written message
- No protocol
- Transport unable to locate patient
- Page does not include patient location (name only)
- No standard protocol for transport paging
- Patient not ready for transport
- Nurses unaware of prescribed test
- No mechanism to inform RN of scheduled procedure
The root cause analysis revealed that patients were arriving late because the hospital had no procedure for notifying appropriate personnel of a transportation need, and that transporters and RN’s were not contacted directly by the requesting department.
Step 3: Countermeasures
Once the current situation is fully understood and the root cause(s) for the main problem(s) has been unveiled, it’s time to devise some countermeasures. Countermeasures are the changes to be made to the work processes that will move the organization closer to ideal, or make the process more efficient, by addressing root causes. Generally speaking, we recommend that countermeasures help the process conform to three “rules” borrowed from Steven Spear and Kent Bowen1 and slightly expanded:
- Specify the outcome, content, sequence, and task of work activities
- Create clear, direct connections between requestors and suppliers of goods and services
- Eliminate loops, workarounds, and delays
Example:
The team investigating delayed transport of patients to diagnostic departments discovered that the root cause was lack of clear protocol for communicating between the diagnostic department, RN of the clinical department, and the transporter. To fix this problem, they came up with some countermeasures that included:
- A new protocol where the diagnostic department pages the charge RN and the transporter at the same time (thus eliminating the ward secretary as an intermediary)
- Specified information content of pages
- New patient preparation procedures involving both the RN (or technician designated by the RN) and the transporter
1 See: S.J. Spear and H.K. Bowen, “The DNA of the Toyota Production System,” Harvard Business Review, Sep-Oct 1999.
Step 4: Develop the Target State
The countermeasure(s) addressing the root cause(s) of the problem will lead to new ways of getting the work done, what we call the target condition or target state. It describes how the work will get done with the proposed countermeasures in place. In the A3 report, the target condition should be a diagram (similar to the current condition) that illustrates how the new proposed process will work. The specific countermeasures should be noted or listed, and the expected improvement should be predicted specifically and quantitatively.
Example:
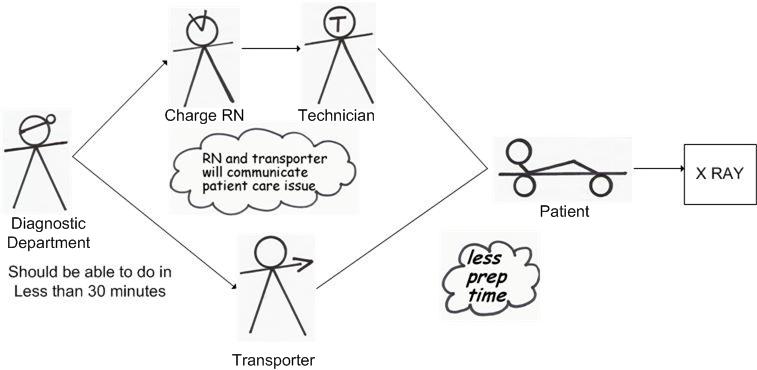
A target condition for a revamped patient transportation process is depicted below.
Step 5: Implementation Plan
In order to reach the target state, one needs a well thought-out and workable implementation plan. The implementation plan should include a list of the actions that need to be done to get the countermeasures in place and realize the target condition, along with the individual responsible for each task and a due date. Other relevant items, such as cost, may also be added.
Example:
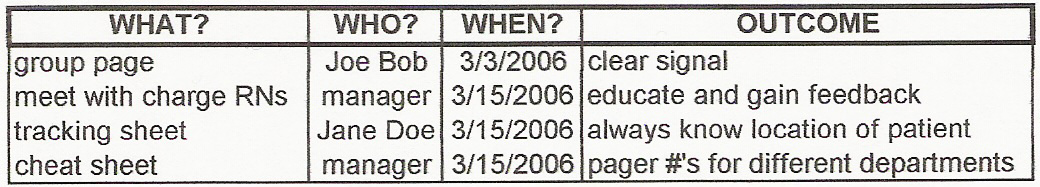
An example of a simple implementation plan is below. Note that the task, the person responsible, deadlines and the outcome of the tasks are all specified.
Step 6: Follow-up Plan
A critical step in the learning process of problem-solvers is to verify whether they truly understood the current condition well enough to improve it. Therefore, a follow-up plan becomes a critical step in process improvement to make sure the implementation plan was executed, the target condition realized, and the expected results achieved. You can state the predicted outcome here rather than in the target condition, if you prefer.
Example:
The manager of transportation, and head of the A3 process team, set the goal for patient transport time at 30 minutes, maximum. Once a month, for three months after the initial implementation, he would measure a sample of transportation pages, and calculate the average time from transportation page to patient arrival at the diagnostic department.
Step 7: Discuss With All Affected Parties
It’s VITALLY important to communicate with all parties affected by the implementation or target condition, and try to build consensus throughout the process. We have included it as a specific step before approval and implementation to make sure it does not get skipped. But the most successful process improvement projects we have witnessed do this step at each critical juncture. Concerns raised should be addressed insomuch as possible, and this may involve studying the problem further or reworking the countermeasures, target condition, or implementation plan. The goal is to have everyone affected by the change aware of it and, ideally, in agreement that the organization is best served by the change.
Example:
To make sure that all affected parties were involved in the process improvement effort, the manager of the transportation first gathered a cross-functional team together to study the problem and come up with countermeasures. Then, once the countermeasures and target condition were created, he communicated with key representatives of the participating departments to a) solicit their agreement, and b) plan the education and training in the new systems. In this case, only minor adjustments to the proposed changes were needed. The implementation plan then reflected the outcomes of those meetings.
Step 8: Get Approval
If the person conducting the A3 process is not a manager, it’s imperative to remember the importance of obtaining approval from an authority figure to carry out the proposed plan. The authority figure should verify that the problem has been sufficiently studied and that all affected parties are “on board” with the proposal. The authority figure may then approve the change and allow implementation.
Example:
The manager of the transportation department was in a position to approve changes to procedures of the transporters, but he had to obtain approval for his changes and implementation from the managers of all of the affected departments. Ideally, his manager would have “approved” the change in order to provide a mentoring opportunity, but this did not happen in this case.
Step 9: Implementation
Without implantation, no change occurs. The next step is to execute the implementation plan.
Example:
The A3 process team had a meeting, charted their specific actions/tasks and deadlines in their implementation plan. once the proper approvals were given, they executed their designated tasks and completed them by the deadlines.
Step 10: Evaluate the Results
Process improvement should not end with implementation. It is very important to measure the actual results and compare to predicted. If the actual results differ from the predicted ones, research needs to be conducted to figure out why, modify the process and repeat implementation and follow-up (i.e., repeat the A3 process) until the goal is met.
Example:
The manager of transportation picked specific dates to check the outcome of the countermeasures and implementation plan created by the A3 process team. On three specific dates, he timed twenty patient transports from the initial page to patient arrival at the diagnostic department, and recorded the results with dates on the A3 report. The results were:
- March, 14.7 minutes
- April, 11 minutes
- May, 9.15 minutes
These exceeded the goal of 30 minutes.