
EHHD_ED_UG_BS_TEP_K-8_and_Secondary_REPORT_2015-16
Question 1 – What did you do on assessment this year?
Signature Assignments (SAs)
TEP courses taken prior to student teaching include selected assignments aligned to the TEP Claims and the State Standards. These assignments are referred to as Signature Assignments (SAs), which demonstrate Pre-Ed Students’ and Teacher Candidates’ knowledge and pedagogical skill within specific content areas and aligned to our claims. SAs are evaluated by instructor of record for each individual class. The SA scores are submitted to the TEP’s Assessment Coordinator at the end of each semester and entered into the Program Assessment System (PAS) database for analysis.
Field Experience Performance Assessment (FEPA)
Field Supervisor (FSs) and Cooperating Teachers (CTs) complete all 27 indicators of the Final Performance Assessment individually and submit these to the MSU database. In the case of two or more Cooperating Teachers, the two (or more) FEPA scores are averaged to create one CT score. The CT and FS scores are then recorded by the FS on the Observations and Evaluation Score Sheet to produce the final FEPA score. The FEPA scores are submitted to the TEP’s Assessment Coordinator and entered into the PAS database for analysis.
For in-area (within 50 miles of MSU) FSs, we provide face-to-face training at the
beginning of each fall semester. FSs and CTs discuss the Performance Assessment process,
including how to use descriptors, how to communicate scores to the Teacher Candidate,
and how to submit the assessment electronically. Another session is offered before
the beginning of the spring semester for new field supervisors who were unable to
attend the fall training. We also provide podcast training for CTs and FSs at a distance:
http://www.montana.edu/fieldplacement/podcasts/overview_perf.html
and http://www.montana.edu/fieldplacement/podcasts/using_perf.html.
Teacher Candidates receive feedback using the FEPA rubric a minimum of six times each
semester: four times after each FS-observed lesson via the Observation Worksheet http://www.montana.edu/fieldplacement/documents/PDFs/Tchr_Cand_Assmt.pdf
once at mid-term with assessments completed by the CT and the FS, http://www.montana.edu/fieldplacement/documents/PDFs/Tchr_Cand_Assmt.pdf
and once at the end of the student teaching experience with the final FEPA completed
and submitted by the CT and FS https://www.montana.edu/fepa/. CTs are also encouraged
to use the FEPA rubric as an observation worksheet for weekly observations http://www.montana.edu/fieldplacement/documents/PDFs/Tchr_Cand_Assmt.pdf.
Field Experience Performance Assessments always occur in the context of real classroom practice. Twenty of the 27 FEPA indicators must be demonstrated during dynamic teaching situations. These are observed directly by MSU Field Supervisors and Cooperating Teachers and/or viewed by video in certain field supervisory situations. The final seven indicators under the category, “Professionalism — The Teacher Candidate engages in reflective practice to improve teaching and learning,” occur after the actual teaching situation in collaborative contexts with the field supervisor and cooperating teacher(s). Teacher candidates also provide weekly professional, reflective journals to their field supervisors from which additional evidence of professional reflection, professional adaptation, and professional development are demonstrated. In some cases (generally with out-of-area teaching situations), the IEFA indicator is assessed as a product when the opportunity for teaching the application is not available.
Teacher Work Sample (TWS)
The Teacher Work Sample is a four-section document that demonstrates Teacher Candidates’ ability to plan, deliver, assess, and reflect on a standards-based instructional sequence that facilitates the learning of K-12 students.
The TWS is evaluated by MSU-trained Clinical Evaluators (CEs) who record them in the Observations and Evaluation Score Sheet in order to determine the final student teaching grade. The CEs are trained by the Director of Field Placement. Over the course of each semester, the CEs communicate frequently with each other to increase reliability. In addition, both regular and as-needed meetings occur between the CEs and the Director of Field Placement as well as with the Department Head for the Department of Education in order to maintain the validity of TWS assessment as mandated by TEP’s Guiding Principles http://www.montana.edu/fieldplacement/conceptualfw.html. The final TWS scores are submitted by the CEs to the TEP’s Assessment Coordinator and entered into the PAS database for analysis.
Teacher Candidates receive assessments of their TWS methodology during their practicum placements as well as in various teaching methods classes in order to prepare them for their final TWS created during student teaching. During student teaching, CEs provide assessment and detailed feedback for all Teacher Candidates who submit TWS rough drafts at approximately week 8 of the 14-week student teaching calendar. In addition, informal, as- needed assessment and feedback are provided to all Teacher Candidates via an on-line Q & A, staffed throughout the student teaching semester by the CEs, with forum areas for questions on each section of the TWS. Students can post questions and/or snippets of their TWS documents for guidance and feedback.
Although the TWS documents real-time performance, the TWS is primarily a written document (with one 15-minute video component), and, therefore, occurs in an analytical/reflective context—both before and after the actual teaching experience. This allows the Teacher Candidate to thoughtfully plan a differentiated, standards-based lesson sequence in advance of instruction and to reflect on effectiveness of instruction, differentiation and personal performance afterward.
Graduate Survey (GS)
The Graduate Survey was originally designed to be completed by Teacher Candidates during the Professional Issues course which follows their student teaching experience. However, due to changes in the curriculum for some teaching majors, not all Teacher Candidates are required to complete the course. Of those students who do complete the course, approximately half elect to take the course online and we have had low response rates from the online students. Thus, some majors have incomplete data. The GS scores are submitted to the TEP’s Assessment Coordinator and entered into the PAS database for analysis.
Employer Survey (ES)
The Employer Survey was originally designed to be completed by employers of TEP Completers during the first year of Completers’ teaching experience. Unfortunately, we have had a very low response rate to our Employer Survey and repeated requests for return of the surveys have gone unanswered. However, thanks to a vibrant Educational Leadership program in our Department, we have established a strong communication network with district K-12 administrators across the state and we find that principals and superintendents will not hesitate to call us directly whenever they have a concern or want to discuss suggestions to improve the program. So while we do not have formal data to analyze regarding employers’ satisfaction with our Completers, we have received excellent feedback and input from our employers and have used that information to inform our program improvement efforts. We are currently designing a method to systematically document the feedback and input from our stakeholders.
TEP Assessment Timeline
The TEP has developed a robust approach to collecting, analyzing, and utilizing data for the purposes of continuous program improvement. Our Program Assessment System (PAS) is an electronic database composed of a set of assessments maintained by our Assessment Coordinator through the use of BANNER software, Microsoft Office ExcelTM and AccessTM. The PAS serves as the basis for our annual cycle of continuous improvement by providing sound data for decision-making regarding areas of program development. Over the course of the academic year, the PAS is used to systematically collect, aggregate, and analyze data regarding the qualifications, knowledge, and performance of our Pre-Education Students and Teacher Candidates as well as program outcomes. Members of the TEP faculty and staff analyze the data and prepare a full annual report for stakeholders. The findings are discussed at several venues and used to guide decisions about program improvement.
Our PAS is utilized in our annual cycle of continuous improvement (Figure 3.1) was developed and refined in collaboration with members of our professional community. For example, during Summer and Fall 2010 we held 36 meetings with stakeholders including faculty, cooperating teachers, K-12 administrators, and field supervisors to discuss our program requirements, examine our existing data, and identify ways in which we could strengthen our system of assessment. We completed our first cycle of continuous program assessment and improvement during 2009-2010, and since that time we have continued to implement and refine the PAS to meet our data needs for program improvement.
Figure 3.1
TEP Assessment Timeline
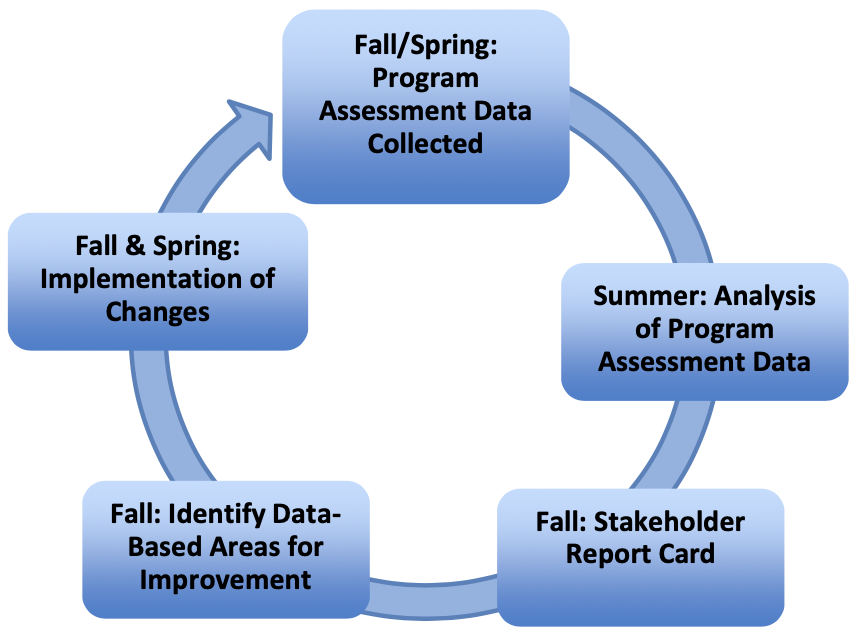
In past reporting cycles (2010-2013), our annual TEAC report was due in September; therefore, we structured the PAS for data collection and analysis using data from the preceding Summer, Fall, and Spring terms, rather than the academic year. This time frame provided the most complete data set as well as adequate time to analyze the most recent year’s data for the TEAC Annual Report and our fall meeting with stakeholders. It was during this period that we began to establish the reliability and validity of our instruments. In an effort to remain consistent in terms of reporting the reliability and validity of our instruments, the data in this self-study is based on our TEAC reporting cycle. However, with our recent shift to the CAEP annual reporting cycle, our annual reports now use a September 1 to August 31 timeline. Therefore, we transitioned our program report data to the CAEP timeline and this is the program data used in our current self-study. As we complete the transition to the CAEP reporting structure, we plan to modify our PAS to fully align with the CAEP reporting timeline.
Question 2 – What data did you collect?
Signature Assignments (SA)
TEP courses taken prior to student teaching include selected assignments aligned to the TEP Claims and the State Standards. These assignments are referred to as Signature Assignments (SA), which demonstrate Pre-Ed Students’ and Teacher Candidates’ knowledge and pedagogical skill within specific content areas and aligned to our claims.
- Scoring: Instructors use a common rubric for each Signature Assignment and have been trained for consistent use of the scoring rubrics. The SA scores are collected once a semester and entered into the PAS and are used for formative assessment purposes, which help us assess Pre-Ed Students’ and Teacher Candidates’ development relative to the TEP Claims 2-5.
- Expected Performance: SAs are considered an early assessment in the TEP where meeting the criteria of the rubric, which are aligned with both the Claims and State Standards, would be interpreted as an indicator the MSU student is ready to continue to move forward in his/her program. We expect at least 80% of our students to demonstrate that they can meet the SA expectations. For those students who do not meet SA expectations, instructors across the TEP provide various forms of remediation to support student growth and learning.
Teacher Work Sample (TWS)
The Teacher Work Sample is a four-section document that demonstrates Teacher Candidates’ ability to plan, deliver, assess, and reflect on a standards-based instructional sequence that facilitates the learning of K- 12 students. Teacher Candidates apply their understanding of the teaching discipline and subject area content knowledge through thoughtful design of a unit outline based on standards, assessments (pre-, formative, and summative) and content topic. They develop and deliver standards-based lesson plans and reflect on student performance in all areas of instruction, using specific data from the work sample.
- Scoring: The TWS is scored on a ranked scale of four possible responses: Not Observed (N/S), 1 = Below Expectation, 2 = Meets Expectation, or 3 = Exceeds Expectation for each item. The rubric designed for the TWS is aligned with the FEPA, Claims, and State Standards.
- Expected Performance: We expect at least 95% of Teacher Candidates will receive performance scores that meet expectations.
Field Experience Performance Assessment (FEPA)
The Field Experience Performance Assessment (FEPA) evaluates teaching performance in a variety of genuine clinical placement contexts through a series of observations in both Practicum and Student Teaching experience. The instrument consists of 27 items aligned with the five TEP claims: Content, Diversity, Pedagogy, Assessment, and Professionalism.
- Scoring: Teaching performance is scored on a ranked scale of four possible responses: N/S = Not Scored; 1 = Below Expectations, 2 = Meets Expectations, or 3 = Exceeds Expectations.
- Expected Performance:
- Practicum – We expect at least 80% of Practicum Teacher Candidates will reach
“Meets Expectations” or above for each item on the FEPA. Data collected prior to 2011 suggested that 80% meets/exceeds expectation was a reasonable threshold for Practicum Teacher Candidates because the data indicated that a number of candidates were mid-stream in their development needed the opportunity to grow in instructional competence. This reflects the developmental framework of our program as a whole. For those candidates who do not reach “Meets Expectations” on an individual item, Field Supervisors provide coaching, support and/or opportunities for remediation. - Student Teaching – We expect the threshold for the Student Teaching FEPA scores to be higher, given further development and practice. Thus we expect at least 95% of our Student Teaching Teacher Candidates will reach “Meets Expectations” or above for each item on the FEPA. We have placed periodic performance indicators throughout the TEP program, including gates (minimum GPA and background checks, for example) and assessments (Signature Assessments and previous FEPA), such that a 95% threshold for meeting or exceeding expectation reflects our belief that the vast majority of Teacher Candidates will meet our performance expectations, while factoring for the inevitable program reality that over time, a few Teacher Candidates will fail to reach this standard for various reasons. Teacher Candidates must receive a grade of “C” or better to be recommended for licensure.
- Practicum – We expect at least 80% of Practicum Teacher Candidates will reach
Praxis II
The Praxis II Subject Assessments are a standardized, nationally-normed examination of content knowledge. We believe that the Praxis II Subject Assessments provide our TEP with one source of evidence regarding our Completers’ mastery of the content knowledge needed to effectively teach specific K-12 subjects.
- Scoring: Montana’s passing scores have been determined by a team of experts from across our state for most content areas. For those teaching majors where a state-level passing score has not yet been set, the TEP faculty examined our recent students’ scores as well as passing scores from states across the nation, and set an appropriate passing score for our students http://www.montana.edu/fieldplacement/praxis/Praxis_Test_Scores.html.
- Expected Performance: The state of Montana does not use Praxis II scores as a single determinant for licensure decisions. Rather, Montana’s Office of Public Instruction uses a composite score approach in which Content Knowledge Verification is established through the utilization of multiple measures that includes a Praxis II score (http://www.montana.edu/fieldplacement/licensure/index.html). A team of experts from across our state established Praxis passing scores as one indicator in a tripartite metric that also includes subject matter GPA and assessment by the cooperating teacher during student teaching. Candidates in the TEP are required to complete the Praxis II test prior to student teaching. We then are able compare our median test score to the state’s median scores and national median scores. We expect 100% of our Completers to meet the state- or faculty-designated passing score.
Graduate Survey (GS)
In collaboration with our stakeholders, the faculty created a 10-question Likert scale survey aligned with our Program Claims and State Standards. This survey was designed to provide data regarding Completers’ perspectives on their satisfaction with the TEP and their preparedness for the classroom.
Employer Survey (ES)
In collaboration with our stakeholders, the faculty created a 10-question Likert scale survey aligned with our TEP Claims and State Standards. This survey was designed to provide independent assessment from K-12 administrators regarding the degree to which Completer performance meets employer expectations in the areas related to TEP claims and to provide information regarding the strengths and weaknesses of the program and its Completers.
Data were analyzed for program Completers for the past three years (2012-2013, 2013-2014, and 2014-15). Results were reported by cohort based on year of completion. To measure programmatic success we examined the percentage of Completers meeting expectations as indicated by the pass rate as detailed above in Section 2.
The goal of our analysis was to investigate the following research questions:
- Does the evidence support the Program Claims regarding Completers of the MSU Teacher
Education Program?
- This question was investigated by examining the percentage of students who met the desired pass rate for each claim as measured by the Praxis, Signature Assignments, FEPA, TWS, and Graduate Survey.
- What are strengths of the MSU Teacher Education Program?
- This question was investigated by examining our instruments as well as areas where Completers exceeded expectations (as indicated by pass rate).
- What are the opportunities for growth in the MSU Teacher Education Program?
- This question was investigated by examining our instruments as well as areas where Completers failed to meet expectations (as indicated by pass rate).
Question 3 – What did your review of the data indicate for you?
We used the data to answer three research questions. First we examined TEP completer data, then investigated strengths of the TEP program along with areas for growth. Highlights of findings are included below.
RESEARCH QUESTION 1: Does the evidence support the Program Claims regarding Completers of the MSU Teacher Education Program?
This research question was investigated by examining the percentage of TEP Completers who met the desired pass rate for each TEP claim as measured by the Praxis, SAs, FEPA, TWS, and GS.
Claim 1: Content Mastery
The results of the Praxis II exams reveal that 11 of 127 TEP Completers in 2014-15 earned ETS Recognition of Excellence (scoring in the top 15% nationally). Moreover 88% of the TEP Completers earned 100% of the Montana passing score and 100% of the MSU TEP Completers earned 90% of the Montana passing score. Thus, MSU TEP Completers have a solid foundation of content knowledge. Aggregated data from Teaching Practicum FEPA Items 1-4 and Student Teaching FEPA Items 1-4, reveal a high level of success with pass rates in excess of 99%, which suggests that overall, our program Completers demonstrate strength in content knowledge. All teaching majors met their goals on the FEPA. Aggregated data from our TWS Section 2 initially suggests that we have fallen short of our goals by a small margin (88%, being 7% below our ambitious goal of 95% or above meeting expectations) in the most recent year of reported data. However, the standard deviation is high (1.28), which indicates a large variation somewhere within the group and suggests the possibility of a few outliers with dramatically different scores - scores that may have masked individual program success, may not meet the needs of every teaching major equally. Six of the sixteen teaching majors (Elementary Education, English teaching, Family and Consumer Sciences teaching, Physics Teaching, Health Enhancement, and School Music Broadfield), failed to meet expectations on the content section of the TWS. Finally, Graduate Survey Items 1-2 reveal that of the Completers who provided feedback, all (100%) perceive their content preparation as consistently strong. All teaching majors with data met expectations on the content section of the graduate survey (Table 1).
Table 1
Content Mastery Claim: Summary of the Evidence
| Content Goal Met | Praxis II | Practicum Performance Assessment |
Student Teaching Performance Assessment |
Teacher Work Sample |
Graduate Survey |
| Teacher Education Program All Majors |
No | Yes | Yes | No | Yes |
| Elementary Education K-8 |
No | Yes | Yes | No | Yes |
| Agricultural Education Broadfield 5-12 |
Yes | Yes | Yes | Yes | NA |
| Biological Sciences Teaching 5-12 |
NA | NA | NA | NA | NA |
| Chemistry Teaching 5-12 |
Yes | Yes | Yes | Yes | NA |
| English Teaching 5-12 |
Yes | Yes | Yes | No | Yes |
| Family and Consumer Sciences 5-12 |
Yes | Yes | Yes | No | NA |
| General Science Broadfield 5-12 |
Yes | Yes | Yes | Yes | Yes |
| History Teaching 5-12 |
No | Yes | Yes | Yes | Yes |
| Mathematics Teaching 5-12 |
No | Yes | Yes | Yes | Yes |
| Physics Teaching 5-12 |
Yes | Yes | Yes | No | NA |
| Social Studies Broadfield 5-12 |
No | Yes | Yes | Yes | Yes |
| Technology Education Broadfield 5-12 |
Yes | Yes | Yes | Yes | NA |
| Art Education Broadfield K-12 |
Yes | Yes | Yes | Yes | Yes |
| Health Enhancement K-12 |
Yes | NA | Yes | No | |
| French Teaching K-12 |
Yes | Yes | Yes | Yes | NA |
| German Teaching K-12 |
NA | NA | NA | NA | NA |
| Spanish Teaching K-12 |
Yes | Yes | Yes | Yes | Yes |
| School Music Broadfield K-12 |
Yes | Yes | Yes | No | NA |
Claim 2: Understanding Development and Diversity of Learners
The results of our analyses indicated that our TEP Completers exceeded our expectations
on all assessments of diversity and development. That notwithstanding, it would be
beneficial to
review the entire set of assessments for Claim 2 together and consider their alignment
as well as how well the set provides a developmental progression for teacher candidates.
On their Signature Assignments, the most recent cohort of TEP Completers consistently exceeded pass rates, with
the exception of English teaching Completers. These Signature Assignments are completed
in a course taken early in the program and requires Pre-Ed Students to demonstrate
their understanding of developmental concepts by recognizing and implementing them
in practice. It is encouraging that when teacher candidates reach later stages of
their program where the FEPA and TWS assess their ability to respond appropriately
to students’ levels of development in their own teaching, they meet a higher standard
of using these concepts in practice. For Teaching Practicum FEPA Items 5-9 and Student Teaching FEPA Items 5-9 the results are consistently positive (pass rates ranging from 98%-100%) in that
our candidates exceed our program expectations. The Technology Education failed to
meet expectations on the Practicum FEPA but met expectations on the Student Teaching
FEPA. We believe the low FEPA scores represent a case of students needing increased
support in this area from both the TEP and their cooperating teachers. A high pass
rate of 99% in TWS Section 1 indicates that most Completers can demonstrate their understanding of the development
and diversity of learners, but a high standard deviation of 1.57 indicates a need
to examine individual teaching majors in order to fully understand the variance. Only
one of our teaching majors (Family and Consumer Sciences teaching) failed to meet
expectations on the diversity section of the TWS. Finally, among the teaching majors,
only three (History Teaching, Social Studies Broadfield, and Health Enhancement) failed
to meet expectations on Graduate Survey Items 3-4. In examining these lower than expected scores, it should be noted that all three
programs had low response rates on the survey. For example, only two Social Studies
Completers took the graduate survey and there was a high standard deviation, 1.41
on one of the items. Overall, these results suggest that our Completers feel able
to recognize and respond to diversity of learners and different developmental levels.
Completers demonstrate their preparedness to plan for differentiation and culturally
sustaining education as evidenced by several assignments in their methods course and
within their field experiences. It furthermore validates assessments of this skill
through the SAs, FEPA, and TWS.
Table 2
Development & Diversity Claim: Summary of the Evidence
| Content Goal Met | Praxis II | Practicum Performance Assessment |
Student Teaching Performance Assessment |
Teacher Work Sample |
Graduate Survey |
| Teacher Education Program All Majors |
Yes | Yes | Yes | Yes | Yes |
| Elementary Education K-8 |
Yes | Yes | Yes | Yes | Yes |
| Agricultural Education Broadfield 5-12 |
Yes | Yes | Yes | Yes | NA |
| Biological Sciences Teaching 5-12 |
NA | NA | NA | NA | NA |
| Chemistry Teaching 5-12 |
Yes | Yes | Yes | Yes | NA |
| English Teaching 5-12 |
No | Yes | Yes | Yes | Yes |
| Family and Consumer Sciences 5-12 |
Yes | Yes | Yes | No | NA |
| General Science Broadfield 5-12 |
Yes | Yes | Yes | Yes | Yes |
| History Teaching 5-12 |
Yes | Yes | Yes | Yes | No |
| Mathematics Teaching 5-12 |
Yes | Yes | Yes | Yes | Yes |
| Physics Teaching 5-12 |
Yes | Yes | Yes | Yes | NA |
| Social Studies Broadfield 5-12 |
Yes | Yes | Yes | Yes | No |
| Technology Education Broadfield 5-12 |
Yes | No | Yes | Yes | NA |
| Art Education Broadfield K-12 |
Yes | Yes | Yes | Yes | Yes |
| Health Enhancement K-12 |
Yes | Yes | Yes | Yes | No |
| French Teaching K-12 |
Yes | Yes | Yes | Yes | NA |
| German Teaching K-12 |
NA | NA | NA | NA | NA |
| Spanish Teaching K-12 |
Yes | Yes | Yes | Yes | Yes |
| School Music Broadfield K-12 |
Yes | Yes | Yes | Yes | NA |
Claim 3: Pedagogical and Technological Proficiency
The results of our analyses indicated that our TEP Completers exceeded the desired pass rate on all assessments related to this claim in 2014-15, with the exception of two sections of the TWS (the aligned unit/lesson planning section and the instructional planning/student achievement), which had 88% and 89% pass rates respectively. On their Signature Assignments, the most recent cohort of TEP Completers consistently exceeded the desired pass rate on this assessment, with pass rates of 99% and 98% respectively. However, given that students complete this assessment prior to the TWS, it could be aligned to better prepare and assess students in the “deficient” TWS areas, as these courses address aligned unit/lesson planning and instructional planning/student achievement. For Teaching Practicum FEPA Items 10-16 and Student Teaching FEPA Items 10-16, candidates show a consistently high rate of achievement in pedagogical and technological practices with pass rates ranging from 96% to 99%. Only two teaching majors failed to meet expectations on the Practicum FEPA (Chemistry Teaching and French Teaching). Two teaching majors (History Teaching and Health Enhancement) did not meet expectations on the Student Teaching FEPA. However, out of all of the assessments in the PAS, candidates struggled the most to meet expectations on the Pedagogy sections of the TWS. Table 3 reveals that eight of the sixteen teaching majors (Elementary Education, English Teaching, Family and Consumer Sciences teaching, General Science Broadfield, History Teaching, and Physics Teaching, Health Enhancement, and School Music Broadfield) failed to meet expectations on the pedagogy sections of the TWS. It is possible that the relatively large standard deviations on the TWS Section 3 suggest that, again, our scores may be influenced by a minority of distant outliers within the group that effectively pull an otherwise acceptable mean below our stated goals. Finally, Graduate Survey Items 5-7 consistently exceed program goals and suggest our graduates feel well prepared to meet the technological and pedagogical demands of their disciplines in the classroom. Among teaching majors with Completers submitting a graduate survey, all majors met expectations.
*Table 3
Pedagogical and Technological Proficiency Claim: Summary of the Evidence
| Pedagogy Goal Met | Praxis II | Practicum Performance Assessment |
Student Teaching Performance Assessment |
Teacher Work Sample |
Graduate Survey |
| Teacher Education Program All Majors |
Yes | Yes | Yes | No | Yes |
| Elementary Education K-8 |
Yes | Yes | Yes | No | Yes |
| Agricultural Education Broadfield 5-12 |
Yes / NA | Yes | Yes | Yes | NA |
| Biological Sciences Teaching 5-12 |
NA | NA | NA | NA | NA |
| Chemistry Teaching 5-12 |
Yes | No | Yes | Yes | NA |
| English Teaching 5-12 |
Yes | Yes | Yes | No | Yes |
| Family and Consumer Sciences 5-12 |
Yes | Yes | Yes | No | NA |
| General Science Broadfield 5-12 |
Yes | Yes | Yes | No | Yes |
| History Teaching 5-12 |
Yes | Yes | No | No | Yes |
| Mathematics Teaching 5-12 |
Yes | Yes | Yes | Yes | Yes |
| Physics Teaching 5-12 |
Yes | Yes | Yes | No | NA |
| Social Studies Broadfield 5-12 |
Yes | Yes | Yes | Yes | Yes |
| Technology Education Broadfield 5-12 |
Yes | Yes | Yes | Yes | NA |
| Art Education Broadfield K-12 |
Yes | Yes | Yes | Yes | Yes |
| Health Enhancement K-12 |
Yes | NA | No | No | Yes |
| French Teaching K-12 |
Yes | No | Yes | Yes | NA |
| German Teaching K-12 |
NA | NA | NA | NA | NA |
| Spanish Teaching K-12 |
Yes | Yes | Yes | Yes | Yes |
| School Music Broadfield K-12 |
Yes | Yes | Yes | No | NA |
*The PDF on which this web page is based incorrectly displayed the Assessment Goal Met table in this location. The correct Pedagogy Goal Met table is now presented here.
Claim 4: Excellence in Instructional Design and Assessment
The results of our analyses indicated that our TEP Completers exceeded the desired pass rate on all assessments related to this claim in 2014-15, with the exception of one section of the TWS (instructional planning/student achievement), where the pass rate was 89%. On their Signature Assignments, results indicate candidates successfully grasp the concepts of instructional planning. All teaching majors with the exception of mathematics teaching met expectations on the signature assignments for the instructional design and assessment claim. Similar results indicate candidates successfully grasp the concepts of assessment for improved instructional design. For Teaching Practicum FEPA Items 17-20 and Student Teaching FEPA Items 17-20, reveal promising results from candidates’ performance evaluations; however we are still aware that even within high scores, there are potential areas of concern within specific teaching majors such as French teaching and History teaching. History teaching Completers failed to meet expectations on both the Practicum and Student Teaching FEPA. It should be noted that although History teaching majors only met expectations on 1 of the 4 items on the Practicum FEPA, they improved to meet expectations on 3 of the 4 items on the Student Teaching FEPA. Scores on the TWS Section 3 in instructional design and assessment reveal an aggregate of 84% passing scores and a notably high standard deviation (1.77). Six teaching majors (Elementary Education, Family and Consumer Sciences Teaching, General Science Broadfield, History teaching, Health Enhancement, and School Music Broadfield) failed to meet expectations on section 3 of the TWS (Table 4). In light of the fact that this specific assessment conflicts with the results of all other program assessments for this claim, we will explore potential explanations for this finding both at a measurement level and a program level and develop approaches to strengthen Completers’ data literacy. Finally, Graduate Survey Items 8- 9 reveal that our program Completers’ perceptions of their instructional design and assessment is positive and commensurate with the majority of assessments used for this claim.
Table 4
Excellence in Instructional Design and Assessment Claim: Summary of the Evidence
| Asessment Goal Met | Praxis II | Practicum Performance Assessment |
Student Teaching Performance Assessment |
Teacher Work Sample |
Graduate Survey |
| Teacher Education Program All Majors |
Yes | Yes | Yes | No | Yes |
| Elementary Education K-8 |
Yes | Yes | Yes | No | Yes |
| Agricultural Education Broadfield 5-12 |
Yes | Yes | Yes | Yes | NA |
| Biological Sciences Teaching 5-12 |
NA | NA | NA | NA | NA |
| Chemistry Teaching 5-12 |
Yes | Yes | Yes | Yes | NA |
| English Teaching 5-12 |
Yes | Yes | Yes | Yes | Yes |
| Family and Consumer Sciences 5-12 |
Yes | Yes | Yes | No | NA |
| General Science Broadfield 5-12 |
Yes | Yes | Yes | No | Yes |
| History Teaching 5-12 |
Yes | No | No | No | Yes |
| Mathematics Teaching 5-12 |
No | Yes | Yes | Yes | Yes |
| Physics Teaching 5-12 |
Yes | Yes | Yes | Yes | NA |
| Social Studies Broadfield 5-12 |
Yes | Yes | Yes | Yes | Yes |
| Technology Education Broadfield 5-12 |
Yes | Yes | Yes | Yes | NA |
| Art Education Broadfield K-12 |
Yes | Yes | Yes | Yes | Yes |
| Health Enhancement K-12 |
NA / Yes | NA | Yes | No | Yes |
| French Teaching K-12 |
Yes | No | Yes | Yes | NA |
| German Teaching K-12 |
NA | NA | NA | NA | NA |
| Spanish Teaching K-12 |
Yes | Yes | Yes | Yes | Yes |
| School Music Broadfield K-12 |
Yes | Yes | Yes | No | NA |
Claim 5: Professionalism
The results of our analyses indicated that in 2014-15, TEP Completers met the desired pass rate on all assessments of this claim with the exception of the TWS (self-assessment and reflection) where only 85% of the Completers achieved the desired pass rate. In 2013-14 and 2012-13 the pass rates were 85% and 97% respectively. On their Signature Assignments, 99% of our Completers earned passing scores with low standard deviations. Only School Music Broadfield, failed to meet expectations on the Professionalism Signature Assignment. Perhaps the most consistent result in our dataset, the high pass rate shows candidates’ awareness of the importance of fostering community and classroom relationships. The SA-Reflection shows candidates’ systematic reflection on effective planning and teaching contexts to improve student performance. For Teaching Practicum FEPA Items 21-27 and Student Teaching FEPA Items 21-27 the results support a high degree of candidate reflective praxis over each of our program claims across all years examined, with only one teaching major, History, failing to meet expectations on the Student Teaching FEPA. The results of the Practicum and Student Teaching FEPAs are further corroborated by a majority of the instruments used to evaluate this Claim. Scores on the TWS Section 4 showed a high pass rate for academic years 2011-2013 in excess of 97% but fell below the pass rate at 85% in 2013-14 and 2014-2015. Eight of the sixteen teaching majors (Elementary Education, Agricultural Education Broadfield, English Teaching, Family and Consumer Sciences Teaching, General Science Broadfield, Mathematics Teaching, Social Studies Broadfield, and Health Enhancement) failed to meet expectations on section 4 of the TWS (Table 5). This is an area of concern for our TEP. Furthermore, there is a high standard deviation in all three data years. Given that throughout their education coursework and field experiences, Completers are expected to interact with others professionally, reflect on their practice, and identify areas and plans for improvement, we will explore potential explanations for this finding both at a measurement level and a program level. Finally, Graduate Survey Item 10 reveals that our program graduates’ perceptions of their reflective ability is positive and commensurate with the majority of assessments used for this claim. All of the teaching majors with program Completers met expectations on the professionalism item of the graduate survey.
Table 5
Professionalism Claim: Summary of the Evidence
| Professionalism Goal Met | Praxis II | Practicum Performance Assessment |
Student Teaching Performance Assessment |
Teacher Work Sample |
Graduate Survey |
| Teacher Education Program All Majors |
Yes | Yes | Yes | No | Yes |
| Elementary Education K-8 |
Yes | Yes | Yes | No | Yes |
| Agricultural Education Broadfield 5-12 |
Yes | Yes | Yes | No | NA |
| Biological Sciences Teaching 5-12 |
NA | NA | NA | NA | NA |
| Chemistry Teaching 5-12 |
Yes | Yes | Yes | Yes | NA |
| English Teaching 5-12 |
Yes | Yes | Yes | No | Yes |
| Family and Consumer Sciences 5-12 |
Yes | Yes | Yes | No | NA |
| General Science Broadfield 5-12 |
Yes | Yes | Yes | No | Yes |
| History Teaching 5-12 |
Yes | Yes | No | Yes | Yes |
| Mathematics Teaching 5-12 |
Yes | Yes | Yes | No | Yes |
| Physics Teaching 5-12 |
Yes | Yes | Yes | Yes | NA |
| Social Studies Broadfield 5-12 |
Yes | Yes | Yes | No | Yes |
| Technology Education Broadfield 5-12 |
Yes | Yes | Yes | Yes | NA |
| Art Education Broadfield K-12 |
Yes | Yes | Yes | Yes | Yes |
| Health Enhancement K-12 |
Yes / NA | NA | Yes | No | Yes |
| French Teaching K-12 |
Yes | Yes | Yes | Yes | NA |
| German Teaching K-12 |
NA | NA | NA | NA | NA |
| Spanish Teaching K-12 |
Yes | Yes | Yes | Yes | Yes |
| School Music Broadfield K-12 |
No | Yes | Yes | Yes | NA |
RESEARCH QUESTION 2: What are strengths of the MSU Teacher Education Program?
This research question was investigated by examining our instruments as well as areas where Completers exceeded expectations (as indicated by pass rate). As an EPP focusing on continuous improvement, the MSU PAS allows us to examine our program’s strengths as well as areas for growth. Our second research question focused on identifying the strengths of the MSU Teacher Education Program. Results suggest several strengths including:
- Academic ability of TEP Completers
- Clinical evaluators’ rigorous assessment of TWS
- Measurement strengths of the FEPA, TWS, and GS
- Absence of measurement bias for all instruments except for the Student Teaching FEPA
Academic Ability of TEP Completers
We are proud of the academic ability and achievement of students in the MSU TEP. Over the past four years, average ACT scores of incoming TEP Completers ranged from 23.0-23.5 whereas, average SAT scores ranged from 521-564 (Verbal) and 538-564 (Math) (Table 6). CAEP Standard 3.2 suggests that ACT and SAT scores must be in the top 50 percent from 2016-2017, the top 40 percent of the distribution from 2018-2019; and the top 33 percent of the distribution by 2020 (CAEP Standard 3.2). In 2014-2015, the TEP ACT composite was 23.5 (68-74 percentile rank) with an average ACT Math score of 23.1 (approximately 67 percentile rank) and an average ACT English score of 23.3 (approximately 69 percentile rank) (ACT, 2015). Furthermore, the average TEP SAT verbal score (564) was approximately the 70th percentile rank and the SAT mathematics score (564) was approximately the 64th percentile rank (College Board, 2014). Average ACT and SAT scores suggest that MSU TEP Completers are demonstrate high levels academic potential entering college.
Table 6
ACT and SAT Scores of TEP Completers
| Academic Year of Completion | Completers N | ACT N | Mean ACT COMP | Mean ACT ENGLISH | Mean ACT MATH | SAT N | Mean SAT VERBAL | Mean SAT MATH |
| 2011-2012 | 128 | 76 | 23.0 | 22.8 | 22.6 | 30 | 521 | 541 |
| 2012-2013 | 170 | 110 | 23.5 | 23.5 | 23.0 | 52 | 529 | 538 |
| 2013-2014 | 192 | 125 | 23.1 | 22.7 | 23.0 | 63 | 557 | 559 |
| 2014-2015 (to June 30) | 170 | 111 | 23.5 | 23.3 | 23.1 | 47 | 564 | 564 |
In 2014-2015, when compared to the average scores of MSU Completers, the average ACT scores earned by TEP Completers were 1.5 points lower on the ACT Composite, 1.2 points lower on the ACT English, and 1.9 points lower on ACT Math (Table 7). When comparing SAT scores, average scores of TEP Completers were 2 points higher on the SAT Verbal Test and 14 points lower than MSU Completers on the SAT Math Test. Please note, TEP Completers are included in the MSU completer numbers.
Table 7
ACT and SAT Scores of MSU Completers
| Academic Year of Completion | MSU UG Completers N | ACT N | Mean ACT COMP | Mean ACT ENGLISH | Mean ACT MATH | SAT N | Mean SAT VERBAL | Mean SAT MATH |
| 2011-2012 | 1291 | 343 | 24.2 | 23.6 | 24.4 | 619 | 554 | 570 |
| 2012-2013 | 1909 | 334 | 24.5 | 24.0 | 24.6 | 647 | 561 | 580 |
| 2013-2014 | 2226 | 318 | 24.9 | 24.3 | 24.9 | 767 | 564 | 579 |
| 2014-2015 (to July 1) | 1962 | 377 | 25.0 | 24.5 | 25.0 | 681 | 562 | 578 |
Although the minimum GPA requirement for the TEP is 2.75, MSU TEP cohort of Completers average GPA at admission to the program ranged from 3.28 in 2011-2012 to 3.39 in 2014-2015 (Table 8). High GPAs upon admission to the program suggest that MSU TEP’s Completers demonstrate a high level of academic ability. The following table provides the ACT and SAT scores for all the MSU undergraduate Completers.
Table 8
Average GPA at Admission for TEP Completers
| Academic Year Sept 1 to August 31 |
N | Mean GPA at Admission | SD | Data Unavailable in Banner | |
| 2011-2012 | 174 | 3.28 | 0.41 | 5 | |
| 2012-2013 | 261 | 3.31 | 0.41 | 10 | |
| 2013-2014 | 185 | 3.31 | 0.42 | 8 | |
| 2014-2015 (to June 29) | 169 | 3.39 | 0.42 | 2 |
When comparing average GPA at graduation, MSU TEP undergraduate Completers GPAs are .16 points higher than MSU undergraduate Completers (Tables 9 and 10). It should be noted that TEP completer data is included in the overall MSU completer data. Therefore, it is difficult to infer any practical difference in average GPAs between the two groups.
Table 9
Average GPA at Graduation for TEP Completers
| Academic Year of Completion |
TEP Completers N |
Mean GPA | SD | |
| 2011-2012 | 128 | 3.47 | 0.32 | |
| 2012-2013 | 170 | 3.42 | 0.31 | |
| 2013-2014 | 192 | 3.47 | 0.30 | |
| 2014-2015 (to July 1) | 170 | 3.46 | 0.33 |
Table 10
Average GPA at Graduation for MSU Completers
| Academic Year of Completion |
MSU UG Completers N | Mean GPA | SD | |
| 2011-2012 | 1291 | 3.25 | 0.42 | |
| 2012-2013 | 1909 | 3.29 | 0.41 | |
| 2013-2014 | 2226 | 3.31 | 0.42 | |
| 2014-2015 (to July 1) | 1962 | 3.29 | 0.41 |
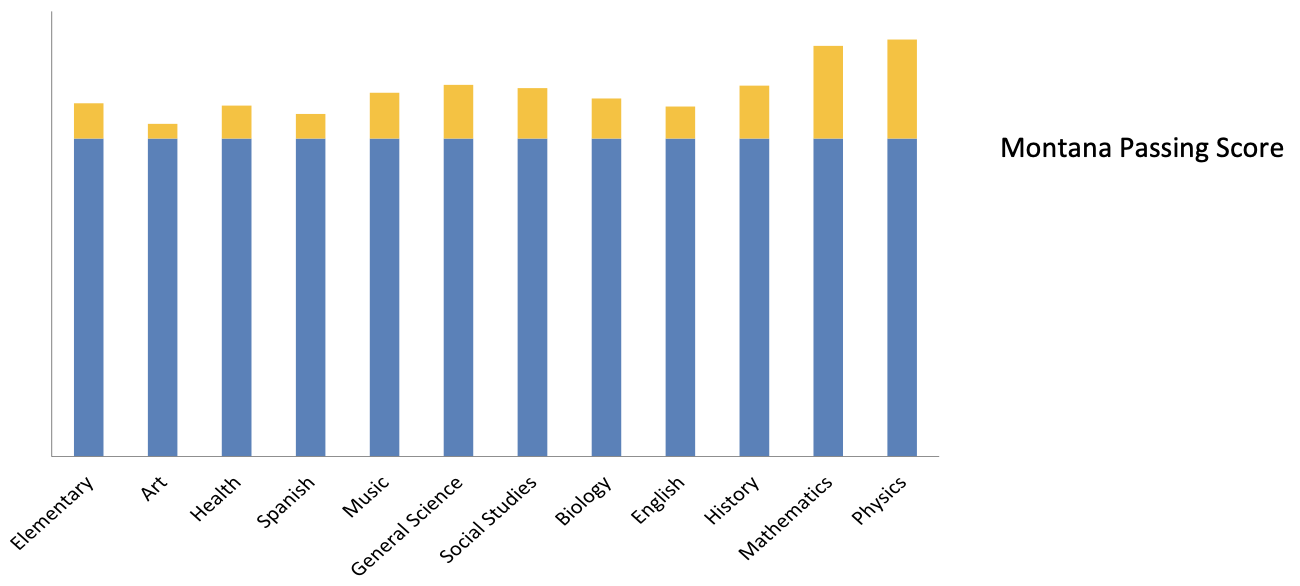
In 2014-2015, all Completers in 12 teaching majors (75%) earned 100% of the MT Praxis II passing score and all Completers from four licensure areas (25%) earned 90% of the MT passing score. As a Research University/Very High activity – RU/VH institution, these results indicate that MSU provides students with a strong foundation of content knowledge. This is supported by the data represented in Table 11, which demonstrates that in 2013-14, the median score for TEP Completers was above the national median score for all areas, except Spanish. Furthermore, TEP Completers’ mean Praxis scores surpass the Montana passing score in all teaching majors that have Praxis data (Table 12). The evidence indicates that MSU TEP Completers demonstrate strength in content knowledge both at admission and program completion.
Table 11
Comparison of 2013-14 Praxis II MSU Median vs. US Median
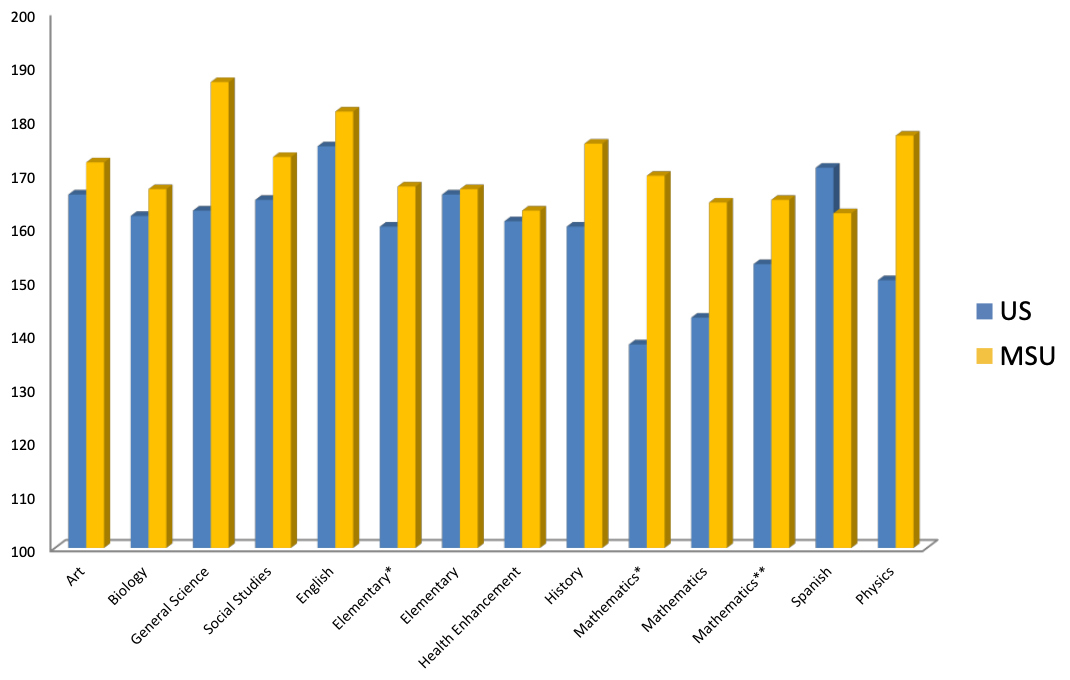
Table 12
MSU 2013-14 Praxis II Mean Scores
Role of Clinical Evaluators
We acknowledge that the pass rates on the TWS have experienced a decrease in the past two years. Rather than seeing this as a weakness, we view this as a strength resulting from adjustments to our assessment system. In 2013-2014, we changed how the TWS’s were evaluated by having two Clinical Evaluators who had been trained to provide consistent evaluation of our candidate’s TWS. In 2014, a Pearson correlation was conducted to explore the inter-rater reliability between clinical evaluator’s scoring of the TWS. All TWS’s submitted were coded; then, using randomly generated numbers, a total of 20 documents were graded by both of the evaluators independently, and the scores were compared. A paired samples t-test was run to compare mean scores by section and no significant differences were found between groups. In order to test the degree to which the Evaluators agreed on the overall scores for the TWS, a Pearson correlation coefficient was calculated. There was a strong, positive correlation between the overall scores generated by the Evaluators (r=0.9, n=20, p.=0.001). We are confident that variance in scores represents difference in student ability rather than rater disparities.
Measurement Strengths of the FEPA, TWS, and GS
A careful examination of reliability and validity of the instruments in our PAS highlights additional strengths in MSU’s TEP. The overall reliability of the FEPA, TWS, and GS (r=0.949 0.766, and 0.836) suggest modest to high levels of internal consistency. Moreover, the reliability of the GS has continued to improve over the past three years. In examining validity, an analysis of the FEPA suggests that scores from field supervisors and cooperating teachers are significantly higher in student teaching than practicum thus demonstrating discriminant validity.
Reduction of Bias in PAS Instruments
Another noteworthy strength of the MSU TEP PAS is our effort to eliminate bias from our assessment instruments. As part of our PAS, we assess the bias in assessment instruments by both gender and licensure area. In 2013-2014, 24 analyses were conducted with 7 (29%) demonstrating significant differences. In 2014-2015, only two (8%) of the 24 tests indicate bias by gender and licensure both in the student teaching FEPA. In the future, we look to incorporate additional training with the goal of illuminating bias from our assessment practices.
RESEARCH QUESTION 3: What are the opportunities for growth in the MSU Teacher Education Program?
This question was investigated by examining our instruments as well as areas where Completers failed to meet expectations (as indicated by pass rate). In addition to highlighting strengths, MSU’s PAS allows for the careful exploration of areas for growth. Results suggest several areas for improvement within the PAS including:
- Signature Assignment scoring
- Signature Assignment alignment with TWS
- FEPA inter-rater reliability for practicum
- Structure of the TWS
- Graduate Survey response rate
Signature Assignment Scoring
The examination of reliability and validity of MSU TEP’s assessment instruments suggest several areas for growth. Analysis suggests significant differences in signature assignment by instructor. Differences in signature assignment scores by instructor were prevalent in several signature assignments but represent a sizeable challenge in the pedagogy signature assignment where there are often 30+ instructors across various subject areas. In the future, we will look for ways to strengthen both the signature assignment rubrics and scoring with the aim of eliminating some of the instructor differences in score.
Signature Assignment Alignment with the TWS
The correlations between the SAs and the TWS provide another opportunity for program improvement. Acknowledging that the SAs have face validity, the correlations between the signature assignments and the TWS were lower than we deem acceptable. A possible explanation for these lower than expected correlations is a problem with the alignment between the content of signature assignments and the sections of the TWS. The TWS does not have a discrete score for each claim and therefore, it is not surprising that we have weak alignment between the Signature Assignments and TWS. On a similar note, the correlations between the Graduate Survey and the TWS were lower than anticipated and this too, could be related to the global TWS score for the claims compared to the specific scores on the graduate survey. Therefore, prior to our site visit, we will have a team of faculty review, revise, and align the content and rubrics for the Signature Assignments, TWS and the Graduate Survey.
Practicum FEPA Inter-rater Reliability
In addition to improving our SAs, there is room for improvement with the FEPA, particularly in the Teaching Practicum. Although inter-rater reliability among student teaching cooperating teachers and field supervisors were all statistically significant, ranging from (.236 to .598), we would like to see these correlations improved to the .80 level. Moreover, the inter-rater reliability for practicum cooperating teachers and field supervisor ranged from 188 to .404. In an effort to improve the assessment of our TEP candidates in the field, we have begun to develop a performance assessment that will be fully aligned with the Danielson Framework. This framework has already been adapted for use in Montana and as such will be more familiar to our CTs and FSs as they work with, and assess, our candidates’ performance. This familiarity has the potential to strengthen the inter-rater reliability between field supervisors and cooperating teachers.
Structure of the TWS
As previously mentioned, performance on sections 2, 3, and 4 of the TWS has decreased over the past two years. Although we view the evaluation of the TWS by clinical evaluators as a strength, providing increased reliability in the assessment of completer performance, we still need to address the percentage of Completers not meeting desired pass rates on these TWS sections. Furthermore, there is great variation in performance on the TWS by licensure area. Thus, we need to form a TWS Working Group that will review, revise, and align the design of the TWS to accurately meet the assessment needs of each of the 18 teaching majors.
Graduate & Employer Survey Response Rate
Finally, the low response rate on the Graduate and Employer Surveys is an area for improvement in the MSU TEP. This past year we had 36 of 155 Completers submit a graduate survey for a response rate of 23%. We believe that our plan to meet CAEP Standard 4 will increase the response rate on both the Graduate and Employer Survey.
CONCLUSION
As we designed this Inquiry Brief Self-Study research project, we set out to investigate if evidence supported our Program Claims regarding Completers of the MSU Teacher Education Program. We also wanted to identify the areas of strength and opportunities for improvement throughout our program. We believe the preponderance of the evidence presented in this Inquiry Brief supports the claims that MSU makes about Completers of the TEP. Furthermore, the evidence indicates that we have met each of the components of CAEP Standard 1, Standard 2, and the cross-cutting themes, as well as a majority of the components of Standards 3 and Standard 5. Finally, the evidence presented in this study clearly demonstrates that MSU TEP Completers are skilled and knowledgeable regarding the cross-cutting themes of diversity and technology (Appendix 7). It is our conclusion that, based on the evidence, MSU TEP Completers are well-prepared to enter the classroom, equipped with the requisite knowledge and skills to work effectively with diverse students by engaging them in creative and technologically sophisticated learning experiences.
In the following section, we present our plans for evidence-based continuous improvement in Standards 1-3, and 5, as well as our plan to meet Standard 4.
Question 4 – As a result of your review of the data, what did you do?
In order to ensure that MSU’s TEP Teacher Candidates develop a deep understanding of the critical concepts and principles of their discipline and, by completion, are able to use discipline- specific practices flexibly to advance the learning of all students toward attainment of college- and career-readiness standards, we plan to engage in the following ongoing program improvement efforts:
Align the FEPA with the Danielson Framework
We have begun the process to adapt our FEPA to align with the Danielson Framework for teacher evaluation. This will allow us to align with practices in our partner schools and across our state.
The Clinical Evaluation Working Group (n=10; 3 faculty, 2 professionals from the Field Placement office, 3 FS and 2 CT) met on June 19, 2015 to create an evaluative tool aligned to Domains 2&3 of the Danielson Framework (DF) that could be used during planned observations in both the practica and student teaching internship. This instrument was designed and will be ready for implementation in Fall 15.
The Clinical Evaluation Working Group agreed to the following next steps:
- Work with Department of Education and other appropriate faculty across campus to vertically and horizontally map existing curriculum and consider appropriate changes to closely integrate coursework and field experiences with the DF as the unifying structure (beginning in Fall 2015).
- Revise practicum (elementary and secondary) syllabi to address the incorporation of all four domains of the DF for Fall 2015.
- Consider how assignment of grades will be addressed in practica (Fall 2015) and student teaching internships (Spring 2016).
- Examine the TWS component of practica and the student teaching internship for alignment with Domains 1&4 of the DF and considering adjustments to the assignments in the practicum courses to fill in any gaps that are not attended to by the new observational tool and the TWS.
- Pilot observational tool in practica in the Fall of 2015, with adjustments to be made to the tool prior to full implementation in student teaching in Spring 2016.
- Investigate the implementation of LiveText, Lessoncast or some other mechanism to capture evidence (video recordings, student work, etc.) submitted by all parties (including FS and CT who often do not have access to D2L) of teacher candidate progress.
- Train FS in the use of evidence based observational feedback and DF (Summer 2015), with ongoing training and training opportunities for CT to follow.
Refinement of the Signature Assignments
Guided by the principles of Danielson Framework and using the results of the curriculum mapping work above, faculty in the Department of Education will form a Signature Assignment Working Group to refine the SAs so they are more fully aligned with the TEP Claims and other PAS assessment instruments. We will engage representatives from each teaching major (e.g., UTEC faculty) in an effort to recalibrate the scoring rubric for the Signature Assessment- Pedagogy as well as strengthening the rubrics for the rest of the SAs in order to provide a wider range of variance in the scores. Our goal is to increase the validity and reliability of the instrument and strengthen the data we collect across the TEP.
Refinement, Alignment & Scoring of the TWS
Guided by the principles of Danielson Framework and using the results of the curriculum mapping work above, we will increase the alignment between the TWS and our Claims. We also need to revise the TWS to more clearly outline criteria for content-specific pedagogy and adapt the TWS to appropriately meet the assessment needs of all teaching majors.
When considering the results of the TWS data analyses, we recognize that as currently structured, individual sections of the TWS do not directly correspond to each of our TEP Claims. Instead, each section aligns with one or more claims. For example, Section 2 (Aligned Unit and
Lesson Planning) supports both the Content Mastery and the Pedagogical & Technological Proficiency claims, and Section 3 (Instructional Planning & Student Achievement) supports both the Pedagogical & Technological Proficiency and the Excellence in Instructional Design & Assessment claims. Therefore, teacher candidates are being assessed in terms of multiple claims using a single TWS section score.
Furthermore, the current TWS scoring protocol results in a low number of points for each section: Total possible points for Section 1 are 15, 9 (Section 2), 12 (Section 3), and 9 (Section 4). Completers must earn a perfect score (100%) on each section of the TWS in order to meet the pass rate expectations when the scores are disaggregated to align with individual claims.
Missing one point on any of the TWS sections results in a score that does not meet the 95% pass rate expectation.
A change in Clinical Evaluators resulted in lower TWS scores across many majors. It is possible that Completers’ performance has stayed relatively constant, and that the evaluation of the TWS has been more rigorous across all majors. However, previous TWS Clinical Evaluators have not necessarily had a background that is specific to the TWS content area under review so we plan to ask our CTs to evaluate the TWS lesson plans, thus serve as the role of content experts supporting the work of the Clinical Evaluators.
Increase Teacher Candidates’ Assessment Literacy
All Pre-Ed Students complete a course in Assessment, Curriculum, & Instruction (general to all education majors) and Secondary Teacher Candidates complete a course in Methods, both of which include opportunities for candidates to develop content-specific assessments. Given that neither course is directly tied to a field experience where assessment is used to inform decision-making regarding teaching, Teacher Candidates will be required to complete the SA – Assessment, where they will create a professional screen-cast that captures the story of key elements in the SA – Assessment (Understanding by Design, alignment/development of pre, formative, and summative assessments, how to differentiate for learner differences in the classroom, data driven decision making (fictitious data) of entire class, small group and individuals, and the planned changes for instruction). The intended outcome is for preservice teachers to share what they know and can do regarding instructional design and assessment to stakeholders.
Strengthen Secondary Candidates’ Classroom Management Skills
We will seek to secure resources to add a section of EDU 342 – Managing the Learning Environment, specifically designed to address the needs of Teacher Candidates in K-12 and 5-12 endorsement levels.
TEP Plan Aligned with CAEP Standard 2
In a focused effort to strengthen and improve our partnerships for clinical preparation, the MSU TEP has developed a plan to work with our partners to co-construct mutually beneficial P- 12 school and community arrangements by engaging in the following program improvement efforts:
Development of Partnership MOUs
- We have signed MOUs for our After School Initiative partners as well as draft MOUs for our partner schools and districts that have been approved by MSU Legal Counsel and will be implemented during Fall 2015. which clarify expectations of all parties involved in the clinical field experiences.
- We are developing partnership agreements to use as needed for out-of-area placement of teacher candidates during student teaching internships.
- We are working with CTs and K-12 administrators to develop unique and innovative clinical opportunities which align with the TEP needs.
- We need to work with our stakeholders to develop a set of more clearly defined characteristics of CTs for placements.
- We need to develop an evaluative tool that can be used by our FS and Teacher Candidates to assess the effectiveness of our CTs.
Improved Communication and Professional Development with Partners
- We have created a Student Teaching Orientation Meeting with panel participation by administrators, CTs, FSs and former teacher candidates.
- We are developing a method to provide weekly emails reviewing recommended strategies and guidance for FSs and CTs.
- We will increase the frequency of our check-in emails with CTs and FSs.
- We will expand our online videocast offerings in a number of topics to address specific needs of CTs and FSs related to the expectations of the TEP.
- We plan to develop a handbook for Practicum experiences based on CT feedback and expectations of the TEP with clearly defined purpose and expectations for what the Teacher Candidate should do during, and be able to do by the end of, each clinical field experience.
- We plan to develop a system in which FSs are assigned to specific schools with office hours at the school to build relationships and institutional knowledge of the partner schools and provide a way for CTs to easily connect with a representative of the TEP in person.
- We are planning to provide professional development for CTs before and during field experiences with ongoing development based on formative assessment.
- We are also considering increasing instructional and field supervision consistency by providing additional training related to content-specific pedagogy and/or limiting the number of field supervisors working with each cohort.
TEP Curriculum Adjustments
- We will structure the K-8 Practicum experiences for stronger alignment with the methods courses and structure the 5-12 and K-12 Practicum experiences to provide more depth and breadth with consistency in scheduling to experience more consistent time in the classroom.
- If issues with specific items of expectations are consistently not met by our pre-service teachers, coursework and field experiences are examined for corrective action.
TEP Plan Aligned with CAEP Standard 3
The MSU TEP recognizes the importance of maintaining and increasing Pre-Ed Student and Teacher Candidate quality, while paying particular attention to underserved communities and underrepresented students. We will address student quality at multiple stages throughout the TEP by implementing the following efforts to improve recruitment and retention of quality educator candidates:
Recruitment Plans
We are developing a plan with specific goals to increase recruitment and support for diverse, high-quality candidates. We will also address hiring patterns within shortage areas by seeking to place Pre-Ed Students and Teacher Candidates in field experiences aligned with those shortage areas. Specifically, we will partner with established organizations/departments and leverage existing networks:
- Our ILEAD program will help us to identify rising university freshmen to recruit from underrepresented populations into the Teacher Education program;
- We will sponsor the establishment and support of Future Educators of America (FEA) chapters in high schools in Montana to increase our outreach network for both field experience placement and recruitment;
- Our dual enrollment course EDU 101 (a course available to any student in any major) has been successful in our local school district. From it, we can continue to recruit potential applicants. We will attempt to increase dual enrollment offerings within the state, with particular emphasis on underserved communities;
- We have a Letter of Commitment from the Troops To Teachers program supporting our efforts to recruit and support high-quality teacher candidates through identifying post-service men and women interested in transitioning into the teaching field;
- MSU’s Cooperative Extension affords the TEP an opportunity to cost-share outreach initiatives and connect MSU Education department teaching faculty and advising staff with rural and reservation communities for the purpose of recruiting potential Education majors;
- The TEP will join MSU representatives at Rockin' the Rez events to promote Teacher Education and recruit underrepresented populations into the TEP;
- We will partner and sponsor student, faculty, and community involvement with the Native American Student Success Initiative on MSU’s campus;
- The TEP will continue its sponsorship of the Native Education major student association, Wanji Oyate (One Tribe) seeking and providing mentoring and support for Native American students in Education.
Admission Standards
The Teacher Education Program will continue to uphold robust admission standards as demonstrated in Table 6 and Table 7. We will not admit students into the TEP with any course grade lower than a C. Students with a 2.75-2.99 GPA who are admitted will participate in a mentoring group (staffed by doctoral students) designed to provide appropriate academic support to them as they begin the process of induction into the profession. We plan to monitor applicants’ progress through the program by tracking Pre-Ed Students’ successful completion of three early field experiences and ask applicants seeking admission to Teacher Candidate status to complete a self-assessment at the end of the three early field experiences to determine strengths and weaknesses accompanied by a plan for continued professional growth.
Admissions Standards Research
We will research admission standards that accurately correlate with predictors of success in the teaching profession. For example, we will correlate the Montana Content Knowledge Assessment with Completer GPA and new Danielson FEPA to identify predictors of professional success.
Non-Academic Attributes Research
We will investigate the efficacy of several instruments for the purpose of monitoring applicants’ and candidates’ non-academic attributes that contribute to teacher success (Kalsbeek, Sandlin, & Sedlacek, 2013):
- Pre-Education Students will complete The Short Grit Scale (Duckworth & Quinn, 2009) and the Teacher Sense of Efficacy Scale (Tschannen-Moran & Woolfolk Hoy, 2001) during EDU 101 to establish a baseline.
- Teacher Candidates will again complete the Teacher Sense of Efficacy Scale during student teaching.
- Induction teachers will again complete the Teacher Sense of Efficacy Scale at the beginning of their second year of teaching.
- The results of the Teacher Sense of Efficacy Scale will be analyzed longitudinally and correlatively with the Short Grit Scale.
Progress Toward Degree
We will document candidate content knowledge and understanding of expectations for the profession through examining the data collected in our Program Assessment System. We will analyze trends in our completer’s Praxis scores, document GPA at admission and completion, and add student scores on the Montana Content Knowledge Assessment to our Program Assessment System. We will also build in a specific component into the Teacher Work Sample to demonstrate expectations for the profession (that aligns with the Danielson component on professional practices) and add this to the Program Assessment System.
TEP Plan Aligned with CAEP Standard 4
The TEP at MSU will seek to demonstrate the impact of its Completers on P-12 student learning and development, classroom instruction, and schools, and the satisfaction of its Completers with the relevance and effectiveness of their preparation. Recognizing that CAEP expects us to document that our Completers contribute to an expected level of student-learning growth, we remain mindful of the Constitution of the State of Montana which clearly delineates citizens’ right of privacy, “The right of individual privacy is essential to the well-being of a free society and shall not be infringed without the showing of a compelling state interest” (Section 10). Furthermore, in alignment with our Constitution, the State Superintendent of Public Instruction has established through Montana policy that direct access to teacher performance data and Completer’s K-12 student achievement data will not be a possibility for the foreseeable future.
Given the likelihood that neither K-12 teacher evaluation scores nor children’s achievement scores will be available to EPPs in the state of Montana, we propose the following plan by which we can demonstrate TEP completer impact and thereby, meet the expectations delineated in CAEP Standard 4.
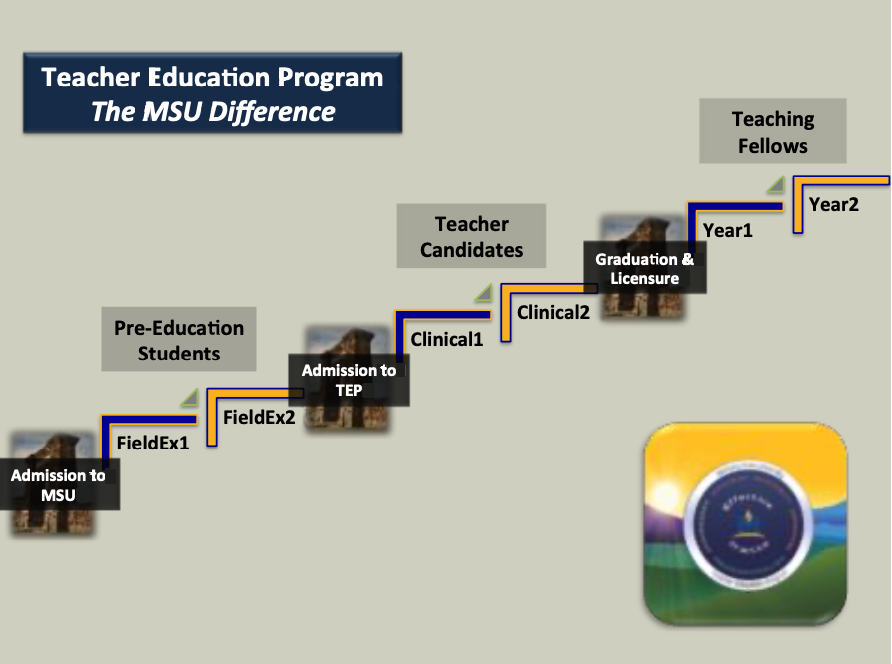
Case Study
We will design a 3 year pilot project in which we will create a MSU TEP Professional Learning Community (PLC) for recent Completers. Participants in this PLC will be referred to as Teaching Fellows (see Figure 5.1). We will study the outcomes of this pilot project using Case Study methodology (Yin, 2014).
- The TEP PLC is well-aligned with MSU’s Mission as a Land Grant University as it will allow us to more fully serve the citizens of our state through strengthening relationships with our stakeholders as well as providing mentoring, support, and increased likelihood of success for our Completers. Furthermore, the TEP PLC will allow us to collect data which will be used evaluate the effectiveness of our program, the impact of our TEP Completers, and guide our ongoing program improvement efforts.
Figure 5.1
Steps to Becoming a MSU Teaching Fellow
Professional Learning Community (PLC) Launch
The steps we will take to develop and launch this PLC include:
- Conduct a needs assessment focus group with recent grads to identify areas where professional development and coaching would be most beneficial and what types of incentives would be most meaningful.
- Investigate the best model for TEP PLC leadership. Options which will be studied for effectiveness
and sustainability include:
- Collaboration with our Regional Educational Service Agencies (RESAs) to coordinate the PLC;
- Department of Education hire a professional staff member to coordinate the PLC;
- Collaboration with the Educational Leadership program to have their graduate students enrolled in EDLD 508--Supervision of Instruction lead the PLC as part of their coursework and leadership preparation;
- Adjust specific TEP faculty members’ workload to include assignment as PLC coordinator. This option could be structured to have one faculty member released from all teaching in order to oversee the PLC or multiple faculty could be released from teaching one class in order to lead a portion of the PLC. In either format, the work of the PLC would be embedded in faculty work and faculty would be actively engaged in the process of supporting our recent Completers.
- Invite a stratified sample of our TEP Completers to become Teaching Fellows and participate in the TEP PLC.
Evidence to Be Collected
Montana’s Office of Public Instruction (OPI) is in the process of developing a State Educator Identification (SEID) number for each licensed K-12 professional in the state of Montana. When this project is operational, we will be able to collaborate with OPI to expand our PAS to include OPI’s data regarding MSU TEP Completers’:
- Hiring rates
- Job placement rates
- Career retention rates
The data we plan to collect in order to study the effectiveness of the TEP PLC and our Completers’ impact include:
- Completer Satisfaction Survey
- Completer self-report of:
- Accomplishments
- Professional advanced study
- Leadership roles
- Professional service activities
- Completer Teacher Efficacy Scale
- Completer Teacher Mindset Scale
- Completer Teacher Resilience Scale
- Completer Measure of Academic Press
- Completer Academic Optimism Scale
- Teaching Observation guided by the Danielson framework and focused on student learning and development
- Personal interview regarding teacher knowledge, skills, and dispositions
- Submission of an Effect Size Snapshot of Student Learning gains – Teaching Fellows submit data from a unit they designed and delivered during their first year of teaching; corroborate with observations
- Employer Satisfaction Survey
Furthermore, on May 28, 2015 the Montana Council of Deans of Education (MCDE) agreed to form an Ad Hoc Group to write a State Response to CAEP Standard 4. MSU TEP looks forward to contributing to this important working group as we develop reliable and valid measures of completer impact that can be administered state-wide to support all institutions’ efforts to meet CAEP Standard 4.
TEP Plan Aligned with CAEP Standard 5
Our Quality Assurance System is presented in Appendix 1. It is comprised of a multi-faceted set of policies, procedures, checks, and balances that serve to maintain, support, and strengthen the integrity and quality of the entire Teacher Education Program. The heart of our Quality Assurance efforts is the Program Assessment System (PAS) which has been constructed by our faculty and stakeholders and is coordinated by our Department of Education Assessment Coordinator in an annual cycle of program assessment. The PAS is comprised of valid data from multiple measures and is used to support our efforts toward evidence-based continuous improvement. We use the results of the inquiry to establish our priorities and improve all program elements and capacity.
- In order to improve our alignment with Standard 5.1, we will be refining some existing instruments, introducing a new instrument based on the Danielson framework, and adding new components to our dataset from the TEP PLC pilot study. We will also develop a Scoring Guide for the Danielson-based FEPA and TWS. We believe these adjustments will provide conclusive evidence that the MSU TEP satisfies all CAEP standards.
- We will continue to annually evaluate the measures in our PAS to ensure they remain relevant, verifiable, representative, cumulative and actionable and continue to produce empirical evidence for valid and consistent interpretations of our data.
- We will continue to employ our annual cycle of program assessment in order to systematically assess our program and Completers against our claims and the CAEP standards. We will regularly assess our innovations and use the findings to make adjustments and improve our TEP.
- Through the development, launch, and study of our pilot project, the MSU PLC, we will work to collect meaningful evidence to demonstrate our Completers’ impact in the classroom. Our analyzed findings will be shared widely and used to support ongoing program improvement.
- We will continue to hold our regularly scheduled stakeholders meetings for the purposes of program evaluation, continuous improvement, and identification of models of excellence.
In conclusion, the Inquiry Brief Self-Study conducted by the Teacher Education Program at Montana State University has provided clear and conclusive evidence to support all program claims about its Completers and has met or addressed every CAEP standard and the cross- cutting themes in a thorough, precise, and rigorous manner.