
MAPS Atlas
A product of the Montana Agricultural Potentials System - is a computer-driven geographic information system (GIS) designed to improve decisions made by people who manage land resources. A GIS can be an effective tool for land use planners, engineers, researchers, agricultural producers, resource consultants, real estate agents, crop insurance agents, crop consultants and others who need information about land resources on a regular basis.
Sample Custom Maps created by MAPS Atlas v5:
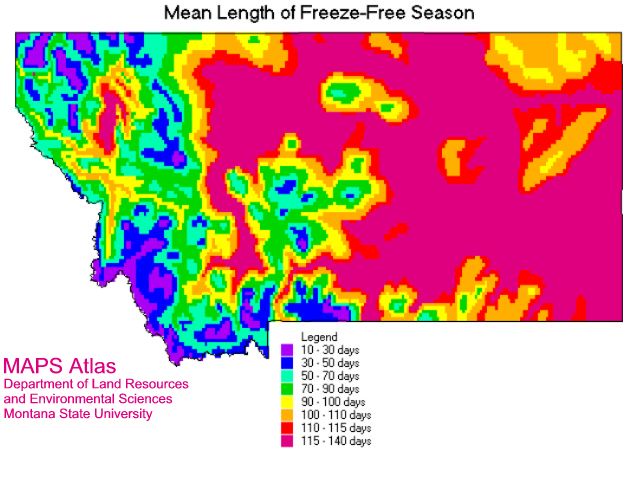
Mean Length of Freeze-Free Season
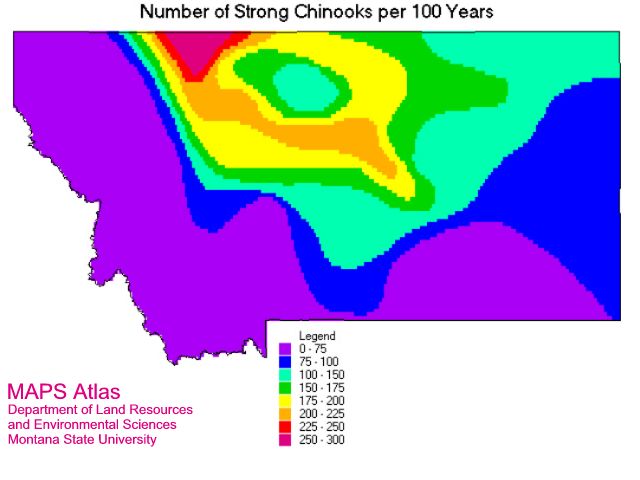
Number of Strong Chinooks per 100 Years
More Information about MAPS Atlas
MAPS Atlas was designed as a planning tool to provide information for people who make decisions about the use of land and natural resources. For example, professionals in construction, land use planning, consulting, energy and mining can use the information for site selection and environmental assessment. Agricultural businesses, researchers and producers can use the information to determine the potential for specialty crops, evaluate crop inputs or examine the potential for chemical contamination of groundwater.
The system divides Montana into about 18,000 cells, each representing slightly more than 3 miles north and south by 2 miles east and west. (The actual cell dimensions are 3 minutes of latitude by 3 minutes of longitude).
MAPS Atlas provides ready access to nearly three million estimates of land and climate conditions in Montana. Realtors can show clients how climate differs between farms, ranches and other properties. Students can quickly gather information for use in reports on Montana environments and land resources. Anyone can use MAPS Atlas to estimate specific climatic conditions anywhere in the state at any time of year.
MAPS Atlas should be used only when site-specific information is unavailable. Most attribute values represent long-term average conditions for the area. Unusual conditions are not represented. Data provided by MAPS Atlas are estimated values derived from maps or extrapolated from specific sites. Actual conditions at specific locations within cells could be very different.
How MAPS Atlas can work for you
Let's say you want to know all dryland crop areas in Montana with average annual precipitation between 10 and 16 inches and an average frost-free season of 100-115 days. The computer will draw a map showing all areas of the state having these characteristics. In all, the computer can combine information from the 18,000 geographic areas in thousands of different ways.
MAPS Atlas can also produce a printout of all 150 attributes and their values for any 2-by-3-mile cell and the eight surrounding cells. A real estate agent could provide this information to a client interested in a particular parcel of land.
The ability to combine various environmental attributes allows land resource managers to use MAPS Atlas for numerous applications. Practical applications include:
- selecting areas to grow specific crop varieties based on performance under similar conditions elsewhere in Montana
- identifying areas where a weed is likely to invade
- locating areas likely to be deficient in certain plant nutrients
- highlighting areas of possible avalanche danger
- identifying potential wildlife habitat areas
- mapping land characteristics that influence water quantity and quality
- generating reconnaissance maps for facilities siting
- evaluating routes for transportation and utility corridors
Once you've chosen the combination of attributes that best serves a specific need, MAPS Atlas can generate a composite map identifying areas in the state with the specified conditions. You can use legal descriptions (township, range, section) or latitude/longitude coordinates to zero in on the parcel of Montana you need information on. MAPS Atlas provides information about average conditions for each cell.
MAPS Atlas: An Important Teaching Tool
Explore Montana via computer
Imagine dividing Montana into 18,000 rectangles (cells) each measuring about two miles by three miles -- and determining the land and climatic characteristics for each one. Then, imagine drawing a map showing all the areas that share any combination of these characteristics. That's what MAPS Atlas does. Imagine how this geographic information system could work in your classroom!
Here's how it works
Let's say as part of a class project, you want to know all the areas in Montana that have potential to grow a certain crop. To determine this you need to know the desired climate characteristics for growing this crop: let's say you're looking for areas with average annual rainfall of between 10 and 16 inches and an average frost-free season of 100 to 115 days. With this information entered, the computer will draw a map showing the areas having these characteristics. It's that simple. The interactive computer program allows your students to make selections and then see the information unfold before their eyes. The possibilities are endless.
Other practical applications of MAPS Atlas for schools include:
- teaching locations of counties and rivers
- showing the difference in climate between east and west of the Continental Divide
- mapping land characteristics that influence quantity and quality of water resources
- highlighting areas of possible avalanche danger
- identifying potential wildlife habitat areas
- charting Lewis and Clark's route through the state and observing the climate, topography and vegetation the early explorers encountered.
Environmental attributes in the database
- Precipitation (annual, monthly, snow, probabilities)
- Growing season (frost-free season, first freeze date, last freeze date, growing degree days and day length)
- Temperature (annual, monthly, maximum and minimum monthly)
- Land use (county boundaries, land cover and land ownership)
- Soils (soil associations, water holding capacity, soil depth, temperatures, pH)
- Physiography (geology, highest and lowest elevation, relief, hydrological drainage basins and slope)
- In all, there are 150 such attributes in the data base.