
Notable Advances in Statistics: 1893-1899
Statistics — Explained & Its Evolution
Statistics consists of three interlinked topics: data, study design, and uncertainty assessment. The field evolved historically in that order, data first and uncertainty assessment last. If we are to understand the evolution of the statistics program at Montana State University, it is necessary to keep track of advances in statistical theory and applications since the university was founded. But first, as a starting point, consider the intellectual and practical status of statistical science before 1900.
Since ancient times, rulers have used statistical data for guiding economic and social decisions. The word “statistics” first appeared in the English language when John Sinclair published his Statistical Account of Scotland (1791), although Gottfried Achenwalt had previously (1749) coined the German word “Statistik” to denote the quantitative information one needs to run a nation state. Estimates of population sizes, agriculture production, etc., were widely used in Europe before the first U.S. census was conducted.
That first U.S. census of six questions was undertaken by federal marshals on horseback in 1790. By 1880 the marshals had been replaced by supervisors and enumerators who had no political affiliation, but the census takers were still on horseback and still riding through largely unknown lands. It took 8 years to tabulate and report the results of the 1880 census. However, the 1890 census report was available in one year because the Census Bureau’s Herman Hollerith created punched card equipment for tabulating the data. Occasional punching errors on the cards created an accuracy problem that was solved by employing a novel capture-recapture sampling method to correct the tabulations.3
Although statistical reports focused mainly on the information needs of government, by the 1800s naturalists and the curious public were measuring and recording environmental data such as temperatures, bird counts, etc. Adolphe Quetelet introduced quantitative methods to the social sciences, leading to the concept of “the average man.” By the end of the 18th century, health and economic data were being communicated by graphs, charts, and tables.
Reliable data were important to society and those who collected and presented the data slowly conceived of purposely designed methods for collection and presentation. Experimental design or study design eventually became a critical component of the statistician's responsibilities. Proper designs would eliminate major sources of bias, allow perspicuous interpretations, and be efficient to execute. Some initial concepts of sampling and study design were introduced before 1900, but the first big advances were developed by R. A. Fisher in the 1920s.
When MSC was founded in 1893, the data and design components of statistical thinking were in place. Prior to the late 1800s, however, little attention was given to measuring the uncertainties that affect data or to inferential judgments via probabilistic reasoning. This is somewhat perplexing given that there had been important advances in the mathematical theory of probability. Scholars knew about laws of large numbers, central limit theorems, and Bayes formula for “inverse probability.” Probability applications were essentially restricted to games of chance and issues of morality and theology. The subjective probability paradigm prevailed; the frequentist interpretation of a probability measure didn’t become established until the 20th century (although A. A. Cournot introduced the frequency notion in 1843).
It is important to note that some valuable statistical theory had been elucidated by 1900. Because of the insights of Legendre, Gauss, and Laplace in the early 1800s, the method of least squares was being used to fit a curve to observations. Least squares methodology was supported by mathematics as well as by practical use; in fact, the normal distribution was well-known and the link of least squares to the normal distribution and to the central limit theorem had been described. Investigators were aware of variability and calculated the average and departures from the average. They constructed frequency plots of their observations and noted the high prevalence of distributions resembling the bell-shaped normal curve. The binomial and Poisson distributions had been studied and mathematical derivations of the normal approximation to those distributions were available.
By the year 1900, a probabilistic concept that gained wide use was the “probable error” for either the distribution of measurements or the distribution of a summary value such as the sample mean. The probable error for a symmetric distribution is equivalent to half the interquartile range. For a normal distribution having standard deviation σ, the probable error is 0.6745⨯σ. Half of the values from the distribution will deviate from the mean of the distribution by less than the probable error and half by more.
Modern historians have uncovered isolated efforts before the mid-1800s that dealt with testing simple hypotheses, interval estimation, maximum likelihood estimation, and utility-based decision-making, but those ideas had to be rediscovered before they were to receive practical application. The philosopher/logician Charles Sanders Peirce, although not greatly influential at the time, did provide the essential ingredients for modern statistics in his books Illustrations of the Logic of Science (1877–1878) and A Theory of Probable Inference (1883). Peirce and his collaborators even described the merits of blinded, controlled, randomized experiments ... in 1884! Practical application of Peirce’s ideas had to wait until they were rediscovered decades later.6
There were some advances by the end of the 19th century that were more quickly-recognized, especially the works of Francis Galton and Karl Pearson, who transformed statistics into a mathematical science for analyzing data in science, industry, and politics. Francis Galton introduced regression to the mean and the concept of correlation. Francis Y. Edgeworth extended those ideas in the context of the multivariate normal distribution and correlation matrices. George Yule tied regression and correlation to least squares theory, introduced the concepts of multiple and partial correlation, and ultimately devised the modern notation for regression analysis. Karl Pearson, who was studying non-normally distributed data, devised his collection of skewed distributions. Before the end of the 19th century, K. Pearson produced the chi-square test for contingency tables and introduced the “standard deviation.”9
By the end of the first era in the history of MSC, inductive reasoning based on the interpretation of statistical quantities through probabilistic thinking was receiving attention. The tools were available for making the leap to modern statistics as an empirical science relying on logic and probability, in addition to purposeful collection and summarization of data.
The Statistics Profession
The subject of statistics had great potential as an academic subject at MSC. The profession of “statistician” was widely-recognized by 1893. Statistics in the western world received a great boost of interest and activity in the 1800’s. In the public policy sphere, “The ‘era of enthusiasm’ in statistics was ... inspired by a new sense of the power and dynamism of society. . . . The statists (statisticians) sought to bring a measure of expertise to social questions, to replace contradictory preconceptions of the interested parties by the certainty of careful empirical observation.”12
In response to the emergence of the new profession of statistics in the 19th century, the precursor of the Royal Statistical Society was established in 1833. The U.S. participated in growing that statistical enterprise, in fact, it set a high standard with its constitutional responsibility of a decennial census. The American Statistical Association (ASA), formed in 1839, is among the oldest continuously operating professional societies in the U.S. The only older are the Massachusetts Medical Society, founded in 1781, and the American Philosophical Society, the oldest learned society in the United States, founded in 1743. 15
Florence Nightingale, the English statistician and founder of modern nursing, became an honorary member of the ASA in 1875. The ASA began publishing the Journal of the American Statistical Association (JASA) in 1888. Early issues of JASA included applications to practically every field of knowledge, but were focused mainly on data, including measuring and recording measurements, managing data gathering enterprises such as the U.S. Census, sampling, organizing and displaying data, creating meaningful indices, etc. By 1900 there 500 members of the ASA, the vast majority living on the East Coast.
JASA articles in the 1890s included:
- whether the census of the U.S. population in 1890 was reasonably correct, JASA 1895, vol4(no28/29):99-102;
- what number of cases is necessary to eliminate variations [of the mortality rate] due to chance and thus reduce the fluctuations [i.e., have a specified small range], JASA 1895, 4(31):300-301;
- a report that Mr. Hollerith said his electric tabulating machine based on punched cards (created using a key board controlled punch machine) soon will be put on the market, JASA 1895, 4(32):358-365;
- what should be included in college statistics courses (see insert below), JASA 1896, 5(35/36):173; and
- ASA Pres. Walker’s address to the membership in which he chastises the federal government for not supporting the training of statisticians and colleges for not developing curricula in statistics, JASA 1897, 5(37):179-187.
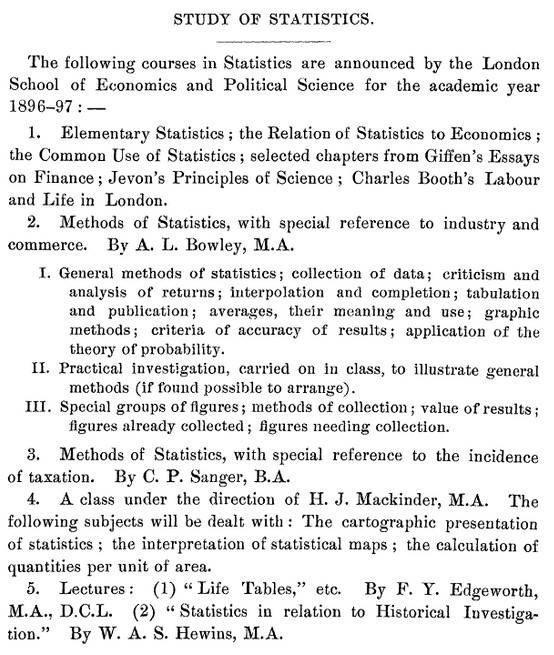
Statistics Course at the London School of
Economics and Political Science, 1896-97
Knowledge of statistical theory in the 19th century was confined mainly to scholars in Europe. One could not expect the faculty of a new university in Montana to teach statistical theory and methods. Bozeman was a modern town in that it had railway service, telegraph and mail services, a library, and a newspaper, but geographic isolation surely put the Montana State faculty members at a disadvantage. To keep up on their areas of expertise, they must have relied on mail correspondence, academic journals, visiting experts, and trips to professional meetings. Curriculum development at Montana State necessarily would lag some years behind for such a rapidly advancing field as statistics. The starting point was to expand its faculty. The first mathematically-trained faculty member (William Tallman) was not hired until 1901.
In future eras, advancements in communication and transportation gradually eliminated the geographical disadvantages. After World War II, the federal government began providing support to universities for science and technology areas, including statistics. Then the MSC statistics program was allowed to grow. Its curriculum began to match the leading edge of statistical practice and its own research contributed to pushing that edge forward.
Advances in Stat during Era 2
Next topic in Era 1
Table of Contents
(Last revised 2021-08-31)