
Statistical & Computational Services for MAES: 1981-1995
by Richard (Dick) E. Lund, MSU Professor Emeritus of Statistics, former MAES Statistician
About MAES (2019)
Montana's Agricultural Experiment Station (MAES) has faculty and supporting staff conducting research and outreach programs addressing crop and animal production methods, market growth opportunities, pest management and environmental quality issues. MAES has seven off-campus Research Centers and local campus farms that address production and production challenges in the diverse agro-ecosystems of the state. Collectively, MSU’s campus farms and seven-off campus Research Centers plus faculty on the MSU-Bozeman campus constitute the Montana Agricultural Experiment Station (MAES) and the MSU College of Agriculture.3
MAES Statistician
MAES Statistician Ervin Smith retired in early summer 1981and the Director of MAES asked me (Lund) to step into his position temporarily. Smith had filled that position for the period 1968-81. While his original appointment to MSU in 1948 was as a dairy scientist, he had completed an additional year or more of course work in statistics at Iowa State during about 1961. I had held a one-fifth time appointment in MAES for the previous five years. In a subsequent competitive National search, my temporary MAES appointment became permanent. Nevertheless, I still carried tenure status and interacted with the Department of Mathematical Sciences.
Introducing the MAES Research Centers
James Welch, the new Dean of the Agricultural College and Director for MAES, arrived in 1980. One of his immediate goals was to upgrade the research capability at the six MAES Research Farms. (I describe their locations later when telling about my traveling to visit them.) An initial step was to change their name. They were to be called Research Centers, not mere farms. They kept and used quite specialized farm equipment and some offered limited laboratory facilities. And most important, Welch was amenable toward purchasing new equipment for them when properly justified as funds became available, such as the microcomputers to be considered ahead.
During my years (1981-95), the MAES Research Centers each employed 3 to 6 professional persons holding MSU faculty rank and listed up to about 10 full-time persons altogether. They hired extra part-time help as needed for farm work. Tenure status for the professionals, when held, was assigned to an academic department of the College of Agriculture and could not be assigned to MAES.
Only one Research Center had livestock, that being a long-time herd of range cattle kept at the Northern Agricultural Center near Havre, MT. Agricultural researchers at Bozemen located their field-crop experiments at the Centers and at many other places across the state. The Post Farm, clearly visible a mere few miles west of Bozeman , has character and purpose about like another one of the larger Research Centers.
Conversely, it may be noted that most regular faculty in the College of Agriculture would hold a part-time appointment in MAES for budgeting purposes, that being determined by the particular research projects in which they were involved and their teaching assignments.
Ordering the Superbrains
Only a few microcomputers and supporting software with capacity for "serious work" had become available by 1981. Near the first day in my new position I made contact with a committee representing the interests of the MAES Research Centers. They were considering a significant purchase of some microcomputers and they were unsure of "what real work that little computer in a black box could do for them."
My knowledge about microcomputers was no more than theirs! I had received an "unknowing experience with something in a gray box" that a local inventive electrical engineer and his son (Don and Richard Weaver, Western TelaComputing) had assembled. The "something" had a wire connecting it to the IBM Selectric typewriter which the secretaries in Math were using. IBM Selectrics used a stored binary code to position the typing element ("ball") across the typed line and thereby was ready-made for control by a microcomputer. One secretary had typed my paper about the One-Credit Modular Statistical Methods Courses for me using the "something," and yes, it certainly did reduce effort for my subsequently modifying an initial rough draft into a finished paper. I was to learn that the "something" would soon be called a microcomputer and the software it ran was a word processor.
Someone on the committee asked me whether a version of MSUSTAT could be developed for a microcomputer? I talked to someone in the Computer Center, perhaps Ric Roche, I don't remember, and I gave the committee a limited assurance that it could be implemented. The glibness of my optimism became apparent a half year later!
The committee decided to proceed with their purchase. MAES held an uncommitted $40,000 received recently from oil production royalties from a well on the Eastern Research Center property. Nevertheless, considerable argument remained to get approval by the MSU Board of Regents and the MT State Purchasing Officer. Here too, several persons regarded microcomputers to be frivolous toys.

5.25 inch floppy disk
Nine microcomputers and supporting equipment were soon ordered, one for each of the six Research Centers, one for the Station Statistician's office and a couple for the Dean and Director's office. Naively we thought, why would we ever need more than these? Was not one new big main-frame computer sufficient for the campus?

Intertec Superbrain mcrocomputer 1979
More specifically, we ordered Intertec Superbrain microcomputers (about $3500 each). They utilized a Z80 8-bit processor accessing 64k RAM and ran on a CP/M operating system provided by Digital Research. They were equipped with two 5.25" 360k floppy diskette drives (see photo). Floppy diskettes were the ubiquitous storage devices of the time, it based on a rotating disk of thin flexible coated plastic material enclosed in a protective sleeve lined with fabric to remove dust particles.
The purchase order included 7or 8 DECwriter model LA-120 line printers and enough 110 baud acoustic modems for communication with the campus by telephone line. The competing bid was awarded to Western TelaComputing located in Bozeman. This was the little local company that had been renting the Teletypes to MSU and handling their frequently needed repairs.
The new microcomputers were expected to arrive in late 1981. I needed training; all staff in agriculture needed training. I needed to find help, and find it quickly! After an advertised search which netted three knowledgeable applicants, I was fortunate to recruit Richard Roche (Ric, photo below) into a two-thirds time position and away from his full-time position in the MSU Computer Center. Ric was the only expert on micro-computers at MSU at that time, he being self-trained.
Determining My Mission
The Station Statistician's mission, as apparently perceived by Ervin Smith, judging by the work he did, consisted largely of processing data upon demand on the main-frame computer. He employed several undergraduate students and other staff to punch cards, list and check data entry, and "push" data through the main-frame computer. Few of his students or staff had more than an elementary background in statistics. They used many special-purpose procedures, often written by his student employees over past years. Sometimes SPSS and MSUSTAT were utilized for special analyses.
His data processing service generally was offered free, but restricted by his limited budget. That service was unavailable to many agricultural researchers. He seemed to be providing much of his service to the small-grains variety trials centered on campus within the Plant and Soil Science Department, though having many experimental plots scattered across the State.
My new mission as I defined it, would greatly reduce the involvement of the Station Statistician's office in direct "hands-on" data processing. Instead, I would apply my experience and expertise toward encouraging researchers to process their own data, or perhaps hire it done under their own supervision as appropriate. The new microcomputers would play a dominant role in that new approach.
I believed that I should emphasize the same kind of help I had been providing through my earlier one-fifth time appointment, though now for more people. For agronomic research as an example, I would provide expertise in designing research, determining appropriate field-plot size and how plots are best laid out, how many replications are needed to obtain reliable results, etc. And then for data collected, I could help researchers set up their data analysis scheme and carry that through actual processing. I would help them interpret the results the computer produced. I did not want to get "bogged down" with simply supervising a room of data entry-persons and then "pushing" data through a computer.
My Ever Valuable Staff and Students
My personnel budget spanning my years at MAES, that is my staff and me, generally added up to the equivalent of two and one-half positions. I myself, counted for one faculty member. Another regular now, Ric Roche, an expert in microcomputers and supporting equipment, worked at a two-thirds rate. He stayed on in MAES for many years after I retired. The remaining "one-half plus one-third time" budget employed only temporary people. Sometimes I employed two half-time graduate student assistants, other times, just one graduate assistant and one half-time faculty member. Often that half-time faculty position was shared among three one-sixth time persons.
I chose graduate assistants and part-time faculty nearly always from the statistics program in Mathematical Sciences. I worked out deals with Tiahrt, now Department Head of Mathematical Sciences. He always proposed excellent choices, people who could provide valuable help to us as well as to profit themselves from the experience of working with agricultural staff and graduate students. I "farmed out" these statisticians to special projects that frequently emerged across agriculture, and I thereby had to provide very little direct supervision.
Altogether, Drs. Mike Huffman, Henry Lee, Ron Christiansen, Bill Quimby, Ric Rossi, John Boyer, Pat Munholland and Steve Cherry, all statisticians holding full-time positions in the Department of Mathematical Sciences, worked for the MAES Statistician at various times on 1/6 time appointments during the 1982-92 period. They made significant contributions to MAES, but also acquired valuable experience having bearing on their future teaching and research in statistics. I sometimes traded my teaching of courses over in Math in exchange for their work in agriculture.
My office generally employed two to four part-time undergraduate students too. That count expanded to meet specific current needs, with their payroll sometimes coming from my budget, or perhaps from work we agreed to do for others. The undergraduate part-time students worked directly for me or Ric. We preferred students with some computer experience. These generally came from the program in computer science or other engineering. I did retain those few students working for Ervin Smith that first year. If you count just people, I employed many, up to eight persons at times, all part-time but me.
Visiting the Research Centers
I aimed to visit each of the six Research Centers twice each year for one or more days. This could be done in one grand loop, going east to Huntley (east of Billings), further eastward to Eastern (near Sydney), back to Central (near Moccasin, or say, a little west of Lewistown), further north to Northern (near Havre), on west to North Western (south of Kalispell), down to Western (outside Hamilton) and finally home. Sometimes I would stop at the Fort Keogh Livestock and Range Research Center (a U.S. Agricultural Research Service unit, near Miles City) on the way to Sydney.
That total grand loop would add up to about 1,600 miles. Usually however, I divided my visiting into two shorter trips away from Bozeman, upon considering travel and the time needed at each Center. I had obligations at Bozeman too, and did not want to be away more than about a week at any one time.
A big gathering of staff from all Centers was held each summer at one of the Centers. I usually attended it too. This function could often be tied into a sequence for my visits to some of the Centers. Attendees often brought their spouse, and a few their whole family. I brought my Lillian, and on most of my other trips too. She could "spell me" on the driving those long distances and was helpful in many other ways, often helping me remember about what I had discussed with researchers. These days were long and tiring, but still enjoyable too. We saw a lot of Montana!
These visits enabled me to see field layouts for experiments, perhaps equipment used in applying the treatments and for harvesting, how they processed the material collected, and generally, many of the important attributes that may effect the research. After having seen the experiment in field, I could engage more meaningfully in discussion about a project. I would be more able to understand a researcher's questions, possibly brought up by an unexpected phone call a few months later when he/she was deep into data analysis. And too, my name was attached as a co-author on some papers produced by this research. I felt I should have some knowledge of the details for what was studied!
Briefly, Computer Software Used in MAES
Forthwith, I shall give considerable space to telling about my MSUSTAT computer software, it having my special interest. From what follows, it may appear that MSUSTAT became the most frequently used software in agriculture. Rather than that, particular software use depended upon a rapidly increasing computer capability and expanding software availability, as well as the particular data analysis problem. User learning, that is computer-software-savvy, was an equally important determinant and that grew too.
SPSS, the main-frame version of MSUSTAT and sometimes even BMDP still found some use in all agricultural departments on campus in the early 1980s. Researchers in Agricultural Economics often used a software piece having the "zippy" name Shazam for their econometric modeling. Statisticians unfamiliar with econometrics would likely relate their modeling to multivariate multiple regression. Shazam has continued to be available commercially since 1977.
Researchers in the Animal Science Department, when studying livestock breeding programs, needed to estimate indices of genetic prodigy performance. These are calculated from estimates of variance-components in large mixed-model sets of equations. Iterative methods for solution were developed by others (e.g., C. R. Henderson for maximum likelihood estimates) and shared across the Nation among these researchers, and as such, are beyond possible description here. Some in Animal Scientists used software titled Harvey's Least Squares for analysis-of-variance problems with unequal subclass numbers. It has since been incorporated into SAS.
MSU bought a DEC VAX (Digital Equipment Company) model 11/780 in 1981 as part of an upgrade of their computer hardware. Finally with this purchase, MSU researchers had access to SAS by 1983 which had become "an accepted standard" for much agricultural research across the Nation. It was unavailable to MSU researchers prior to that time for lack of a SAS version for the old Sigma 7.
I assigned Huffman, he a one-sixth time statistician from Mathematical Sciences, to give special attention to promoting SAS use. He both led workshops on SAS operation and consulted with individuals on statistical problems. Agricultural researchers at MSU were very slow to move over to this main-frame version of SAS. I too never did learn to use it, rather, I waited for the microcomputer version which became available in 1987.
I tell more of MPEP database software development later for the small-grains variety trials, thereby replacing Ervin Smith's data processing crew. The Research Centers had no direct means for data processing except by old hand-operated rotary calculators. They had to come to Bozeman to use the main-frame computers.
Those Superbrains are Coming!
Dropping back to Fall 1981, my first year as MAES Statistician, our immediate software purchases included an appropriate number of copies of WordStar word processors for writing letters and reports, SpellStar, DataStar and SuperSort, all from MicroPro International, SuperCalc spreadsheets from Sorcium and Dbase II data-base processors from Ashton Tate. Ric ordered a sufficient number of copies of these and bought a big supply of extra diskettes. And then, we formatted a big supply of empty diskettes and made many backup copies. My office was busy!
Wayne Knapp was hired, a talented undergraduate student in engineering with considerable experience and a high interest in early microcomputers. My other training support included two able statistics graduate students, Suzanne Strasser and Lori Ellis, and I found other student help as needed. My daughter Martha even helped in an emergency a few days. (see Martha's cartoon drawing below.)
We set up training sessions, and then more training sessions, serving agriculture staff on campus, including secretaries. Staff from the off-campus Research Centers came, bringing too, their secretaries. Training included using a word processor, entering data into spread sheets, and transmitting data and letters by phone line (to each other and back to the campus). Some staff, ones who had never yet typed their own letter, returned home with their new microcomputer, a phone-line acoustic modem and a line printer. And then, we answered questions, and more questions, and offered more advanced "hands-on" sessions.
Ric and Wayne led the training effort and served as consultants, answering the numerous questions of new users. But also, Ric and Wayne played a key role in converting the main-frame version of MSUSTAT into one fitting into microcomputers. We referred to the conversion task at hand as one of "shoe-horning" code into an insidious black box, feeling our way in the dark by sticking a pencil into a few holes, a party game!
MSUSTAT required about 128k of RAM memory on the Honeywell CP-6 (It having replaced the Sigma 7 in 1981). And that requirement did not count the space in the run-time library which MSUSTAT accessed frequently. We had to fit everything into the 48k of RAM remaining on the Superbrains after loading its operating system. Compiled MSUSTAT machine code, that which the computer used, nearly filled two of the 360k diskettes in use at that time.
Almost no software development tools existed for microcomputers at that early time. We often made use of the CP-6, with its comprehensive debugging capability, to emulate operations and validate results. Ric and Wayne developed our own overlay-loading system. MSUSTAT was divided into about a dozen files which we loaded onto three diskettes. These diskettes were swapped in-and-out of one Superbrain drive upon computer demand, depending upon which procedure in MSUSTAT the user had selected. The second diskette drive was reserved for data input and for preserving output of processing-results. The system was clumsy, but it worked, actually quite well!
MSUSTAT offered about 35 different statistical procedures at that time. Its menu can perhaps best be described as one fitting the processing needs of the fifteen One-Credit Modular Statistical Methods Courses (navigate to modular course list in Chronicle of the Statistics Program: 1977-1990). A trial microcomputer version of MSUSTAT was made available within six months to MAES researchers in mid1982. And of course, we provided more training sessions! Refinements continued over the next year.
The impact of the microcomputers upon Research Center staff was immediate and dramatic! They had felt separated from MAES activity on the campus, the neglected orphans of the MSU agricultural research system. They were intimately involved in producing the basic data for a many cooperative projects. But such data were sent to Bozeman and out-of-their hands for analysis. Campus-based members of the research team easily dominated the analysis, arrival at conclusions and report writing. Research Center researchers were suddenly advanced ahead of staff on campus into microcomputer use. Many on campus failed to perceive the added efficiency a microcomputer could bring into their research effort and paid little immediate attention to what we were doing.
The new microcomputers enabled direct data entry and validation by the researcher who had recorded that data out in the field. He/she could then interact with the statistical processing, sometimes by using spreadsheets, perhaps following up on some obscure evidence of a new relation, or perhaps finding data-entry errors or other perturbations that someone on-campus would never catch. These could have led to quite erroneous conclusions.
We felt sufficiently proud of our accomplishment that I demonstrated MSUSTAT operation on a Superbrain at the 15th Interface of Computer Science and Statistics (1983, Houston, TX). My submission describing MSUSTAT was published in February 1984 issue of The American Statistician 34:317. Complementary reviews appeared in national publications.
Over time, the microcomputer revolution found its way into many places on campus. A dBase associated system called MPEP was developed by Richard King upon a multi-user microcomputer (not a Superbrain) to facilitate data processing for the numerous standardized cropping field trials. It provided labels for seed packets, randomized planting plans, field books for recording data, and finally, a standard analysis with summarizing reports. MPEP took the place of the work Ervin Smith and his students had been doing earlier, that which I abandoned as quickly as possible. And, MPEP did the job much more efficiently. Procedures in MSUSTAT could be called for some more specialized analyses when appropriate.
Early on, Ric and the Dean's office attempted to set up a periodic phone-call routine to the Research Centers by which they could send paperwork back and forth by using the 110 baud acoustic modems. The Dean's office had one typewriter that could be connected to a computer by this time, which enabled letter quality output when needed. Most of the Research Centers still only had the LA-120 line printers. Of course research data could be sent this way too in a pinch, but simply mailing diskettes was much more efficient. The Research Centers could also operate the main-frame computer by modem too, but there seemed to be very little demand for that. There were no scanners in use by then either. With the generally poor phone service available to the "quite rural" Research Centers, attempted communication with the campus by telephone line and acoustic modem generally was slow, but a good idea yet to mature in another 15-20 years into the future.
MAES was clearly at the forefront of this change, both on the campus and in the outlying research centers. Our MAES seemed to be ahead of many other Land Grant agricultural programs too, a leader, not a follower! More new microcomputers arrived with regularity as budgeting permitted. Availability of MSUSTAT and the training we provided played an important part in this revolution.
Forever Changing
Both software and computer hardware changed rapidly. Those "flakey-overheating-hang up prone" Superbrains were replaced by more reliable IBM-XTs in summer 1983. These came with 10mb fixed disks and ran on Microsoft's new MS DOS operating system. The new IBMs came with 256k RAM, which we could easily increase to 640k. I bought my own IBM-AT for use at home in 1985, paying nearly $5,000 for one running two 5.25-inch floppy disk-drives. Ric commented wryly one day, "We could attach a chain to the Superbrains now; they would make good boat anchors" – but we moved them into a lab room for student use!
Further hardware upgrades to vastly superior operating system configurations occurred on about a two-year cycle. MSUSTAT progressed through version 3.00 and then into 4.00 by about 1987, with availability of far superior Fortran compilers from Microsoft and other new developmental software. We added graphic capability to the 4.00 version of MSUSTAT.
A Microcomputer Version of SAS
Microcomputer capability had expanded such that a version of SAS fitting the more advanced microcomputer models became available in 1986. This SAS version ran in a Microsoft Windows operating system (slow and obnoxious at first, but MS Windows did become the future). MSU obtained a site license for this new microcomputer version of SAS in 1987. It provided single copy distributions to individuals on campus for under $100 per year.
We bought a copy and provided SAS in the microcomputer lab room we operated for students and staff. And again, more training was offered. Slowly, more and more agricultural staff and students started using SAS in the microcomputer version. The gradual turn over of faculty brought new staff to the campus who were already familiar with SAS, but not familiar with MSUSTAT.
SAS could handle larger more intricate problems than MSUSTAT. SAS offered more procedures and options. Citing the use of a SAS procedure in a research paper offered more prestige than citing MSUSTAT. Occasionally, a researcher would use MSUSTAT for most data analysis and then turn to SAS for the final run when the exact kind of run to be made had been determined (possibly with my help to set up the control commands for SAS). MSUSTAT was easier to use and faster for exploratory work. Graphical output was especially difficult upon SAS and was seldom obtained from it. Instead, the numeric output from SAS often was transferred by hand into spread sheet software for making graphical displays.
I carried a copy of SAS with me as I traveled around to the Research Centers and encouraged its use when appropriate. Here again, there was more training. Statisticians over in Mathematical Sciences ended their use of MSUSTAT for their statistical methods courses in the mid 1980s. They wanted their students to learn to use SAS and other popular commercial software even if they were harder to use.
The costly-to-operate main-frame Honeywell CP-6 and the Dec VAX were being phased out at about this time. I was giving most of my attention to the agronomic side of MAES, that implying microcomputers. Persons in Animal Science and Agricultural Economics likely were most affected, but now they did have the microcomputer version of SAS to use, and that gave them good motivation to learn to use it. Its likely that I would have assigned one of the part-time faculty from Mathematical Sciences to look in on Animal Science. I do remember a young woman, Kathyran Olson just down the hall from my offices, frequently carrying big packets of computer listings up and back downstairs from Donald Kress's office (in Animal Science).
Distribution of MSUSTAT Away from MSU
Many other low-capability statistical packages fitting microcomputers appeared early in the 1980s, and then disappeared with equal rapidity, in the first half of the 1980s. Few possessed a capacity equivalent to that of MSUSTAT for real work on real data in a real research environment.
MSUSTAT was supplied to MSU staff and students at no cost. We copied it ourselves at first. A provision was developed later for direct copying by others over the MSU computer network. The MSU Bookstore distributed the User's Guide for a price sufficient to cover publishing and distribution costs, at about $18 for later versions. Agricultural researchers often took a copy of MSUSTAT with them when they started a foreign assignment.
Demand for purchasing a copy developed off-campus. Most sales of MSUSTAT could be attributed to one satisfied user telling another. A few universities and small colleges purchased site licenses. Newer versions were demonstrated at a few professional meetings. Recognizing this demand, a few advertisements were run in The American Statistician, The Agronomy Journal and similar journals.
An arrangement had been made with the Research and Development Institute (RDI) to distribute the software. (RDI is a non-profit institute associated with MSU. It originated as a means to administer and share profits from MSU inventions, both with the inventor and to support further MSU research.) We sold a little less than about one hundred copies per year over the 1984-88 period. After a while, I started inserting pins on a world map showing its use – from the Samoa Islands on the left, and way across to the Fiji Islands on the right. After deducting promotional and distributional costs, my share amounted to very little monetary reward for my overtime-overwork effort to keep development going. But that gave me a feeling of doing something important, even beyond the campus!
Use of MSUSTAT was clearly declining toward the end of 1980s, yet it had a base of loyal users who liked to use it, both at MSU and off-campus. The main-frame version was never revised and had disappeared long ago. I had to decide whether to abandon further development of MSUSTAT altogether or invest a little more effort into another upgrade. There were data processing necessities that agricultural researchers seemed to require, but were not readily available in SAS. Microsoft had developed another "splendid" new Fortran compiler, a software library with many graphical procedures, and software providing an efficient program-development environment. But before telling about the phase-out of MSUSTAT, I want to tell you more about the "fun" in being the MAES Statistician.
Fun in being the MAES Statistician
I very much enjoyed my years being the MAES Statistician, that being eleven years full-time before official retirement (1981-92) and another three-year phase-out at one-third time (1992-95). Having grown up on an irrigated farm in central Wyoming, raising livestock, harvesting crops, handling farm equipment, even driving teams of draft horses during the World-War II era – agriculture remained deep in my roots! I could experience that same fun in dealing with agricultural researchers when attempting to draw reasonable inferences from their laboriously collected data. And too, producing that "ever necessary" p-value which foretold the next step, possibly a journal publication, or moving forward in next year's research, or even abandoning that effort. I use fun here as a substitute for "extended satisfaction and a feeling of accomplishment and not going home hating my work!"
Annual Conferences for Plant Breeders –
Researchers developing new varieties, that is the "plant breeders," and many other agronomic people held a late winter conference each year on-campus with many coming in from the Research Centers. Perhaps fifty people altogether would be involved in some parts of the proceedings. There would even be some party atmosphere, that being so worthwhile to promoting cooperation among people working together, and remembering when the boss's pickup got stuck in a muddy field. They would be going over tables of mean values for several variables for wheat, barley, some oats, in later years lentils, etc., most of these produced by the MPEP crew, they working on the first floor of Leon Johnson Hall.
Turning now to hard red winter wheat directed toward bread baking in particular, the experimental data source would look about like that of E. J. Wellhausen, MAES Bulletin 365, 1938 (navigate to data presentation in Era 3:1919-43). He was concerned with yield for 9 varieties for up to 14 years. Current researchers in the meeting at hand would likely be considering up to 15 varieties (some only identified by a genetic-crossing code) raised at say 15 locations. Response variables included not just yield, but also protein, stalk length and strength, pest resistance, even baking quality, etc. (My kids enjoyed those little loaves Charlie McGuire's baking lab produced.) The MPEP people produced these pages and pages of means.
Discussion would concern how well, say, wheat A performed in comparison to wheat B, both overall and across the various locations, locations here more interpretable as growing conditions. In statistical nomenclature, they looked not only at the main effect of A versus B, but more importantly the interaction of variety by growing conditions. The p-value generated for any single experiment under any single growing condition had almost no interest whatsoever, except perhaps to tell whether that site produced reasonably reliable data. The wheat breeders for A and B wanted to decide which should go forward into further research next year, or perhaps go all the way into the "seed increase program" for possible recommendation to Montana wheat growers at some future time after a predetermined number of years of good performance. These were important decisions!
I've never seen any applicable p-values ever generated, nor ever used, by a collection of plant breeders like this. Rather it seemed more reasonable and efficient use of valuable researchers time for them to consider the 15 response values for the 15 varieties at the 15 locations and reach an ad hoc conclusion! They remembered the relative responses for A and B in earlier years under different growing conditions too. The human mind can be a great integrator of many pieces of information. Often ranking of varieties was shown on paper and they may have selected the best. I did teach the technical statistical methods for ranking and selection of the best and included little subroutines for such in MSUSTAT, but I doubt anyone ever used these in this collective-reasoning process.
These were important conferences and I considered them fun, a time of much learning for me about research across the Station and I believe my being there was sometimes helpful too.
Designing Experiments and Data Collection Schemes –
Very seldom was I involved in helping someone actually design a simple textbook-level experiment. MAES researchers did, nevertheless, generally keep their designs simple, and they used a good one in a field layout with which they were familiar year after year. A replicated latin square, a balanced incomplete block, a fully balanced lattice – "never heard of them!" Yes, there were simple split-plots in use. MAES had adequate land space for agronomic experiments, that enabling keeping uniform soil conditions by moving locations in and out of experimental use. Every research center maintained its own weather station.
Rather, my help was most often requested when adding dimensions to some simple design such as repeating it at several locations, or adding some additional treatment factors, and even allowing nature to set the levels for a factor. With modern computational power, they could add several covariables, classifying or continuous as needed. Too, there was the need for salvaging experiments that "turned bad." And, mere data collection schemes for "nature's experiments" can have many attributes of textbook designs, though possibly with the use of two or more different experimental errors being appropriate.
Expanding on this, for some researchers more adept at "throwing everything" into one grand general-linear-model run, with independent variables being both classifying factors and continuous covariables, and then relying on the single generated "large-sample" based p-value seemed to be a continual problem. These could lead to an hours-long argument! Simplifying the argument by looking at the few means for one particular factor and thinking about these as coming from a simple split-plot design and with recognition that it requires a special error estimate for the whole-plot factor, could help at times.
These challenges were fun and I usually felt helpful. I will return to this kind of statistical service after introducing an advance to a new way for calculating an ANOVA.
A Notable Advancement in Calculating an ANOVA
Fisher conceived the idea of an ANOVA and the F-distribution early-on in the 1920s while employed at the Rothamsted (Agricultural) Experiment Station. Use of an ANOVA has become ubiquitous to most statistical analyses since then. A step forward for doing the calculations was published by Payne, R. W. and G. N.Wilkinson (1977) "A General Algorithm for Analysis of Variance." Applied Statistics, 26:251. They used what has become known as the Wilkinson Sweep, which has many advantages over the usual hand-calculator based formulas for intricate ANOVAs.
The only known currently available commercial statistical package using the sweep, of which I know, is Genstat. It was developed by "many" at Rothamsted Research. I started implementing that algorithm into MSUSTAT in about 1990 and I bought a copy of Genstat for MAES for validating my progress. Rather than describing the sweep, I merely want to show the advantages it brings by use of examples. And, I will use the symbolic nomenclature offered in Rogers, C. E. (1973), "Interpreting Structure Formula," Alg AS 65, Applied Statistics, 22:414-424, to declare structural statements. Referring to Heiberger, R.M. (1989), Computation for the Analysis of Variance, John Wiley & Sons, 683 pages, may help understanding.
I had tried to demonstrate this methodology in couple of seminars presented over in Mathematical Sciences. One good student "piped up," why don't you just tell us that the Wilkinson Sweep has "magic" in its works! I'll end with an example where you too might think that.
I base my explanation upon a text-book level introduction to split-plot and strip-plot factorial designs given on page 327 in Statistical Methods ( 8th edition, 1991, Snedecor, G. W. & Cochran, William G., published by Wiley-Blackwell). The example shows data produced by an experiment having 3 alfalfa varieties, that being the whole-plot factor, from which cuttings were taken on 4 dates, the split-plot factor. Yield of hay was recorded for 6 adjacent blocks. A copy of the text is not needed to follow along. Note that the computer will read 3x4x6=72 yield values. The data file will show a yield value and three identifying codes for each record.
Split-plot designs are noted for offering lower precision for the whole-plot factor, here variety, that is offset by greater precision for the split-plot factor, here cuttings and its interaction with the whole-plot factor. Thus, one expects two error M.S. in a correctly calculated ANOVA. Variability in yield perhaps can be explained by the typical variability in soil where nearby whole-plots are more alike than those farther apart and the same nearness implication carries into split-plots. Of course, blocking should be laid out perpendicular to any general soil gradient to remove that effect. This familiar physical feature of soil is why I like to use a soil background for consulting about experimental designs.
Now, any "good" statistical package, after once telling it where to find the codes for blocks, variety and cutting date (cdate) from the viewpoint of treatments alone, will recognize that it is dealing with a two-factor factorial, no matter the design! And that is just what MSUSTAT does by issuing the prompt in capitals, followed by the user's reply in bold, where the vertical line operator | says the factors are crossed:
FITTED TREATMENT STRUCTURE = VARIETY | CDATE
the detailed identical declaration VARIETY + CDATE + VARIETY*CDATE would be equality acceptable, though longer. Too, that same statement should be equally correct no matter what experimental design is used, and it is.
The variability within the block is the basis for the error M.S. for variety which is randomized within blocks. The error M.S. for both cutting date and its interaction with variety would be based on a randomization within the whole plot which is specified by the combined coding values for both block and variety. A slash line / symbol declares that whole-plots are nested within the blocks. So once again MSUSTAT issues a prompt for that structure in capitals and the user here responds in bold.
BLOCKING & ERROR STRUCTURE = BLOCK/BLOCK*VARIETY
The operator * takes precedence over operator /. Using parentheses for clarity of (BLOCK*VARIETY) would be equally acceptable. MSUSTAT interprets these two structural statements to produce an ANOVA having three strata, the first showing variation between blocks, the second relating to variation between whole-plots within blocks, and the third relating to variation between split-plots within whole-plots, but calling that final one the units stratum and naming its variation merely "residual."
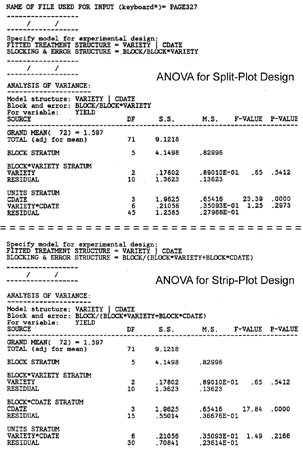
Page 326 in Snedecor and Cochran shows the layout for randomly selected whole-plot positions for the first two blocks. All that is needed to turn this experiment into a strip-plot design is for a "lazy" mower operator to select at random a strip at a right angle physically to varieties and to mow directly across all three alfalfa varieties within each block. These randomly selected strips elevate the main effects of cutting date into a new "whole-plot like" stratum, it being crossed with the "whole-plot like" variety stratum. Recognize too, that the computer needs to know nothing about these physical layouts; it just interprets specified commands.
Here for a strip-plot specified by its cutting-date, the BLOCK*CDATE compound identifies that by the block and cutting date codes. It also would be nested in blocks. The MSUSTAT prompt and response line would read:
BLOCKING & ERROR STRUCTURE =
BLOCK/(BLOCK*VARIETY +BLOCK*CDATE)
An extraction from MSUSTAT operation is shown for this too.
MSUSTAT performs a "dummy" analysis before running the actual data. It will display, hopefully, helpful messages describing any non-orthogonality. And too, it will indicate the capability to run a re-analysis-sweep process in some instances. It is by use of the "re-analysis" that MSUSTAT provides for handling "balanced incomplete block experimental designs."
More Fun in being the MAES Statistician
I especially enjoyed attending the Conferences on Applied Statistics in Agriculture at Kansas State University. These were first started by statisticians at KSU in the late 1980s. I made a presentation at about half of these. Dallas E. Johnson at KSU posted a challenge at the 1991 meeting in the form of a "messy data set." It came from an experiment set out by a soil scientist (I assume at KSU) which used six blocking and treatment factors in an intricate crossing and nesting arrangement which can be seen in the displayed diagram (below, with MSUSTAT's ANOVA output).
One treatment factor, irrigation at two levels is fully confounded with replication at two levels. Gypsum at two levels is applied in strips across both levels of irrigation. The third treatment factor, "previous crop" at four levels, appears as entries in two latin squares, one for each level of irrigation (or replication here). One blocking factor, row pair or RP at four levels, codes for rows of the latin squares and another named column block, or CB, codes for columns of the latin squares. I do not know the actual response variable, but instead used the random values for yield generated by SAS with YIELD = RANNOR(123479), which Johnson also had used. Fortunately, the layout was fully "balanced."
After spending a while looking at the problem, thinking and trying a few MSUSTAT test runs, I arrived at structural declarations:
FITTTED TREATMENT STRUCTURE = PC | GYP | IRR
BLOCKING & ERROR STRUCTURE = REP + RP + REP /
(RP+CB)/(REP*RP*CB) + RP / (RP*GYP) / (REP*RP*GYP)
Computer run time was nearly immediate, under three seconds, and output was appropriately organized into nine strata, when the program was run on a Zenith-386/20 with a math coprocessor.
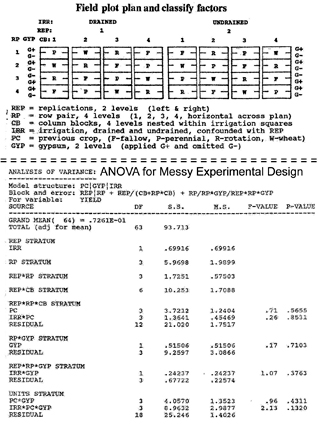
An equivalent analysis with SAS GLM using the command file produced by Johnson for producing the needed sum-of-squares required three minutes and produced 150 pages of output from which I still needed to calculate MS and F ratios by hand. Yes, I could check my solution that way!
My poster paper at the 1992 conference appears as a refereed publication in Applied Statistics in Agriculture, Proceedings of the 1992 Conference on Applied Statistics in Agriculture, June 1992. A paper in more detail labeled Contribution J-2820 from MAES may possibly be more easily accessed. Something like this could be an interesting fun party game for a group of statisticians.
My Mission Changing
If asked what I did over the extended decade as MAES Statistician, I probably would say that half or more of my time went for statistical service (talking to researchers about their work and providing, hopefully, useful answers). This service could be divided about equally between time on campus and that for the Research Centers (both on and off campus, with much unproductive travel time here too). Another fourth can be related to data processing (initial training on microcomputers, creating a microcomputer version of MSUSTAT and its many upgrades, more training again and again, helping some Research Center people use SAS, etc.).
Supervision of my few and sometimes many employees, and paperwork fits into the last fourth. Time to keep up-to-date on advances in statistics fits here too, but that time seemed to be rationed thinly for me. I was allowed, and even encouraged to attend one or two professional society meetings a year. My budget supported travel to one, and earnings from such sources as sales of MSUSTAT, provided for another. I was expected to be involved in some original research resulting in publications. About a third of these seemed to fit into statistics and computer issues and the rest were coauthored with an agricultural collaborator.
Lund's Retirement
I retired from my full-time position in MSU/MAES on March 31, 1992. In April, I would be turning 60 years old and I had been employed at MSU about 23 years. With other university positions, this added up to about 31 years. I accepted a one-third phase-out position for three more years and retired fully from Montana State University in 1995. The Board of Regents recognized my service through awarding the title of Professor Emeritus of Statistics, and gave further elevation in status as being an "unpaid MSU employee" (a little green card I still proudly carry). I finally packed-up and moved out of my office in Linfield Hall in 1997.
Yes, I did accept the prospect for one more upgrade of MSUSTAT, working over about the 1990-93 period, calling it version 5.20, it producing the analyses previously shown. I added a general-linear model procedure and called that version 5.25. It would have been necessary in the previous messy-design problem if much "unequal numbers" were confronted. The MSU Library retains a copy of the manual for the new version.
After retiring, many friends on campus occasionally called for assistance upon special problems in which I had distinct expertise or a residual interest. I continued to handle a few local and off-campus requests for MSUSTAT over the next five years. Most off-campus requests came from outside U.S. The MS Windows operating system has fully replaced MS DOS. MSUSTAT could only be started-up by the RUN command, which I still use on an old computer running on the MS Windows XP version.
It has always been a surprise to me, after years into the 2000s, for someone to tell me that they still use MSUSTAT to do something. An upgrade to MS Windows 10, with its 64 bit coding even removed the RUN command possibility. Here now is a job for a good "hacker!"
Next: Era 9 (Stat Program)
Table of Contents
Last revised: 2021-09-04