
Planning and Carrying out Investigations
|
Planning & Carrying Out Investigations
Science and Engineering Practices |
|
|
BUILDING
AWARENESS Framework Rationale |
Scientists and engineers investigate and observe the world with essentially two goals: (1) to systematically describe the world and (2) to develop and test theories and explanations of how the world works. In the first, careful observation and description often lead to identification of features that need to be explained or questions that need to be explored. The second goal requires investigations to test explanatory models of the world and their predictions and whether the inferences suggested by these mod- els are supported by data. Planning and designing such investigations require the ability to design experimental or observational inquiries that are appropriate to answering the question being asked or testing a hypothesis that has been formed. This process begins by identifying the relevant variables and considering how they might be observed, measured, and controlled (constrained by the experimental design to take particular values). From A Framework for K-12 Science Education, 2012, p. 59 for the entire text. |
|
BUILDING
AWARENESS QUESTIONS
|
1. From the background information, what new awareness do you have about asking questions?
2. In a 3-Dimensional classroom, who do you think needs to be asking questions?
3. What questions did the background raise for you? 4. Upack this Practice by identifying the verbs and nouns in the description. Is
your list similar to this?
|
|
EXPOSING BELIEFS |
Planning & Carrying Out Investigations podcast |
|
EXPOSING BELIEF |
1. What are your current beliefs about this practice?
2. In what ways do you think you are using this practice?
3. What challenges do you see to using this practice?
|
|
CONFRONTING
BELIEFS
|
Conceptual Change Activities: Planning and Carrying Out Investigations Activity #1: Marshmallow Catapult Challenge
Planning and Carrying Out Investigations Activity #2: Pringles Challenge
Planning and Carrying Out Investigations Activity #3: Data Collection Method Report |


Developing Conceptual Understanding of Planning and Carry Out Investigations Activities Background
The purpose of the following activities is to engage teachers in the Practice of Planning and Carrying Out Investigations. The emphasis is NOT on the activity itself, but rather the conceptual change related to the practice. Consumers of the Toolkit are reminded to not get wrapped up in the activity, but rather continually reflect on the conceptual nature of the Practice to gain deeper understanding. Two activities have been provided to engage in each Practice.
Planning and Carrying Out Investigations Activity #1: Marshmallow Catapult
Student goal: Design and build a Popsicle stick catapult to launch mini marshmallows across the room into a paper cup with accuracy.
Teacher goal: Give students goal, materials, parameters, and opportunities to plan and carry out discussions without assistance.
Once students understand the parameters of the phenomenon, have them write a PLAN, which includes, but is not limited to the following:
Introduction
Necessary materials
Step by step plan for catapult design
Description of the data collection
Timeline of the investigation
Example of data collection strategy (tables, graphs, etc)
How the results will be reported
Students then carry out the investigation
Possible Materials:
-
Plastic spoons
-
Popsicle sticks
-
Rubber bands
-
Masking tape
-
Paper cups
-
Mini-marshmallows
-
Measuring tapes
-
Tablet to video-record launches
-
Calculator
-
Bulls-eye
Possible resources for teachers:
*Show the “Punkin Chunkin’” video to give students an idea of what catapults looks like and to discuss failures, challenges, and perseverance. http://www.sciencechannel.com/tv-shows/punkin-chunkin/videos/knockin-on-steel.htm
-
Differentiating for Primary: no limitations on supplies (teacher discretion) → possibles focus: measurement; cause/effect
-
Differentiating for Intermediate: limit amount of rubber bands, tape, and Popsicle sticks → possible focus: measurement; forces; percents; simple machines
-
Differentiating for Middle: supplies have prices; students have limitations on how much they can “spend” on materials → possible focus: measurement; velocity; force; angles; potential and kinetic energy
-
Differentiating for High: supplies have prices; students have limitations on how much they can “spend” on materials; aesthetics; set distance → possible focus: force; energy; physics; angles of trajectory
|
REINTERPRETING
BELIEFS |
Debrief the activity by focusing on the conceptual understanding of the practice using the following prompts: |
|
REINTERPRETING
BELIEF
QUESTIONS
|
1. In what ways did this activity change your beliefs about planning and carrying
out investigations?
2. How could you assist students in refining this practice?
3. What are the key components in planning and carrying out investigations that students need? |
|
INTEGRATION OF
THE CONCEPT
QUESTIONS |
1. How do you currently help students with planning and carrying out investigations
in your classroom?
2. What do you currently teach that lends itself to engaging students in this practice?
2. Review a recent lesson you taught and evaluate the effectiveness of engaging students in planning and carrying out investigations. |
|
INVENTION
QUESTIONS
|
1. Ask a colleague to observe one of your lessons OR video yourself teaching and
reflect on your application of this practice.
2. Use the EQuiP Rubric for Lessons & Units: Science to evaluate a recent science lesson you taught. |
Planning and Carrying Out Investigations Activity #2: Pringles Challenge
Introduction
Necessary materials
Description of the data collection
Timeline of the investigation
How the results will be reported
Students then carry out the investigation and share the results.
|
REINTERPRETING
BELIEFS
|
Debrief the activity by focusing on the conceptual understanding of the practice using the following prompts: |
|
REINTERPRETING
BELIEF
QUESTIONS
|
1. In what ways did this activity change your beliefs about planning and carrying
out investigations?
2. How could you assist students in refining this practice?
3. What are the key components in planning and carrying out investigations that students need? |
|
INTEGRATION OF
THE CONCEPT
QUESTIONS
|
1. How do you currently help students with planning and carrying out investigations
in your classroom?
2. What do you currently teach that lends itself to engaging students in this practice?
2. Review a recent lesson you taught and evaluate the effectiveness of engaging students in planning and carrying out investigations. |
|
INVENTION
QUESTIONS
|
1. Ask a colleague to observe one of your lessons OR video yourself teaching and
reflect on your application of this practice.
2. Use the EQuiP Rubric for Lessons & Units: Science to evaluate a recent science lesson you taught. |
The following activity has been used with undergraduate students. The purpose of its inclusion here is to show a model of how to engage learners in the planning and carrying out investigations practice.
Assignment: Data Collection Method Report
Your Data Collection Method Report will consist of the following sections:
-
Introduction/Overview of Study
-
Methods(choose your own order of presentation of the following)
-
Subject name
-
Scientific and common name
-
Description of subject: physical & life history traits
-
What have you already learned about them after conducting 1 hour observation (doing ethogram)
-
Describe Sampling Rule(s)* to be used; indicate if already used
-
Describe Recording Rule(s)* to be used; indicate if already used
-
State hypothesis(es) being explored and any prediction(s) that arise from hypothesis(es)
-
Timeline/plan for data collection; can include time already spent if study in progress
-
Example of data collection sheet
-
Data summary plan
-
Data analysis plan
-
Summary
-
Thoughts, ideas, comments about the methods you are planning to use and your confidence in those methods
-
Any other comments (optional); can include your reflections on this process and lessons learned, issues or concerns, etc.
* Should be one of the methods described in Chapter 5, Recording Methods in Measuring Behavior by Martin and Bateson
Format of Report – Please follow the guidelines already explained for the previous two reports, with the following exceptions:
Pages: Minimum of 1 full page of text; maximum of 3 pages. Any tables, pictures or other type of graphics are not included in page limits.
Sources: Please follow guidelines already provided for in-text citations and reference list.
Brief Overview of Nonparametric Methods
(directly from http://www.statsoft.com/textbook/nonparametric-statistics/#brief)
Basically, there is at least one nonparametric equivalent for each parametric general type of test. In general, these tests fall into the following categories:
-
Tests of differences between groups (independent samples);
-
Tests of differences between variables (dependent samples);
-
Tests of relationships between variables.
Differences between independent groups. Usually, when we have two samples that we want to compare concerning their mean value for some variable of interest, we would use the t-test for independent samples); nonparametric alternatives for this test are the Wald-Wolfowitz runs test, the Mann-Whitney U test, and the Kolmogorov-Smirnov two-sample test. If we have multiple groups, we would use analysis of variance (see ANOVA/MANOVA; the nonparametric equivalents to this method are the Kruskal-Wallis analysis of ranks and the Median test.
Differences between dependent groups. If we want to compare two variables measured in the same sample we would customarily use the t-test for dependent samples (in Basic Statistics for example, if we wanted to compare students' math skills at the beginning of the semester with their skills at the end of the semester). Nonparametric alternatives to this test are the Sign test and Wilcoxon's matched pairs test. If the variables of interest are dichotomous in nature (i.e., "pass" vs. "no pass") then McNemar's Chi-square test is appropriate. If there are more than two variables that were measured in the same sample, then we would customarily use repeated measures ANOVA. Nonparametric alternatives to this method are Friedman's two-way analysis of variance and Cochran Q test (if the variable was measured in terms of categories, e.g., "passed" vs. "failed"). Cochran Q is particularly useful for measuring changes in frequencies (proportions) across time.
Relationships between variables.To express a relationship between two variables one usually computes the correlation coefficient. Nonparametric equivalents to the standard correlation coefficient are Spearman R, Kendall Tau, and coefficient Gamma (see Nonparametric correlations). If the two variables of interest are categorical in nature (e.g., "passed" vs. "failed" by "male" vs. "female") appropriate nonparametric statistics for testing the relationship between the two variables are the Chi-square test, the Phi coefficient, and the Fisher exact test. In addition, a simultaneous test for relationships between multiple cases is available: Kendall coefficient of concordance. This test is often used for expressing inter-rater agreement among independent judges who are rating (ranking) the same stimuli.
Descriptive statistics.When one's data are not normally distributed, and the measurements at best contain rank order information, then computing the standard descriptive statistics (e.g., mean, standard deviation) is sometimes not the most informative way to summarize the data. For example, in the area of psychometrics it is well known that the rated intensity of a stimulus (e.g., perceived brightness of a light) is often a logarithmic function of the actual intensity of the stimulus (brightness as measured in objective units of Lux). In this example, the simple mean rating (sum of ratings divided by the number of stimuli) is not an adequate summary of the average actual intensity of the stimuli. (In this example, one would probably rather compute the geometric mean.) Nonparametrics and Distributions will compute a wide variety of measures of location (mean, median, mode, etc.) and dispersion (variance, average deviation, quartile range, etc.) to provide the "complete picture" of one's data.
Ensure that each illustration has a caption; caption should be at the top of the figure. A caption should comprise a brief title (not on the figure itself) and a description of the illustration. Keep text in the illustrations themselves to a minimum, but explain all symbols and abbreviations used.
Number tables consecutively, with Arabic numerals, in accordance with their appearance in the text. Each table should have a caption with a description of what the table describes. Place footnotes to tables below the table body and indicate them with superscript symbols. Be sparing in the use of tables and ensure that the data presented in tables do not duplicate results described elsewhere in the article.
Check that all references in the text are in the reference list and vice versa, that their dates and spellings match, and that complete bibliographical details are given, including page numbers, names of editors, name of publisher and full place of publication if the article is published in a book. For papers in the course of publication, use 'in press' to replace the date and give the journal name in the references. Cite unpublished manuscripts (including those in preparation or submitted), talks and abstracts of talks in the text as 'unpublished data' following a list of all authors' initials and surnames. Do not include these in the reference list.
The full URL should be given. Any further information, if known (DOI, author names, dates, reference to a source publication, etc.), should also be given.
EndNote (http://endnote.com/downloads/styles) and Reference Manager (http://refman.com/downloads/styles). Using plug-ins to word processing packages, authors only need to select the appropriate journal template when preparing their article and the list of references and citations to these will be formatted according to the journal style which is described below.
Reference style
All citations in the text should refer to:
-
Single author: the author's name (without initials, unless there is ambiguity) and the year of publication;
-
Two authors: both authors' names and the year of publication;
-
Three or more authors: first author's name followed by "et al." and the year of publication. Note that 'et al.' is not in italics.
Do not use commas to separate the author's name from the date. Use lower-case letters to distinguish between two papers by the same authors in the same year (e.g., Packer 1979a). List multiple citations in chronological order (e.g. Zahavi 1972; Halliday 1978; Arnold 1981a, b), using a semicolon to separate each reference.
References should be arranged first alphabetically and then further sorted chronologically, if necessary. More than one reference from the same author(s) in the same year must be identified by the letters "a", "b", "c", etc., placed after the year of publication. To help readers locate 'et al.' citations with the same first authors in the reference list, list references with three (or more) names after those with two, by date, as in the following sequence: Marin & Silva 1992; Marin, Silva & Lopez 1986; Marin, Lopez & Silva 1989
Use the following system for arranging your references:
Robinson, M. H. & Robinson, B. 1970. The stabilimentum of the orb web spider, Argiope argentata: an improbable defense against predators. Canadian Entomologist, 102, 641-645.
Bailey, N. J. 1981. Statistical Methods in Biology. 2nd edn. London: Unibooks.
Emlen, S. T. 1978. The evolution of cooperative behaviour in birds. In: Behavioural Ecology (Ed. by J. R. Krebs & N. B. Davies), pp. 245-281. Oxford: Blackwell Scientific.
Smith, J. K. 1985. Investigations on a freshwater crab. Ph.D. thesis, University of Durham.
Johnson, A. R. 1999. Scent marking in hyaenas: reply to Jones. Animal Behaviour, 57, F41-F43.
Note that journal titles in the reference list should be written in full.
Work accepted for publication but not yet published should be referred to as "in press". References concerning unpublished data and "personal communications" should not be cited in the reference list but may be mentioned in the text.
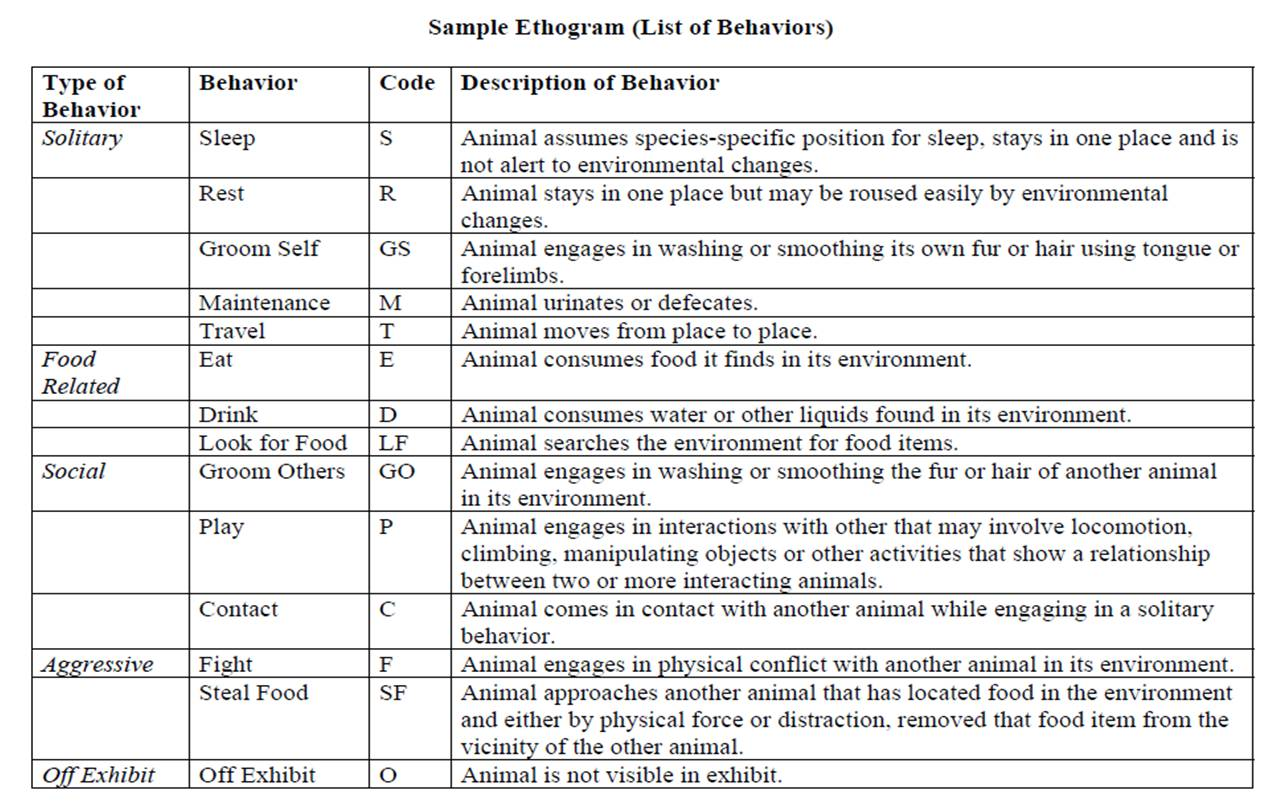
Ethogram Example
|
REINTERPRETING
BELIEFS
|
Debrief the activity by focusing on the conceptual understanding of the practice using the following prompts: |
|
REINTERPRETING
BELIEF
QUESTIONS
|
1. In what ways did this activity change your beliefs about planning and carrying
out investigations?
2. This is an example of a higher level investigation. What changes would you make
for it to work at your instructional level?
3. What are the key components in planning and carrying out investigations that students need? |
|
INTEGRATION OF
THE CONCEPT
QUESTIONS
|
1. How do you currently help students with planning and carrying out investigations
in your classroom?
2. What do you currently teach that lends itself to engaging students in this practice?
3. Review a recent lesson you taught and evaluate the effectiveness of engaging students in planning and carrying out investigations. |
|
INVENTION
QUESTIONS
|
1. Ask a colleague to observe one of your lessons OR video yourself teaching and
reflect on your application of this practice.
2. Use the EQuiP Rubric for Lessons & Units: Science to evaluate a recent science lesson you taught. |
Learning Progressions for Planning and Carrying Out Investigations
Elementary: Students’ experiences should be structured to help them learn to define the features to be investigated, such as patterns that suggest causal relationships. The plan of the investigation, what trials to make and how to record information about them, then needs to be refined iteratively as students recognize from their experiences the limitations of their original plan. Students should have opportunities to carry out careful and systematic investigations, with appropriately supported prior experience that develop their ability to observe and measure and to record data using appropriate tools and instruments.
Middle School: Students’ should be asked to develop a hypothesis that predicts a particular and stable outcome to explain their reasoning and justify their choice.
High School: All hypothesis should be based on a well-developed model or theory. In addition, students should be able to recognize that it is not always possible to control variables and that other methods can be used in such cases - for example, looking for correlations.
See p. 7 Appendix F Science and Engineering Practices in the NGSS for a more thorough grade band progression.
Asking Questions in Science & Defining Problems in Engineering
Planning & Carrying Out Investigations
Using Mathematics & Computational Thinking
Constructing Explanations & Designing Solutions
Obtaining, Evaluating & Communicating
The Toolkit was developed through the Montana Partnership with Regions for Excellence in STEM Grant. The contents of this version of the Toolkit have been modified from the original.