Mountains & Minds: Learners and Leaders
Learning
Goal:
MSU prepares students to graduate equipped for careers and further education.
Objective L.1:Assess, and improve where needed, student learning of critical knowledge and skills.
Metric L.1.1: By 2019, MSU will achieve targets for mastery of disciplinary knowledge as developed in departmental learning assessment plans.
Technical note: Every department at MSU defines learning outcomes for its major and minor programs at all degree levels and assesses the extent to which mastery of those objectives is met. These data currently reside at the departmental level and will need to be collected and reported centrally. Departments are currently required to file a report on how their assessment plans were reviewed and changed each year, and that report could become a vehicle for measuring this metric.
Metric L.1.2: University measures of undergraduate student mastery of critical thinking, oral communication, written communication, quantitative reasoning, understanding of diversity and understanding of contemporary issues in science will be developed by 2014. Targets set in learning assessment plans will be met by 2019.
Technical note: The Core Committee has been updating the Core learning outcomes for the past year in preparation for developing direct assessment plans for the Core. Assessing Core areas will start next year, with all Core areas assessed in the following two years.
Objective L.2: Increase graduation rates at MSU.
Metric L.2.1:By 2019, the bachelor’s graduation rate will increase from 51 percent to 65 percent as measured by the six-year graduation rate.
Technical note: The most used measure of graduation rates at four-year universities is the proportion of the first-time, full-time freshmen cohort that completes a bachelor’s degree within 150 percent of the traditional completion time. The graduation rate at Western land-grant institutions ranges between 32 percent and 67 percent. The average is 54 percent. For the incoming class of 2005, the graduation rate at MSU was 51 percent. Increasing this to 65 percent will place MSU among the top Western land-grants for graduation rates. The first-time, full-time freshmen graduation rate is available each fall at http://www.montana.edu/opa/facts/gradrate.html. Comparison figures are taken from each institution's Common Data Set (CDS), available on each school's website.
Metric L.2.2: By 2019, the number of graduate degrees awarded will increase from 548 to 625 per year. The number of doctoral degrees awarded will increase from 56 to 80 per year.
Technical note: Growing to 625 represents approximately a 15 percent increase. These figures are available online at http://www.montana.edu/opa/facts/quick.html#Degrees. The 2010-11 figure includes 491 masters, 1 specialist, and 56 doctoral degrees.
Metric L.2.3:By 2019, the number of associate degrees conferred will increase from 38 to 70 per year. Workforce certificates conferred will increase from 35 to 65 per year.
Technical note: MSU Gallatin College awarded 38 associate degrees and 35 workforce certificates (e.g.
welding and bookkeeping) in 2012, only its second full year of operation as a college.
As the current programs mature and new programs are added, the number of degrees awarded
should nearly double. An increase to 70 associate degrees awarded represents approximately
a 10 percent per year increase in each of the next six years.
These figures are available online at http://www.montana.edu/opa/facts/quick.html#Degrees.
Metric L.2.4:By 2019, the first time, full time freshmen fall-to-fall retention rate will increase from 74 percent to 82 percent.
Technical note: The most-used measure of retention at four-year universities is the proportion of the first-time, full-time freshmen cohort that enrolls in the second fall semester. The retention rate is a leading indicator of graduation rates, and therefore, provides a more immediate measure of student academic success. The average retention rate at Western land-grant institutions ranges between 71 percent and 84 percent. The average is 77 percent. For the fall 2010 freshman cohort, the fall-to-fall retention rate at MSU was 74 percent. Increasing this to 82 percent will move MSU into the top echelon of western land-grants for freshmen retention. The first-time, full-time freshmen retention rate is available each fall at http://www.montana.edu/opa/facts/gradrate.html. Comparison figures are taken from each institution's Common Data Set (CDS), available on each school's website. The MUS calculates a different retention rate that includes students who transfer between MUS institutions, but we will not have national benchmarks for that number.
Objective L.3: Increase job placement and further education rates.
Metric L.3.1: By 2019, the percent of graduates employed full time in their field or in positions of their choosing will increase from an average of 62 percent to 70 percent.
Technical note: Graduates are surveyed one year after graduating from MSU. This figure represents the percent of all responding degree recipients who report full-time employment in the major field or field of their choosing. Nearly all (84 percent) MSU graduates are employed within a year of graduating, and 94 percent are employed, in graduate school, or otherwise not looking for work. These figures come from data in the Career Destinations Survey. The Career Destinations annual report shows all employed graduates, not just those employed in their field or in a position of their choosing.
Metric L.3.2: By 2019, the percent of graduates pursuing an advanced degree will increase from an average of 21 percent to 25 percent.
Technical note: Graduates are surveyed one year after graduating from MSU. This figure represents the percent of all responding bachelor degree recipients reporting current enrollment in graduate school. For many students, graduate school follows immediately after earning an undergraduate degree. For other students, time in the work force or following other pursuits is both more appropriate for the student and more desirable for the graduate program, but it is difficult to track graduates once they have left the institution. Because there is variance in the desirable timing of graduate enrollment, MSU seeks only a modest growth in immediate enrollment. Over the last four graduating classes, this number has moved between 17 percent and 25 percent. These figures come from data in the Career Destinations Survey. Some in graduate school also report full-time employment and are counted in Metric 2.1.
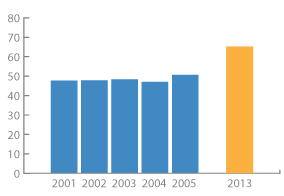
Metric L.2.1:Percent of Incoming Students who Graduate Within Six Years
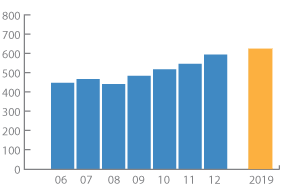
Metric L.2.2:Graduate Degrees Awarded
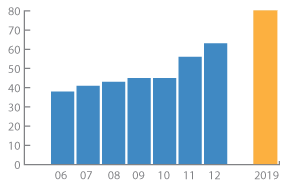
Metric L.2.2:Doctoral Degrees Awarded
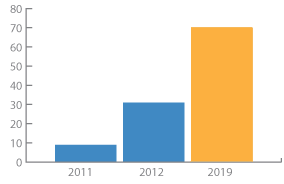
Metric L.2.3:Associates Degrees Awarded
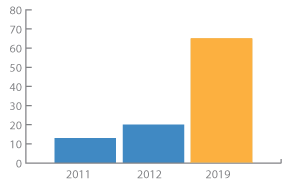
Metric L.2.3:Certificates Awarded
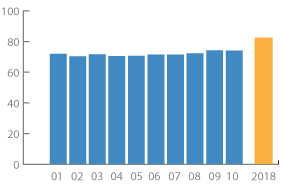
Metric L.2.4:Percent of Incoming Students who Return for Second Year.
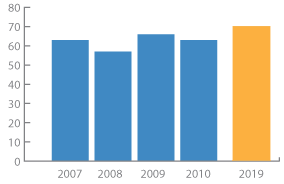
Metric L.3.1:Percent of All Graduates Reporting Employment in Major or Field of Choosing
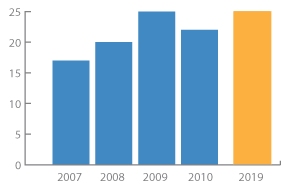
Metric L.3.2:Percent of All BA/BS Recipients Reporting Enrollment in Graduate School
