
Educator Needs Assessment
September 2021 (c) MSU Science Math Resource Center and Montana NSF EPSCoR
You can download this report as a PDF (3.7MB) or read it in its entirety below.
This report is also available in ScholarWorks.
Executive SummaryThe Science Math Resource Center (SMRC) in the Montana State University Department of Education is devoted to the advancement of STEM teaching and learning. The Center provides professional development for K-12 educators of rural, tribal and urban communities; conducts educational research; and offers STEM programming opportunities for youth of all ages. As part of the Education-Outreach-Diversity team for Montana NSF EPSCoR, SMRC seeks to advance the program’s goal of building competitiveness in Montana science and engineering research and development. This report is an encapsulation of the professional development needs and interests of Montana K-12 educators, with a particular emphasis on teachers of STEM subjects (science, technology, engineering and mathematics). We believe these findings provide a unique opportunity for Montana University System researchers and others with access to STEM resources to strategize on how those resources can be shared with the K-12 education community, thus advancing the broader impacts of our research. Findings in this report can also offer insights to school administrators, other professional development providers, and agencies that support classroom teachers. This report shows that
The report also provides detail on topics that rank highly in both interest and importance for STEM teachers. These should be strongly considered for future programming opportunities:
K-12 teachers also reported that they are interested in connecting with the university
research enterprise, |
Survey Contributors: Venice Bayrd, Digital Library Initiatives Department, Montana State University and Tom Franta,School Services of Montana
Survey Reviewers: Carli Cockerell, Montana Office of Public Instruction, Marilyn King, Bozeman Public Schools and Tricia Seifert, Department of Education, Montana State University
This material is based upon work supported in part by the National Science Foundation EPSCoR Cooperative Agreement OIA-1757351. Any opinions, findings, and conclusions or recommendations expressed in this material are those of the author(s) and do not necessarily reflect the views of the National Science Foundation.
Correspondence concerning this article should be addressed to Suzi Taylor, Science Math Resource Center, PO Box 172804, Bozeman, MT, 59717-2804. Email: [email protected]
Introduction
In early 2020, the Montana State University Science Math Resource Center and Montana National Science Foundation Established Program to Stimulate Competitive Research (NSF EPSCoR) partnered with School Services of Montana to conduct a needs assessment survey of Montana K-12 educators to better serve their needs for professional development (PD) opportunities. Primary and secondary goals of the survey are listed below.
Primary Goals
- Understand the PD landscape for Montana K-12 educators: Do they have adequate access to high-quality professional development? Are some geographic areas more in need than others? Are some grade bands or subjects better served than others? Are educators taking advantage of PD offerings that are provided?
- Discover what general PD topics are of interest to educators, particularly in the context of science, technology, engineering, and mathematics (STEM).
- Explore Montana K-12 educators’ preferences for PD, including time, duration, location, and delivery method (online, hybrid, face-to-face, etc.).
Note: As we describe below, the survey was launched just prior to the COVID-19 pandemic, when face-to-face PD was safe and common.
Secondary Goals
- Discover how to better connect the K-12 education community with the research findings of Montana NSF EPSCoR, a statewide research infrastructure-building effort with a current research focus on water quality.
- Specifically, probe educators’ interests in using authentic research data sets from NSF EPSCoR and other ongoing research projects within the Montana University System.
The administration of this survey and its potential to inform the future development of both classroom resources and PD materials align with the Montana NSF EPSCoR strategic plan of serving the entire state (see Appendix A). While the secondary goals are aimed toward specific NSF EPSCoR interests, we feel the data from both the primary and secondary goals will add value to the Montana University System research enterprise in general, as researchers often strive to share the broader impacts of their work with the education community.
The 2020 needs assessment survey built upon previous work undertaken by the MSU Science Math Resource Center (Grimberg & Hendrikx, 2013). The 2020 survey was launched in an online format using MSU’s Qualtrics software on March 9, 2020 and was scheduled to close April 17, 2020. The survey was advertised immediately and widely via School Services of Montana, the Science Math Resource Center, the Montana Girls STEM Collaborative, Montana Science Teachers Association, Montana Office of Public Instruction, the MSU Department of Education, and other statewide venues, through newsletters, social media, and other channels.
And then COVID-19 hit. Less than one week into launching the survey, MSU informed its students that university classes would be online following its spring break (March 16-20). K-12 schools across the state also responded rapidly, with most moving to 100% remote learning for the remainder of the semester. With educators scrambling to prepare for remote teaching and adjust to the “new normal,” we believe that taking an online survey dropped precipitously on educators’ priority lists. By March 12, 2020—the day of Montana’s State of Emergency declaration and just three days after the opening of the survey—41% of responses had already been submitted (n=121). Far fewer responses were submitted throughout the remainder of March immediately following the State of Emergency declaration (n=36, 12%), but submission counts rebounded through mid-April (n=138, 47%).
Though we cannot determine whether and how educators’ responses were affected by the pandemic, we are quite sure survey participation was adversely impacted—especially in the days following the State of Emergency declaration. However, we were able to secure enough responses to conduct a meaningful data analysis, though we do note minimal responses from certain educational categories, including engineering (n=18), career/technical (n=24), and computer science (n=25) (Participants could multi-select all that apply).
An additional potentially detrimental impact of the COVID-19 pandemic is educators’ reported preferences for PD, as this question set relates to one of the primary goals of administering the survey. It is reasonable to imagine that educators’ preferences for PD during both pre-COVID-19 and post-COVID-19 time periods may not be identical. Previously, online and hybrid PD—though less common—may have been seen as flexible and desirable. Perhaps under the new conditions, online learning may have seemed onerous, or—considering the rapid switch—possibly more realistic and/or approachable.
At the time this survey closed in mid-April 2020, no one dreamed that COVID-19 would impact our schools in such a profound way for more than a year. While participation numbers may have been adversely impacted, COVID-19 response was at that time a very new phenomenon, and thus we suspect that this survey data is generally reflective of a pre-COVID-19 time. In fact, we might almost view this data as one of the last “snapshots” of educator attitudes toward PD in the pre-COVID-19 world.
Table of Contents
Methodology
Descriptive Statistics
- Educator and School District Characteristics
- Access to Technological Resources
- School/District Strengths and Weaknesses That Impact PD Implementation
- Barriers to Professional Development
- Attitudes Toward STEM Professional Development
- Professional Development Location and Delivery Method Preferences
- Professional Development Time and Duration Preferences
- Importance of Professional Development Topics
- Interest in Professional Development Topics
- Usefulness of Data Set Resources and Interest in Water Quality Data Sets
- Interest in Resources Related to University Research
Two-Way Relationships
Findings by Teaching Assignment Subject Type
Findings by Teaching Assignment Grade Level
Findings by Hours of STEM Professional Development in the Past 12 Months
- Attitudes Toward STEM Professional Development
- Importance of Professional Development Topics
- Interest in Professional Development Topics
Findings by Locale
- Access to Technological Resources
- Barriers to Professional Development
- Professional Development Preferences
Findings by Proximity to MUS Campus
Discussion and Implications
- Hours of Professional Development in the Past 12 Months
- Access to Technological Resources
- Barriers to Professional Development
- Attitudes Toward STEM Professional Development
- Professional Development Preferences
- Importance of and Interest in Professional Development Topics
- Usefulness of Data Set Resources
- Interest in Resources Related to University Research
Conclusion and Recommendations
References
Appendices
Appendix A: Montana NSF EPSCoR strategic plan
Appendix B: Survey questions
Appendix C: Additional school/district strengths/weaknesses that impact PD implementation
Appendix D: Additional comments about PD preferences
Appendix E: Additional PD topic interests
Methodology
Sample
The population examined in this survey included all K-12 educators in Montana, with the initial sample including 295 Montana K-12 educators. However, since educators were able to skip questions without selecting a response, missing data was prevalent. Listwise deletion (i.e., removing all participants with at least one missing response) was not a sensible option as this would have omitted all but 37 educators. Thus, we opted to remove all participants that did not complete the survey and/or had missing responses on over 50% of the survey questions. This resulted in a final sample size of 208 Montana K-12 educators. Since our sample contains missing responses, sample sizes for each subset of survey questions range from 168 to 208.
Instrument
The survey administered on March 9, 2020 contained 153 questions (see Appendix B). The survey included questions regarding: (a) educator characteristics, (b) school/district characteristics, (c) school/district strengths and weaknesses, (d) attitudes toward STEM PD, (e) PD preferences, (f) barriers to PD, (g) importance of and interest in PD topics, (h) usefulness of data set resources, and (i) interest in resources related to university research.
Modifications The leading survey question asks educators to provide the grade level(s) (i.e., K-2, 3-5, 6-8, and/or 9-12) and subject(s) (i.e., arts, career/technical, computer science, elementary education, engineering, English language arts, mathematics, science, social studies/history, technology, and/or other) that they currently teach.
Due to the sample size in this report, the many possible response combinations to this survey question created extremely small sample sizes in regard to specific types of educators (e.g., educators who teach both mathematics and computer science in grades 6-12). Thus, responses to this survey question were separated into two separate measures: (a) subject and (b) grade level.
Additionally, these two variables were condensed for the analyses of two-way relationships: subject into STEM or non-STEM and grade level into K-5 or 6-12. One survey question in particular had an excessive number of missing responses (Question 2 on teaching assignment proportions—see Appendix B) and similar information was provided on Question 1. Thus, this survey question was omitted prior to analysis and its findings are not presented in this report.
Data Analysis
Much of the analysis in the report consisted of an examination of descriptive statistics via a series of bar plots. In addition, relationships between various survey questions were examined by constructing two-way heatmaps in an attempt to informally identify trends. Chi-squared tests with Bonferroni correction were used to examine relationships between survey questions, but nearly all results of these tests were unreliable due to small cell counts. Thus, results of the Chi-squared tests are not included in this report.
Findings
Descriptive Statistics
Educator and School District Characteristics (n = 207-208)
Descriptive statistics regarding educator and school district characteristics are presented in Figure 1, Figure 2, Figure 3, and Table 1. Many survey respondents teach science (n=104) or mathematics (n=79) while few teach engineering (n=18), career/technical (n=24), or computer science (n=25) (Figure 1) (Participants could choose as many as apply).
The majority of this sample teach either middle school (n=56), high school (n=52), or both (n=24), while 27 educators teach grades 3-5 and 20 teach grades K-2 (Figure 2). Most educators have either more than 20 years (n=60) or 6-10 years (n=48) of teaching experience (Table 1).
In regard to PD in the past 12 months, 67.8% of educators have participated in at least 21 hours, but only 22.1% of educators participated in at least 21 hours of PD that emphasized STEM teaching/learning or STEM integration (Figure 3).
The majority of educators in this sample are located in rural locales (62.5%), either Southwest (40.4%) or South central (28.4%) Montana, and within 20 miles of a Montana University System (MUS) campus (55.3%) (Table 1).
Table 1: ADDITIONAL EDUCATOR AND SCHOOL DISTRICT CHARACTERISTICS
|
Characteristic |
Frequency |
Percent |
K-12 teaching experience (n = 207) |
|
|
|
0-2 years |
17 |
8.2% |
|
3-5 years |
22 |
10.6% |
|
6-10 years |
48 |
23.1% |
|
11-15 years |
36 |
17.3% |
|
16-20 years |
24 |
11.5% |
|
More than 20 years |
60 |
28.8% |
Locale (n = 208) |
|
|
|
Rural |
130 |
62.5% |
|
Suburban |
47 |
22.6% |
|
Urban |
31 |
14.9% |
Montana region (n=208 |
|
|
|
Northwest |
25 |
12.0% |
|
North central |
18 |
8.7% |
|
Northeast |
7 |
3.4% |
|
Southwest |
84 |
40.4% |
|
South central |
59 |
28.4% |
|
Southeast |
15 |
7.2% |
Proximity to MUS campus (n=208) |
|
|
|
Less than 20 miles |
115 |
55.3% |
|
21-50 miles |
41 |
19.7% |
|
51-100 miles |
29 |
13.9% |
|
More than 100 miles |
23 |
11.1% |
Note: Percents may not add to 100% due to rounding.
FIGURE 1. Teaching Assignment Subjects (n=207)
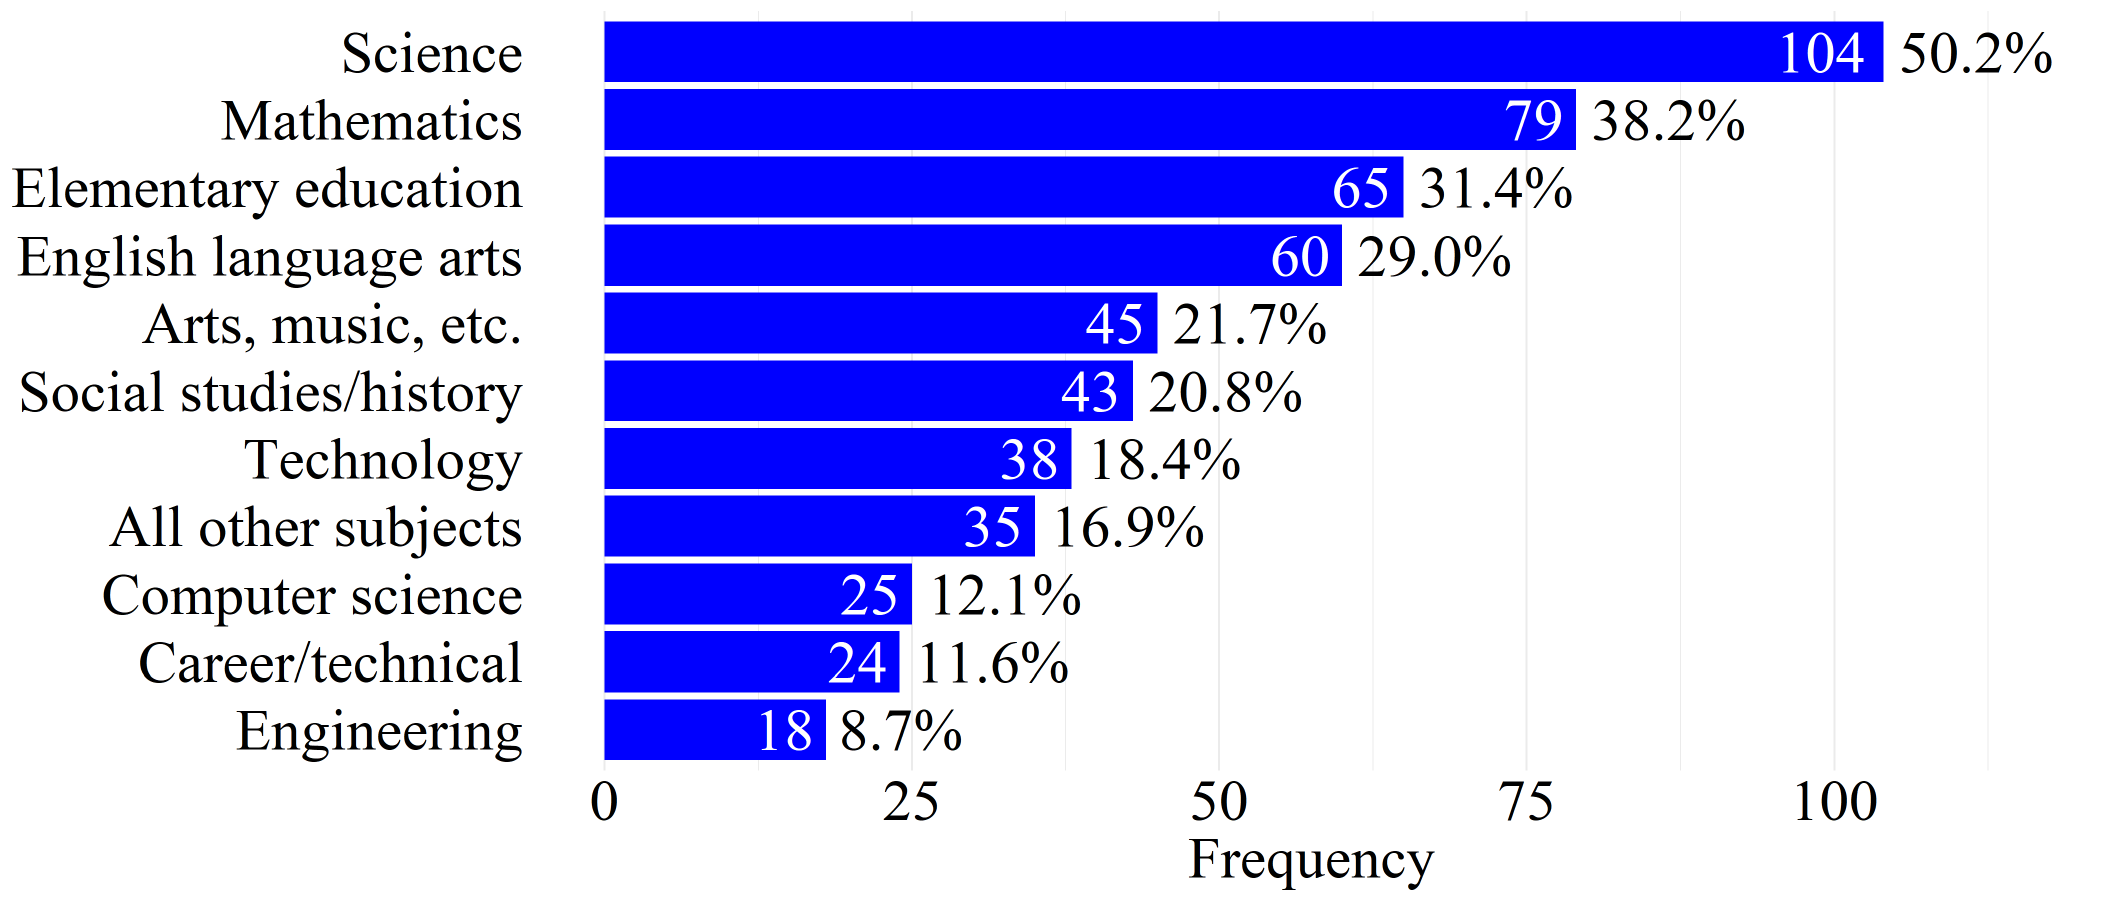
Note. Percents do not add to 100% due to educators teaching multiple subjects.
FIGURE 2. Teaching Assignment Grade Levels (n=207)
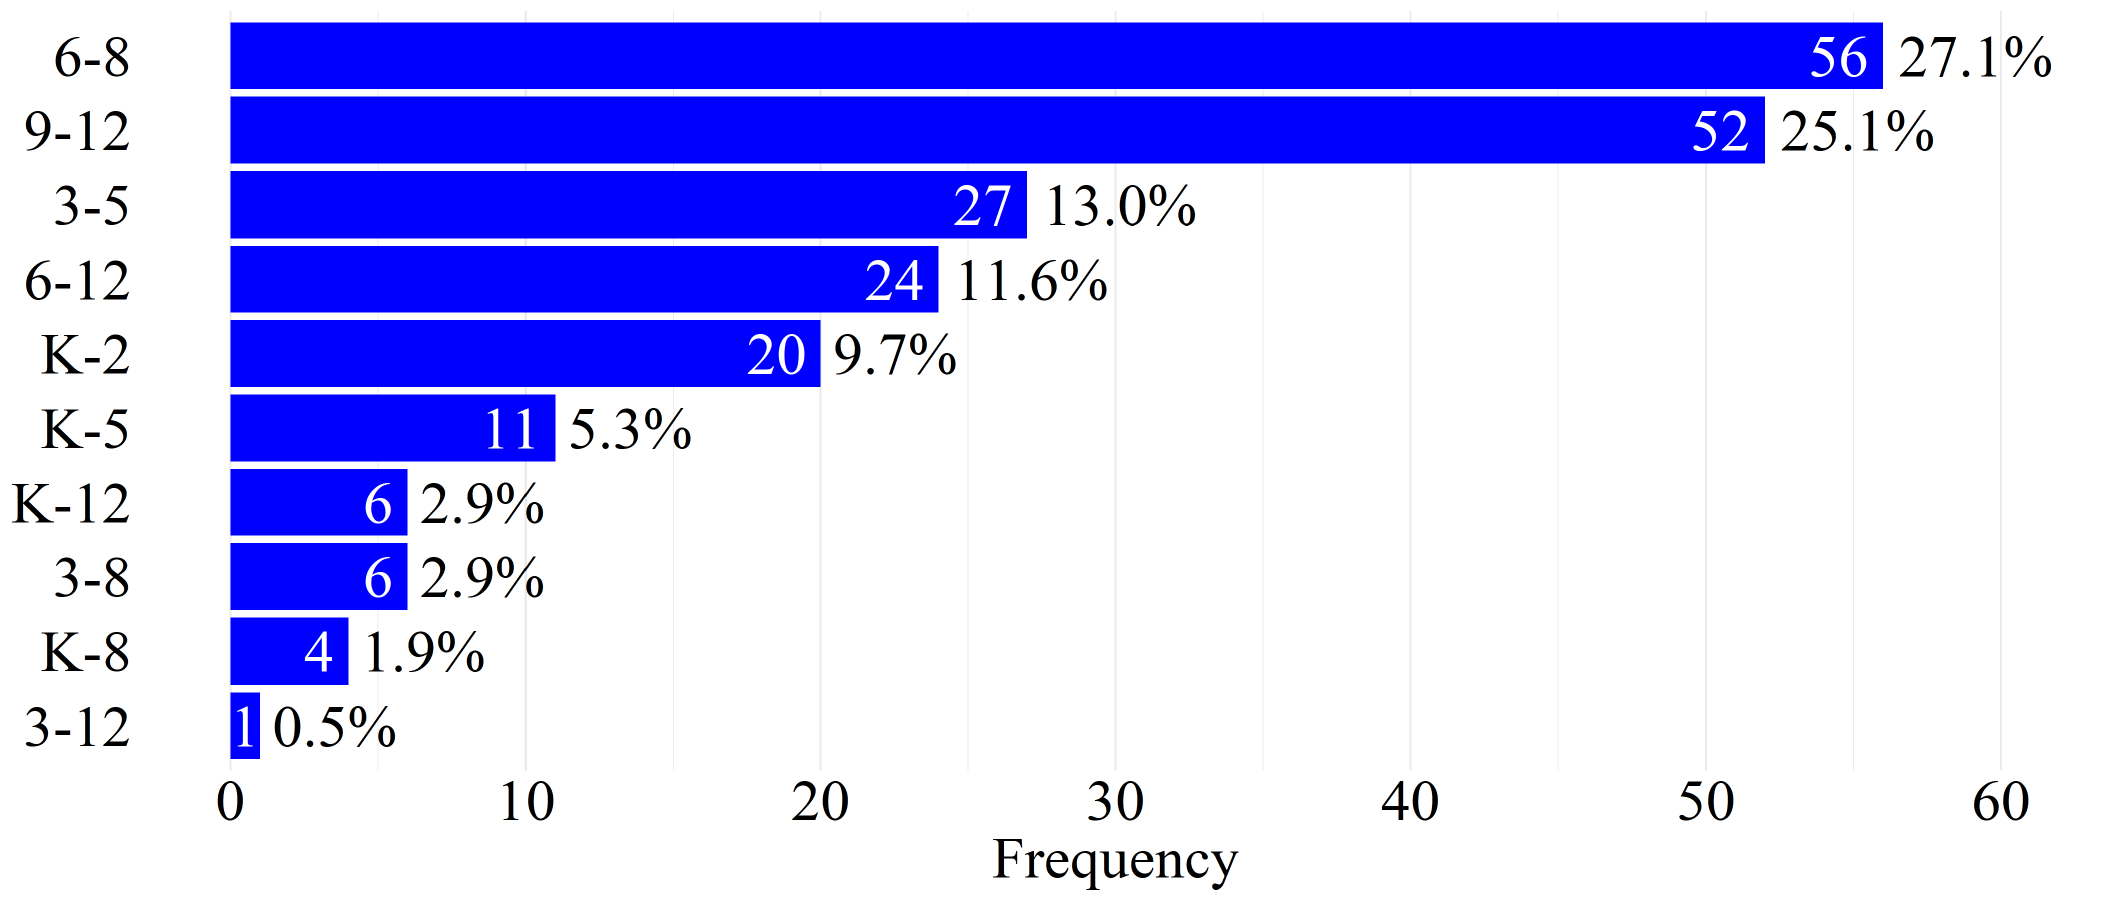
Note: Percents may not add to 100% due to rounding.
FIGURE 3. Hours of PD in the Past 12 Months (n=208)
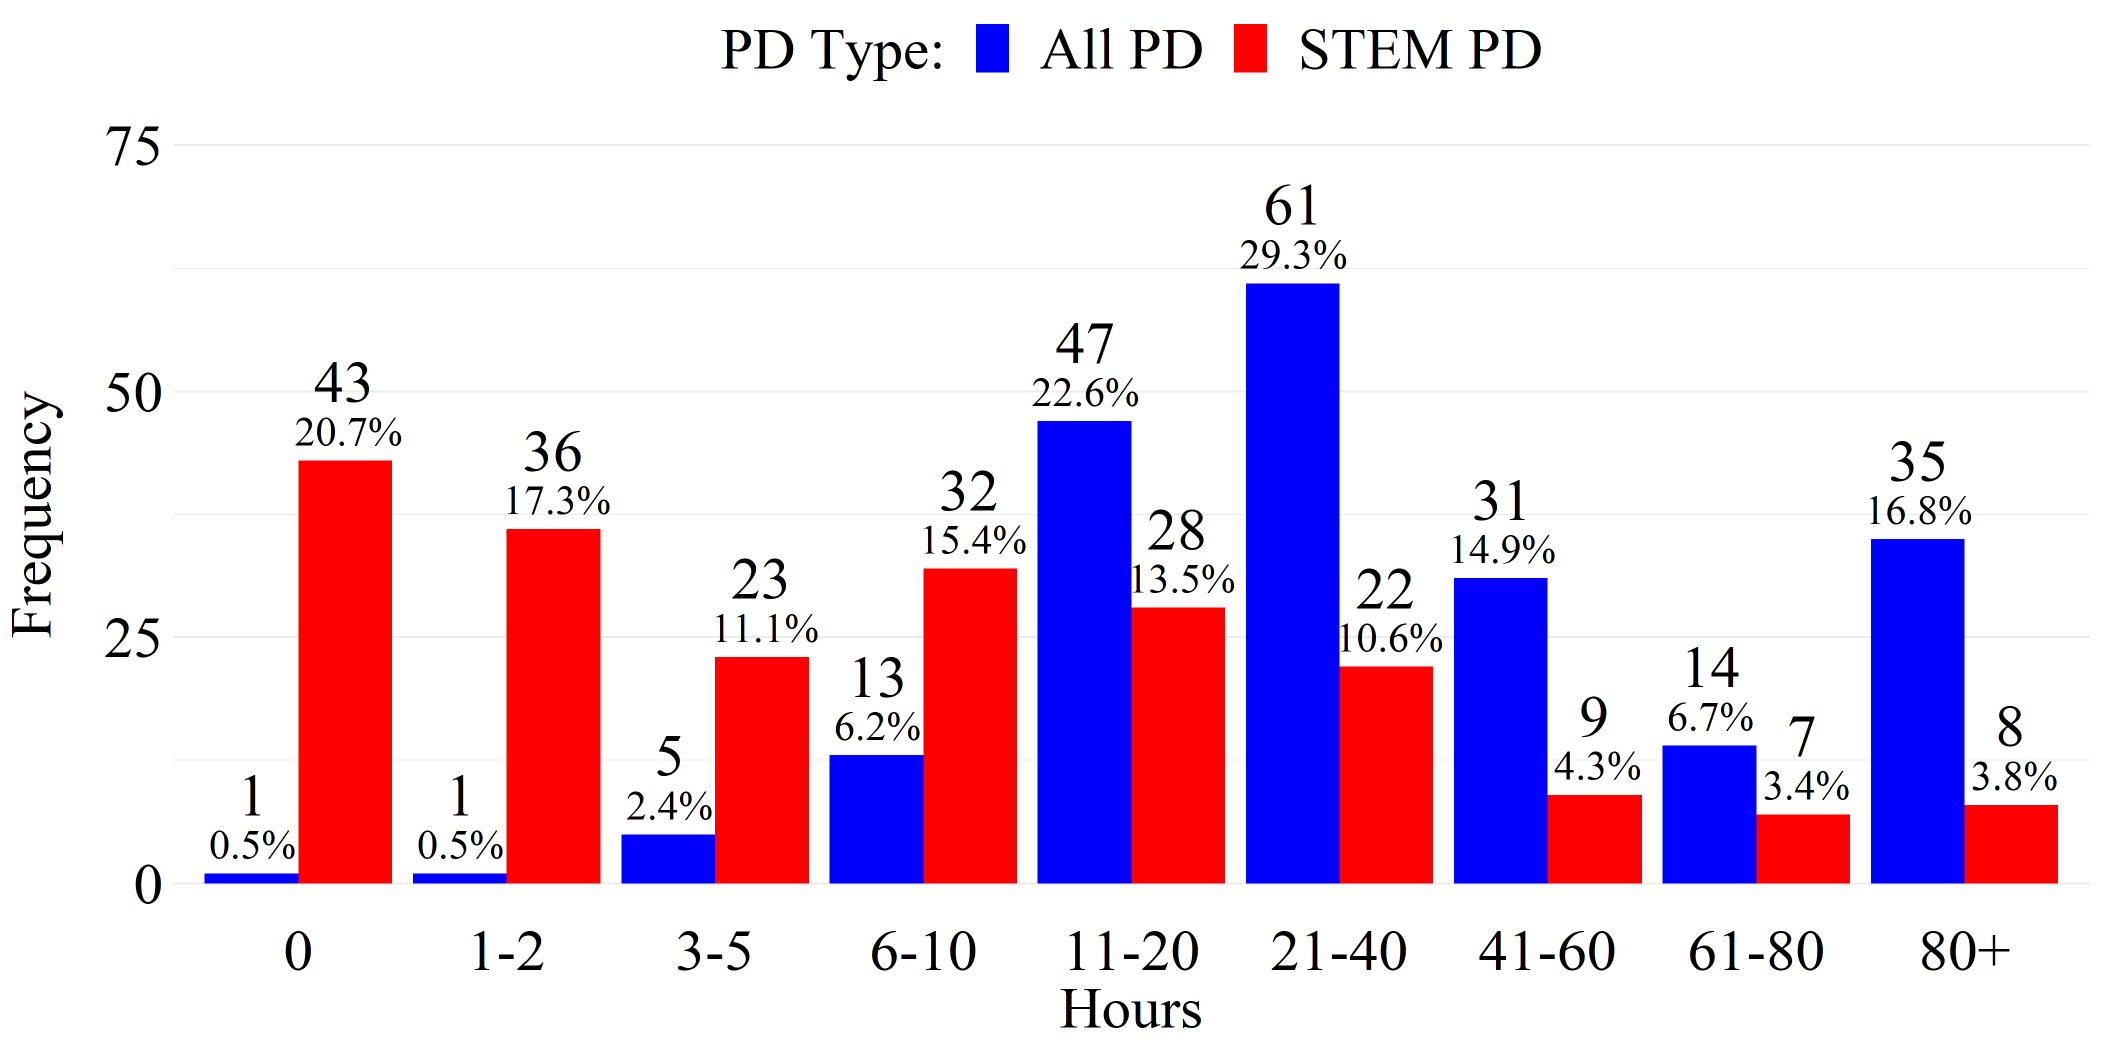
Note: Percents may not add to 100% due to rounding.
Access to Technological Resources (n = 178)
Descriptive statistics regarding school/district access to technological resources are presented in Figure 4. Most educators report that access to a standard internet connection (n = 168), online learning management systems (n = 148), and a high-speed internet connection (n=137) are alwaysavailable. Notably, no educators report that either a standard or high-speed internet connection was neveravailable, though 23.0% report that a high-speed internet connection was just sometimesavailable. Additionally, social media websites are generally never available (n=66) in educators’ school/district.
FIGURE 4. School/District Access to Technological Resources
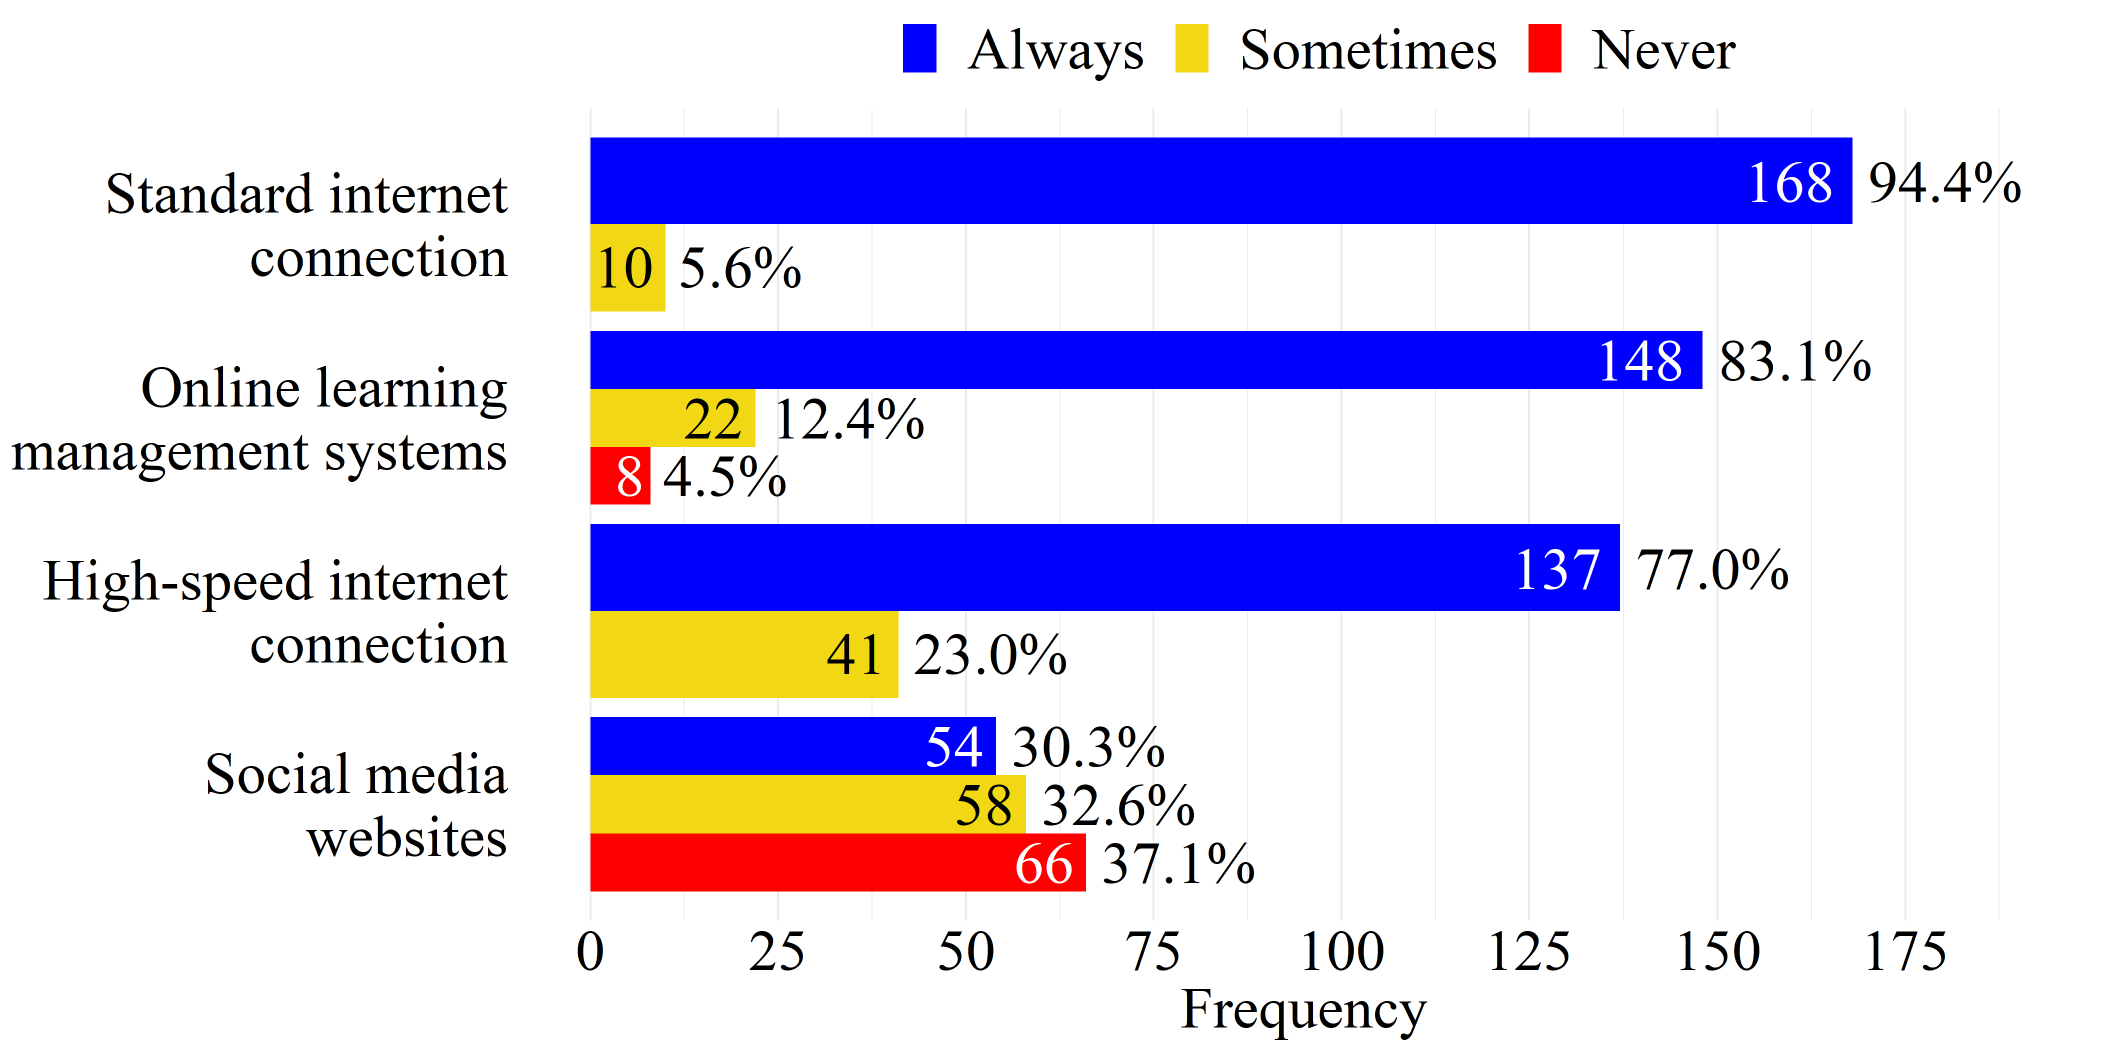
Note: Percents may not add to 100% due to rounding.
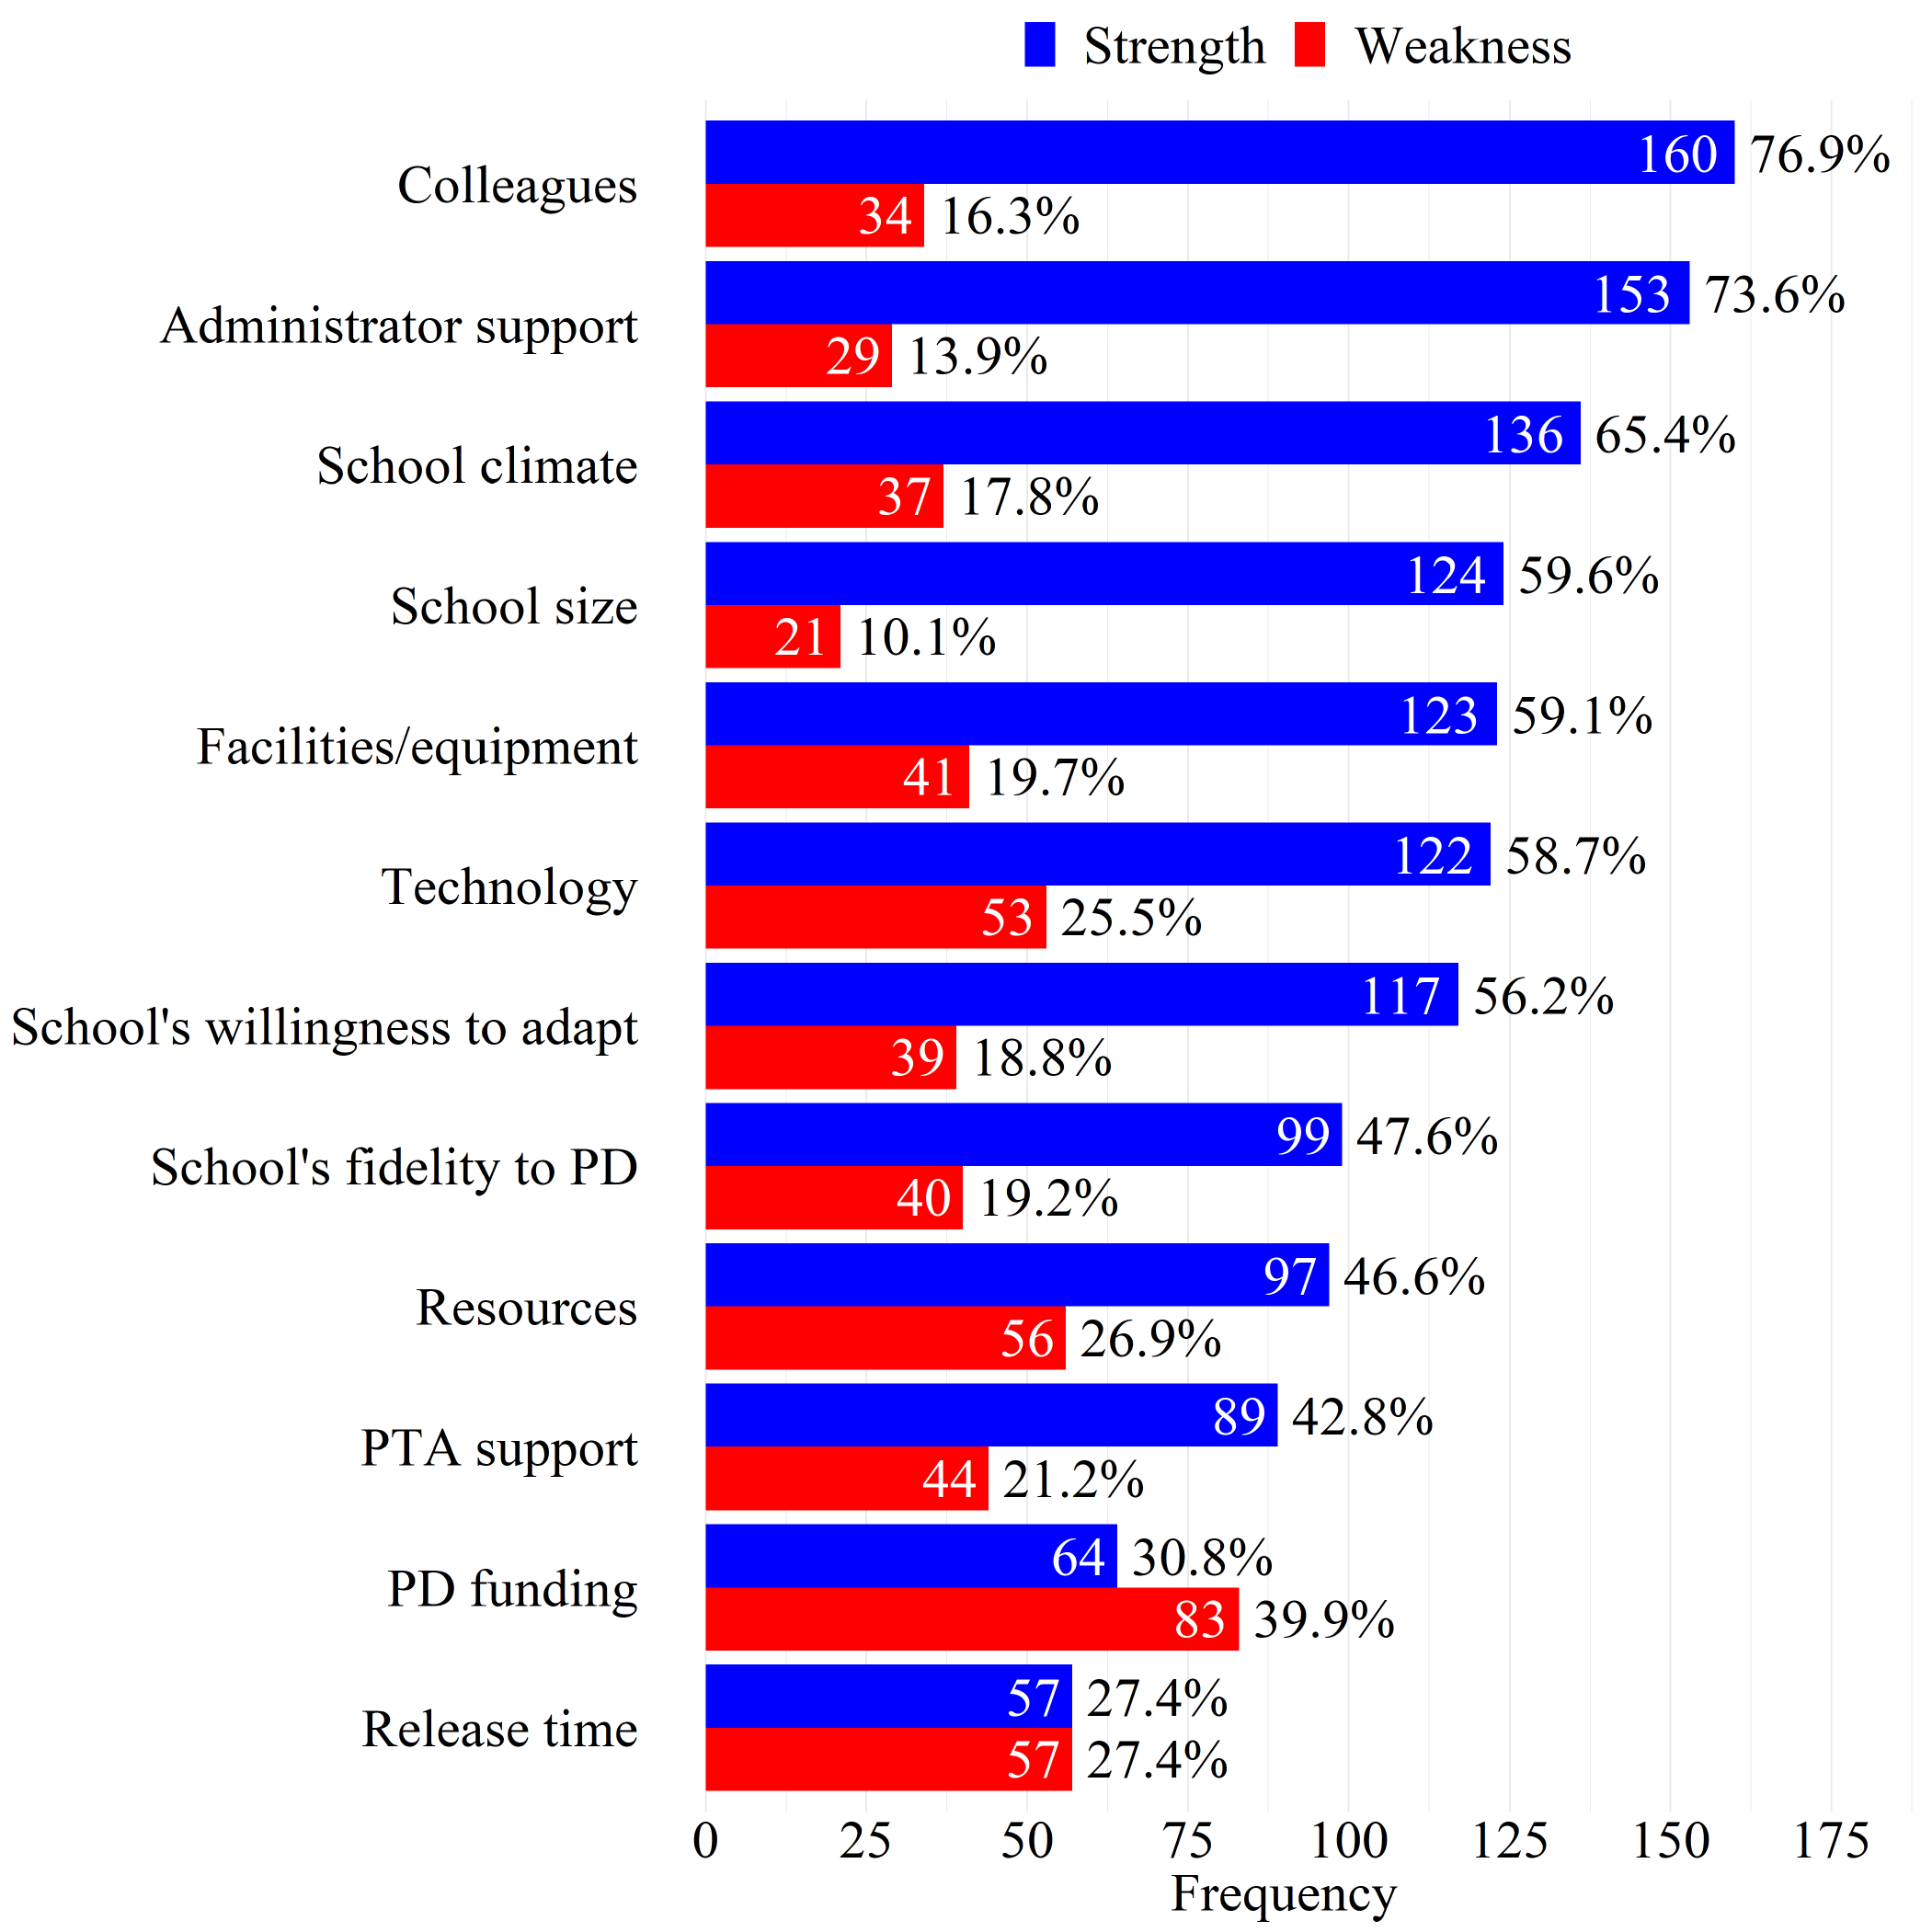
School/District Strengths and Weaknesses that Impact PD Implementation (n = 208)
Descriptive statistics regarding school/district strengths and weaknesses related to professional development are presented in Figure 5. In regard to strengths that positively contribute to the implementation of high-quality PD, educators most frequently report that experienced and supportive colleagues (n=160),supportive administrators (n=153),and a good school/organizational climate (n=136)are strengths of their school/district.
Of the school/district weaknesses that restrict the implementation of high-quality PD, educators most frequently report inadequate funding (n=83); release time (n=57), resources—books, materials for experiments/labs, etc. (n=56), and technology (n=53). The only school/district characteristic that is reported more frequently as a weakness rather than a strength is the level of funding available for PD. Educators also provided additional strengths and weaknesses that were not explicitly listed in the survey, which can be found in Appendix C.
FIGURE 5. Strengths/Weaknesses of School/District That Impact PD Implementation
Note: Percents may not add to 100% due to rounding.
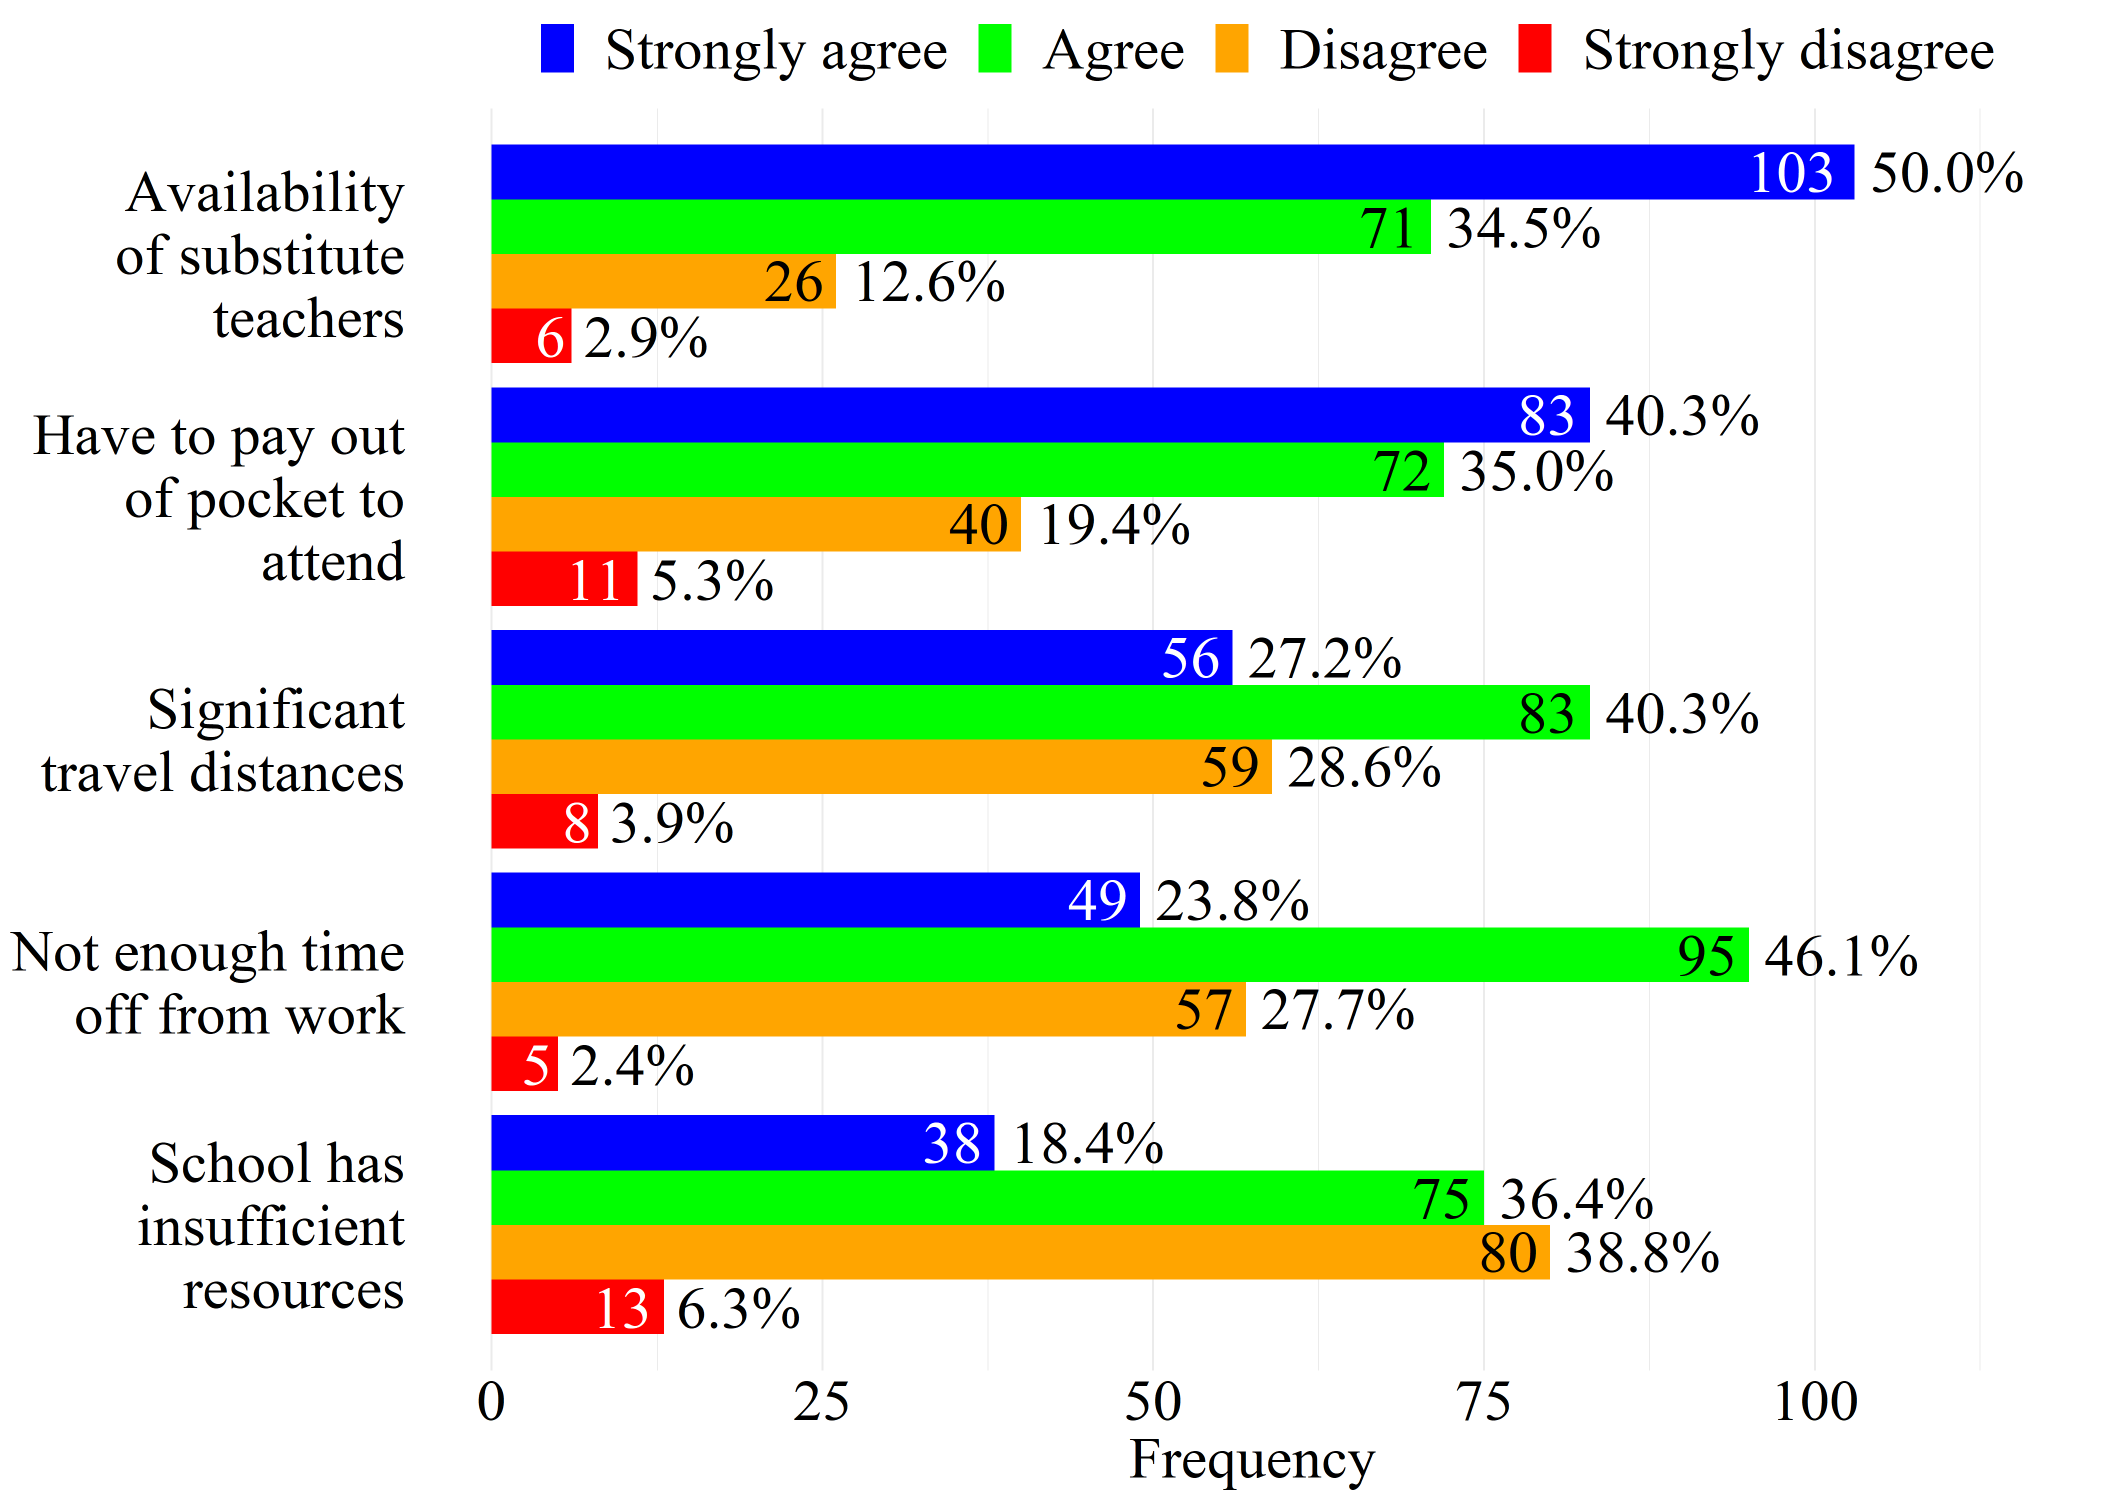
Barriers to Professional Development (n = 206)
Descriptive statistics regarding barriers to PD are presented in Figure 6. Educators most frequently strongly agree that availability of substitute teachers (n=103)and having to pay out of pocket to attend (n = 83) are barriers to PD. It is worth noting that for each of the five barriers to PD listed, over 50% of educators either strongly agree or agreethat the given potential issue prevents them from participating in PD.
FIGURE 6. Barriers to PD
Note: Percents may not add to 100% due to rounding.
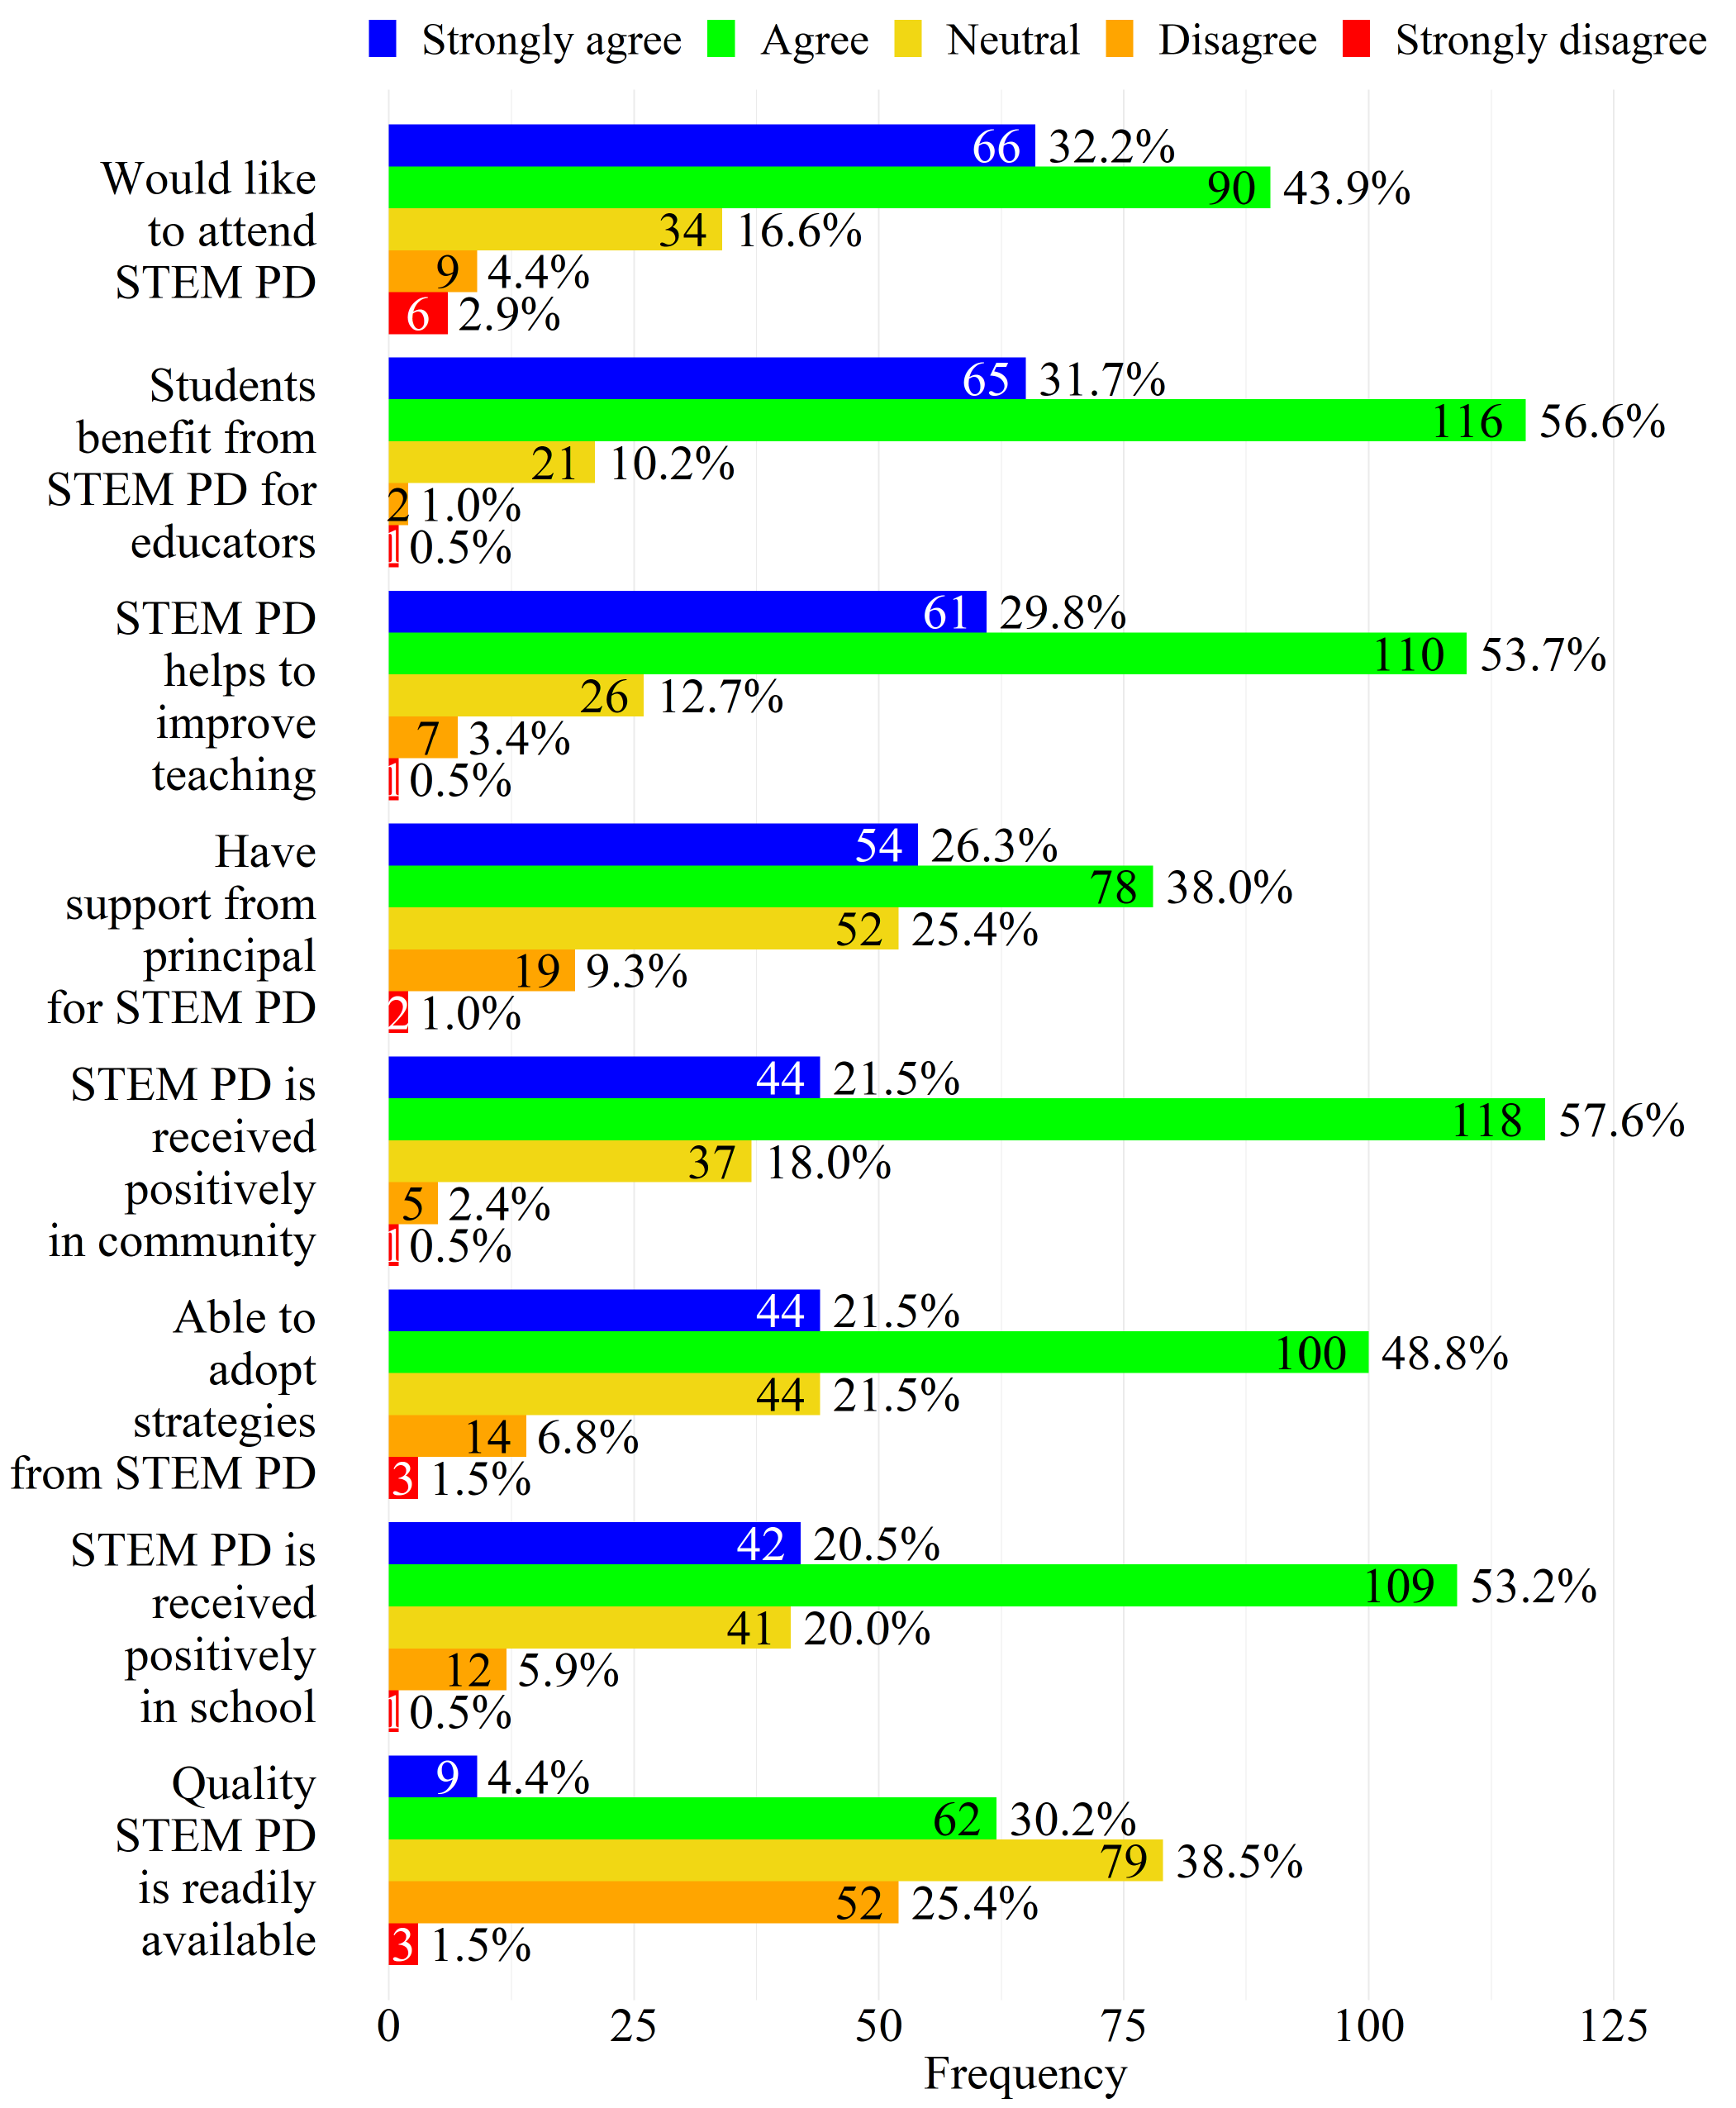
Attitudes Toward STEM Professional Development (n = 205)
Descriptive statistics regarding attitudes toward STEM PD are presented in Figure 7. Bearing in mind that the sample was all K-12 educators and not just STEM educators, overall, educators report positive attitudes toward STEM PD. The majority of educators either strongly agree or agree to seven of the eight survey questions regarding attitudes toward STEM PD. However, most educators do not agree that STEM PD is readily available, as only 34.6% of educators either strongly agree (n = 9) or agree (n = 62) to the statement that quality PD programs for STEM teaching and learning and STEM integration are readily available.
FIGURE 7. Attitudes Toward STEM PD
Note: Percents may not add to 100% due to rounding.
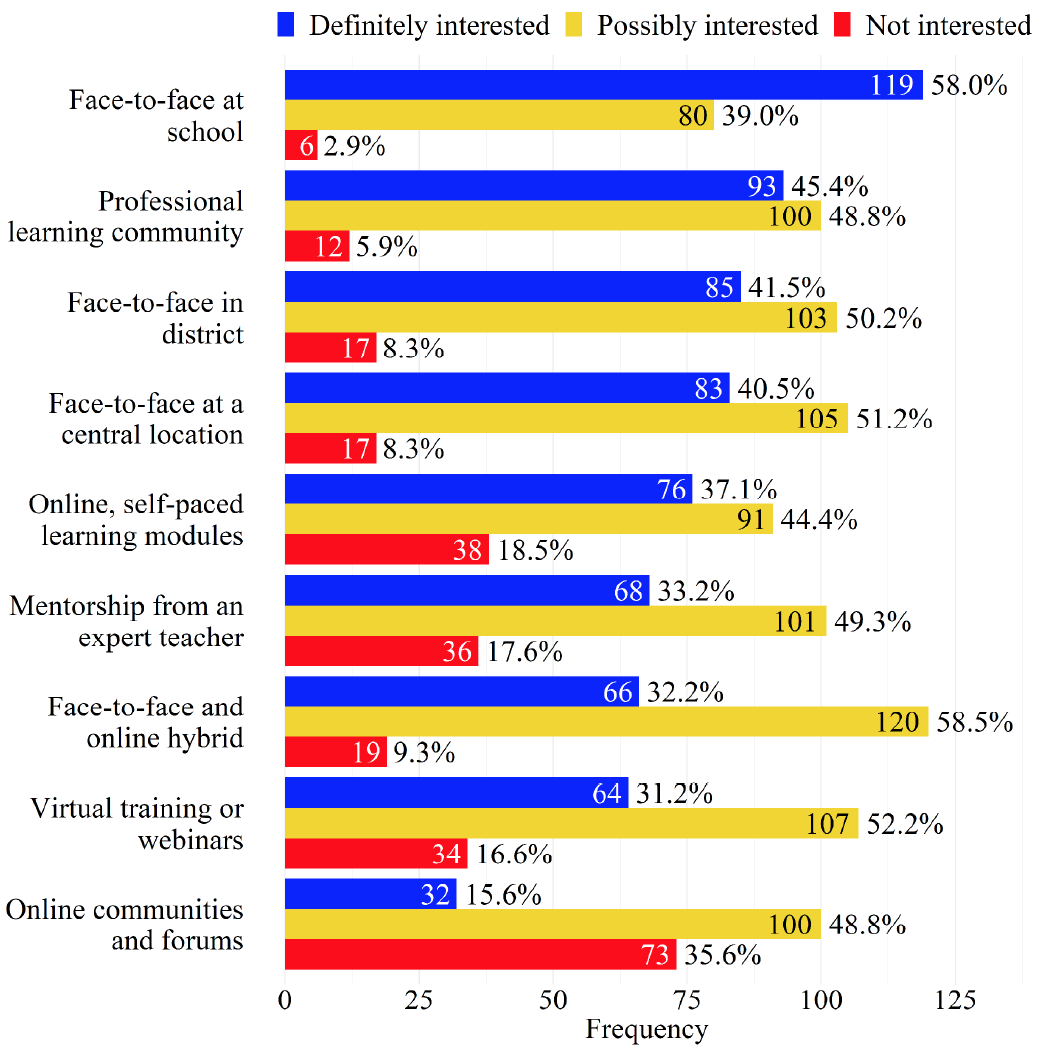
Professional Development Location and Delivery Method Preferences (n = 205)
Descriptive statistics regarding PD location and delivery method preferences are presented in Figure 8. Educators are most frequently definitely interested in participating in face-to-face PD at their school (n=119); collaborating with other teachers in a professional learning community (n=93); face-to-face PD in their district (n=85); and face-to-face PD at a central location – Billings, Bozeman, or Missoula (n=83). Educators are most frequently not interested in online communities and forums (n=73); online, self-paced learning modules (n=38); mentorship from an expert teacher (n=36); and virtual trainings or webinars (n=34).
Note that while the hybrid model that incorporates some face-to-face meetings along with online follow-up opportunities received the third-fewest number of definitely interested responses (n=66), this option received the highest number of possibly interested responses (n=120).
FIGURE 8. PD Location and Delivery Method Preferences
Note: Percents may not add to 100% due to rounding.
Professional Development Time and Duration Preferences (n = 203)
Descriptive statistics regarding PD time and duration preferences are presented in Figure 9. Overall, educators are most interested in one-time PD sessions during school hours with varying degrees of length, as they are definitely interested in a half day (n = 82), a full day (n = 80), and 1-2hours (n = 75). Additionally, educators report little interest in PD sessions that are recurring and/or occur during the evenings or weekends. Educators also provided additional comments about PD preferences that were not explicitly listed in the survey, which can be found in Appendix D.
FIGURE 9. PD Time and Duration Preferences
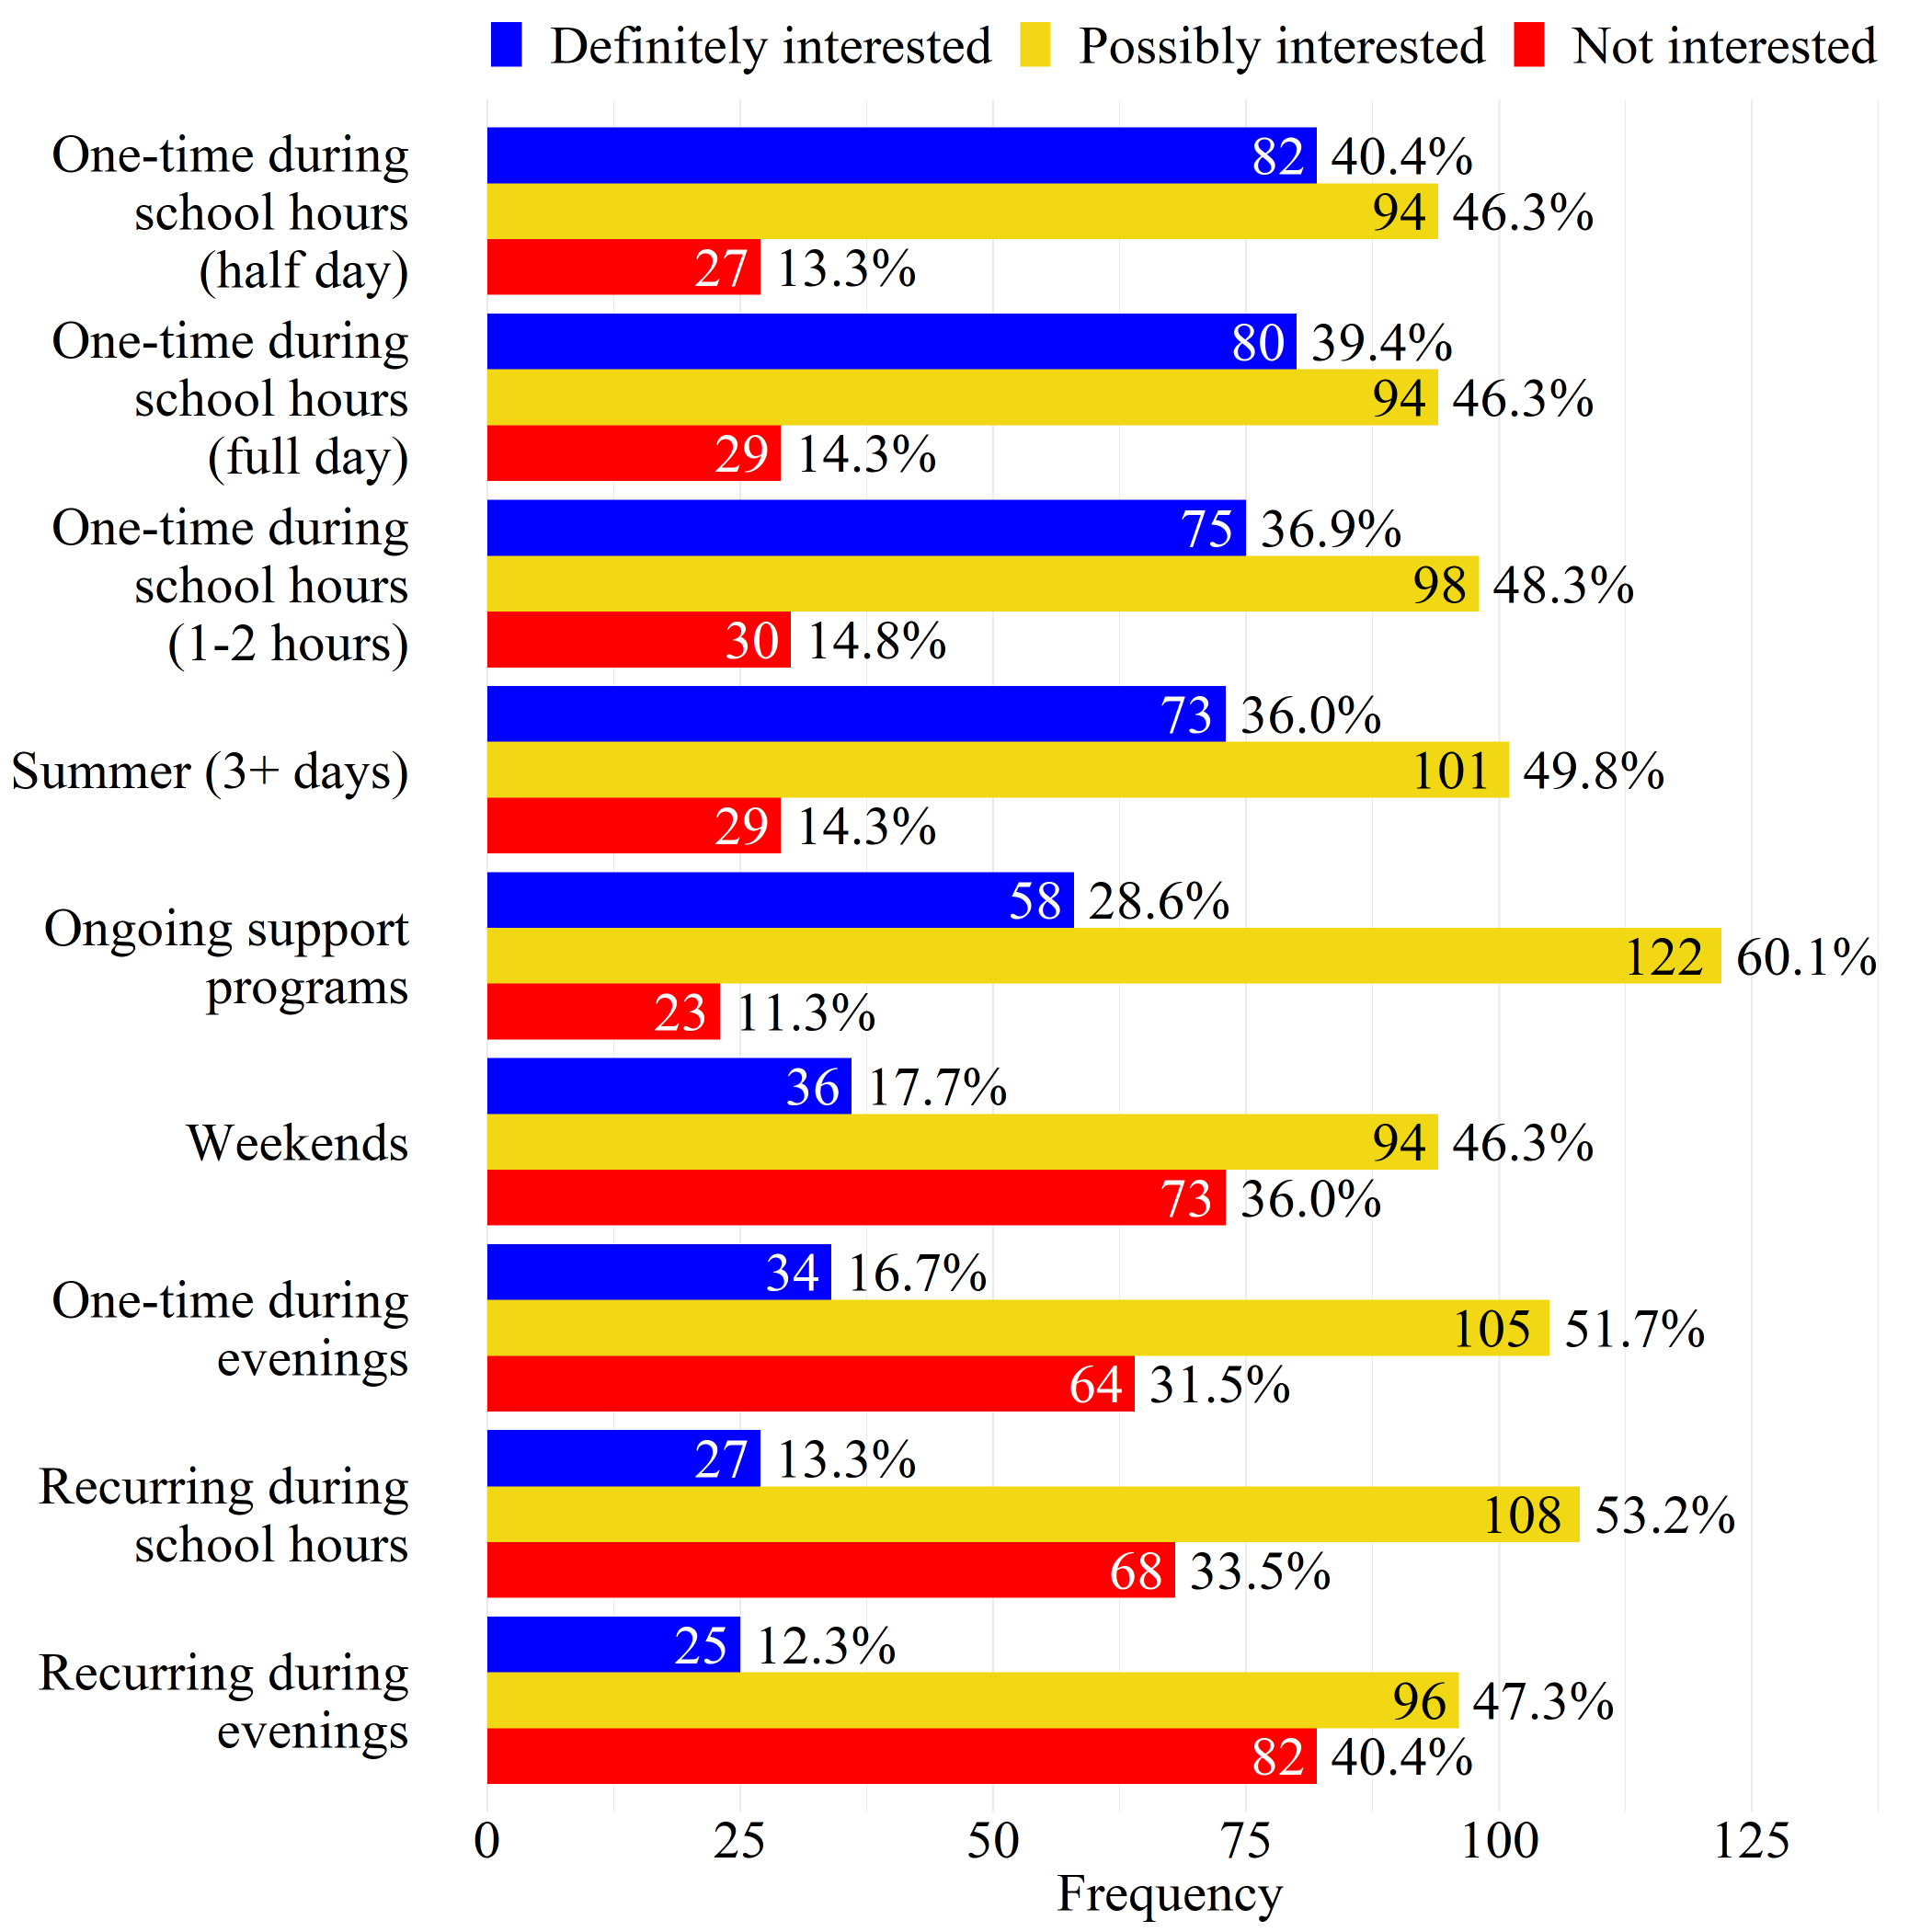
Note: Percents may not add to 100% due to rounding.
Importance of Professional Development Topics (n = 194)
Descriptive statistics regarding importance of professional development topics are presented in Figure 10, Figure 11, and Figure 12. Figures 10-12 are displayed in descending order in respect to the percent of educators reporting the PD topic as being very important.
FIGURE 10. Importance of PD Topics (Ranks 1-10 by “High Importance” Percent)
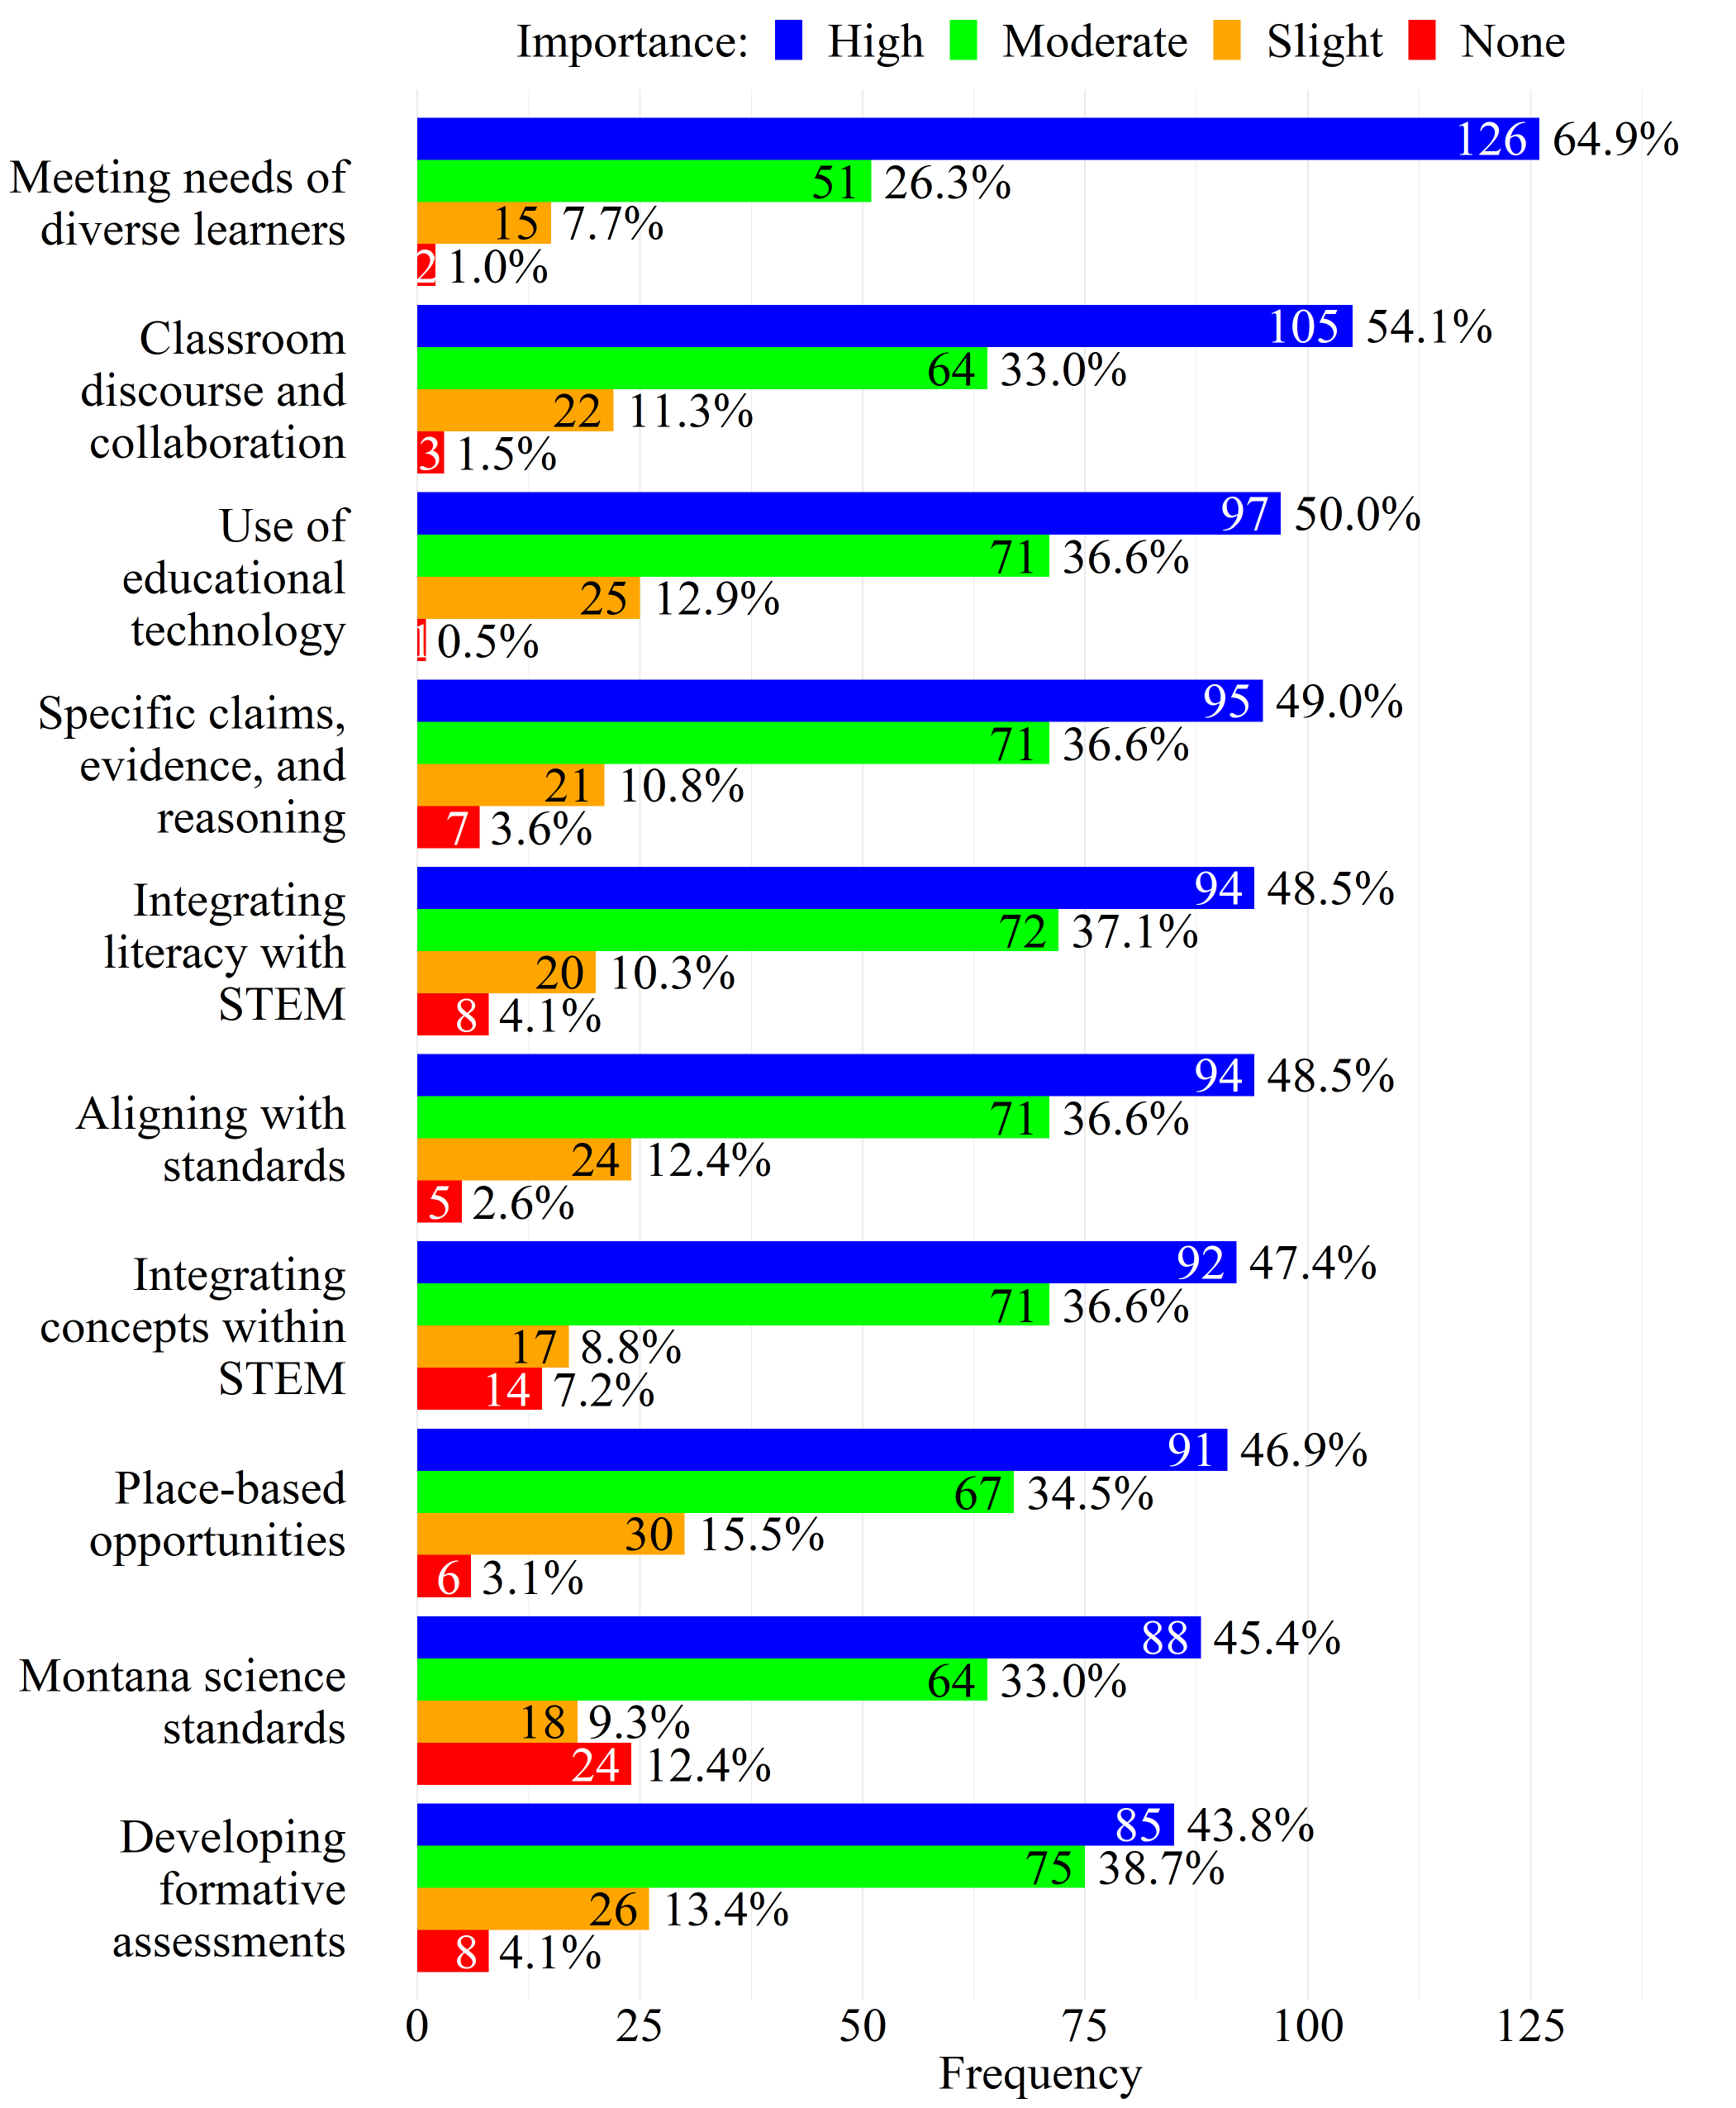
FIGURE 11. Importance of PD Topics (Ranks 11-20 by “High Importance” Percent)
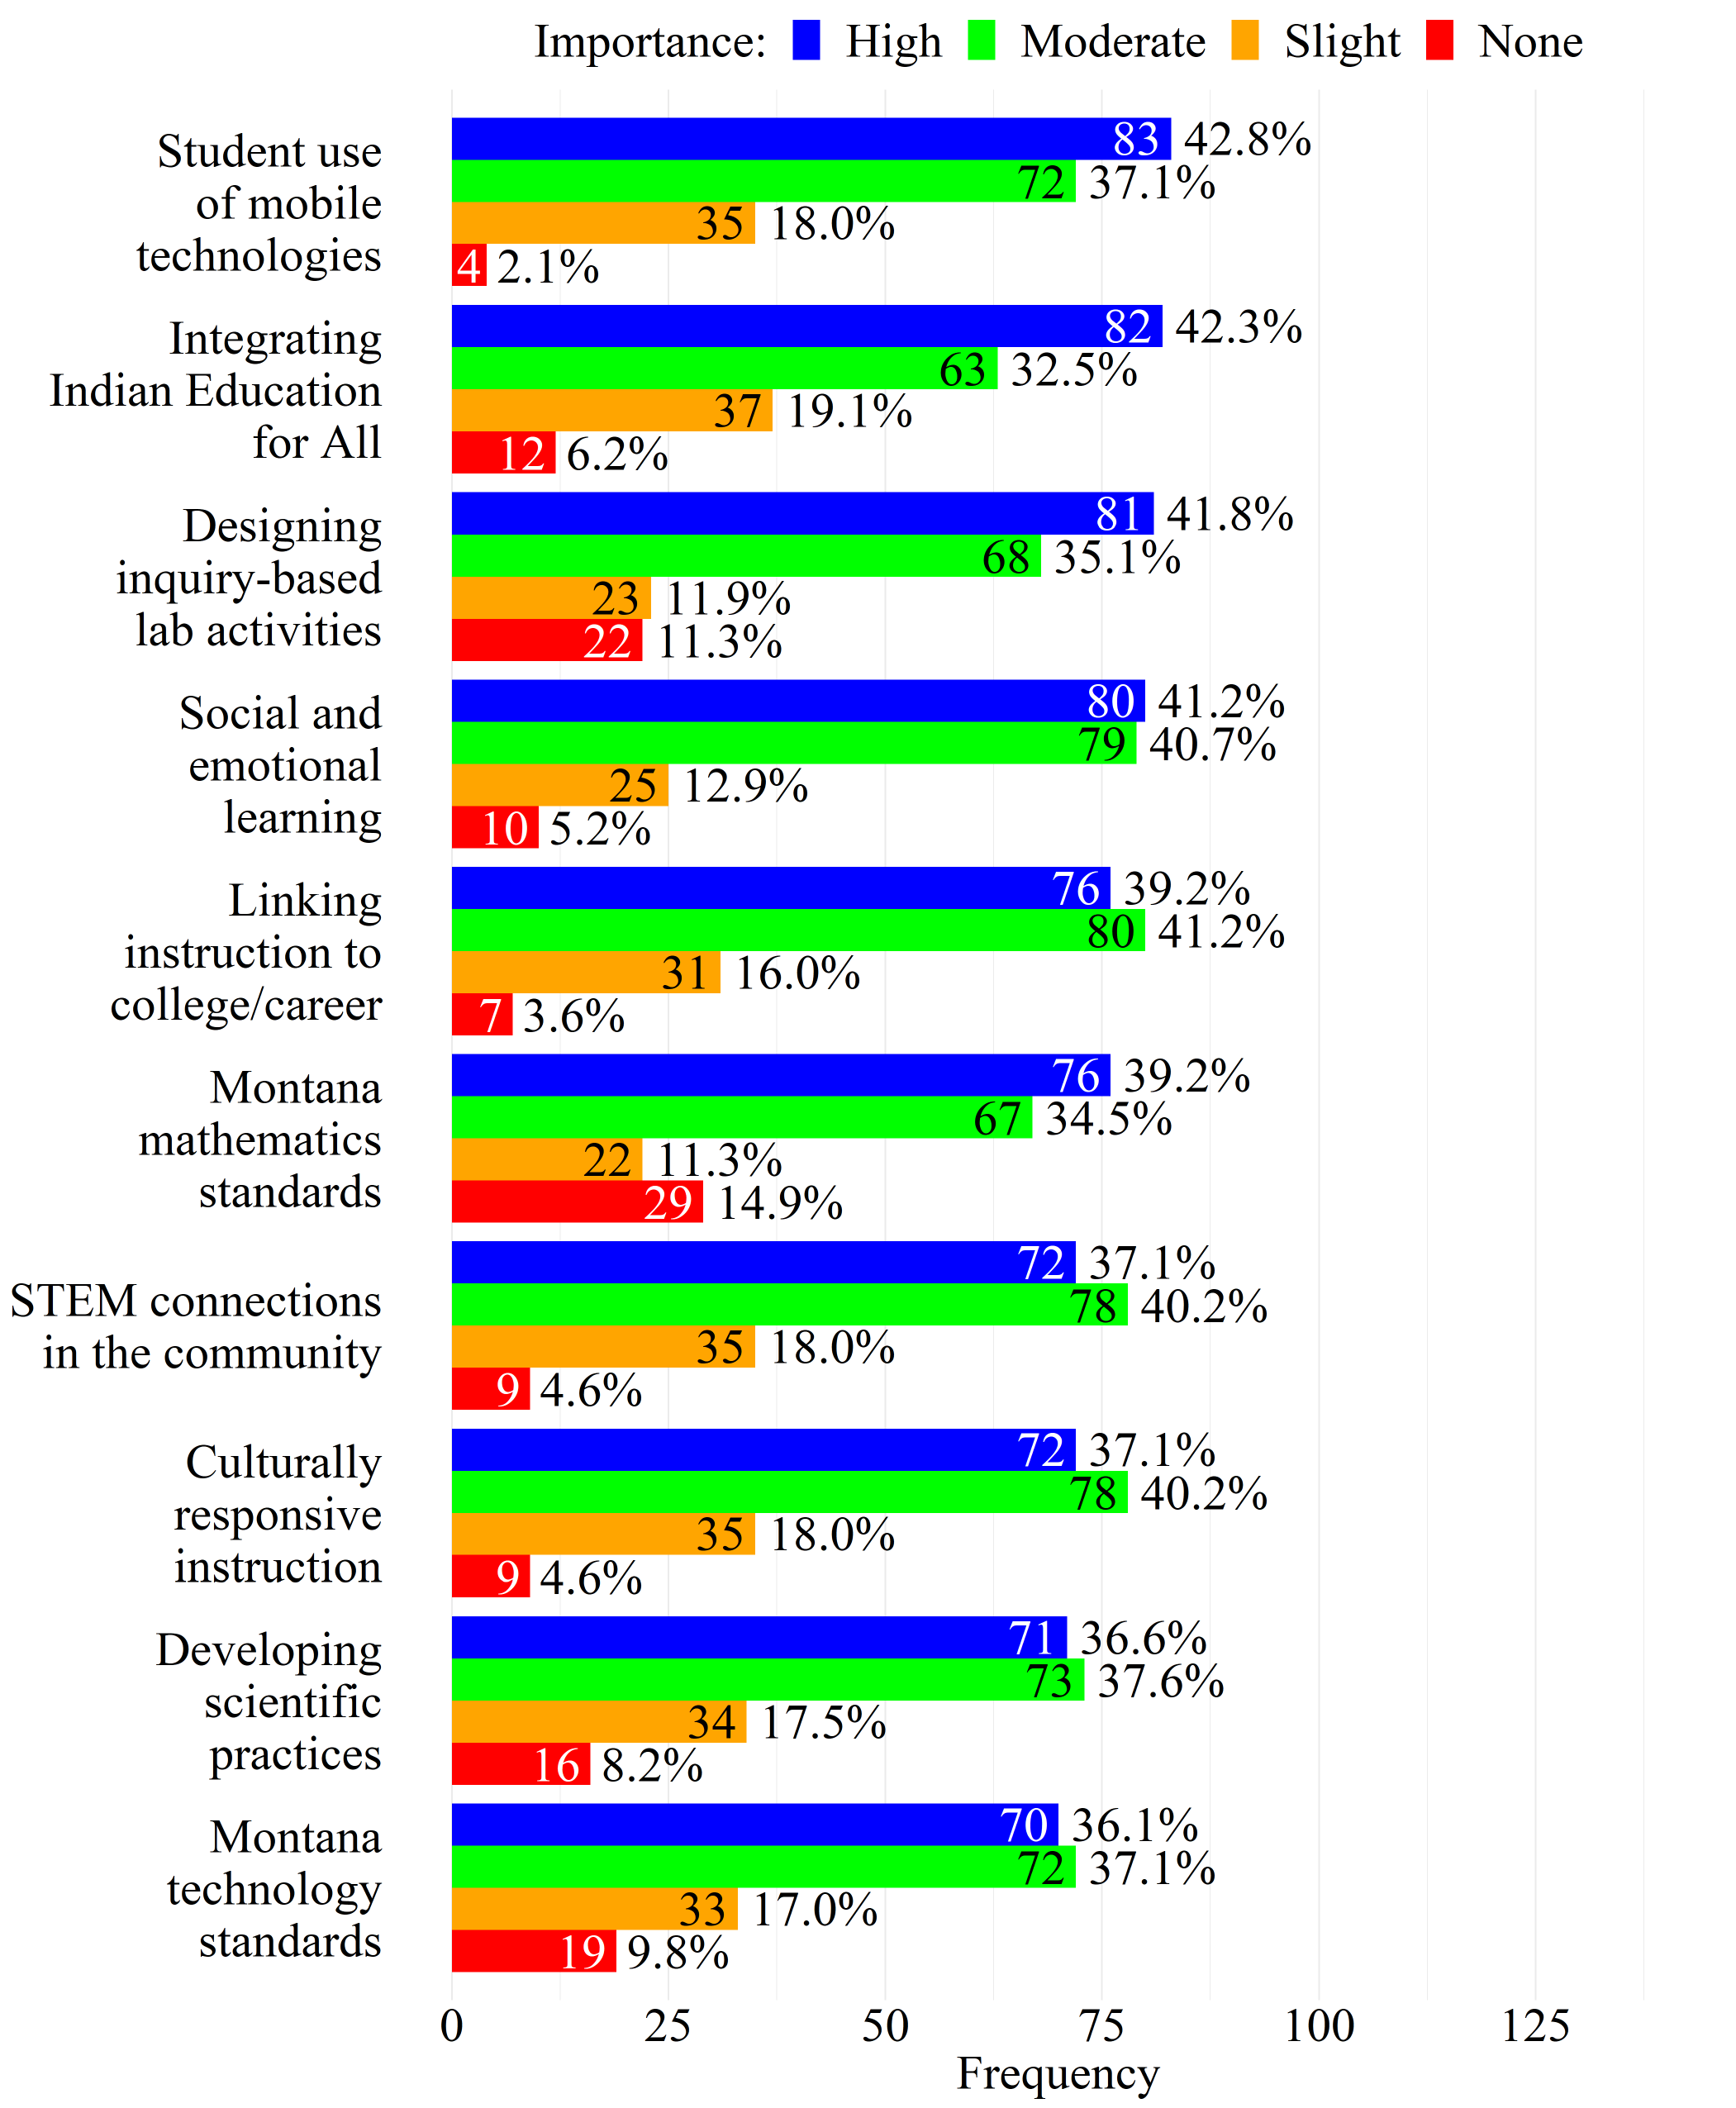
FIGURE 12. Importance of PD Topics (Ranks 21-26 by “High Importance Percent)
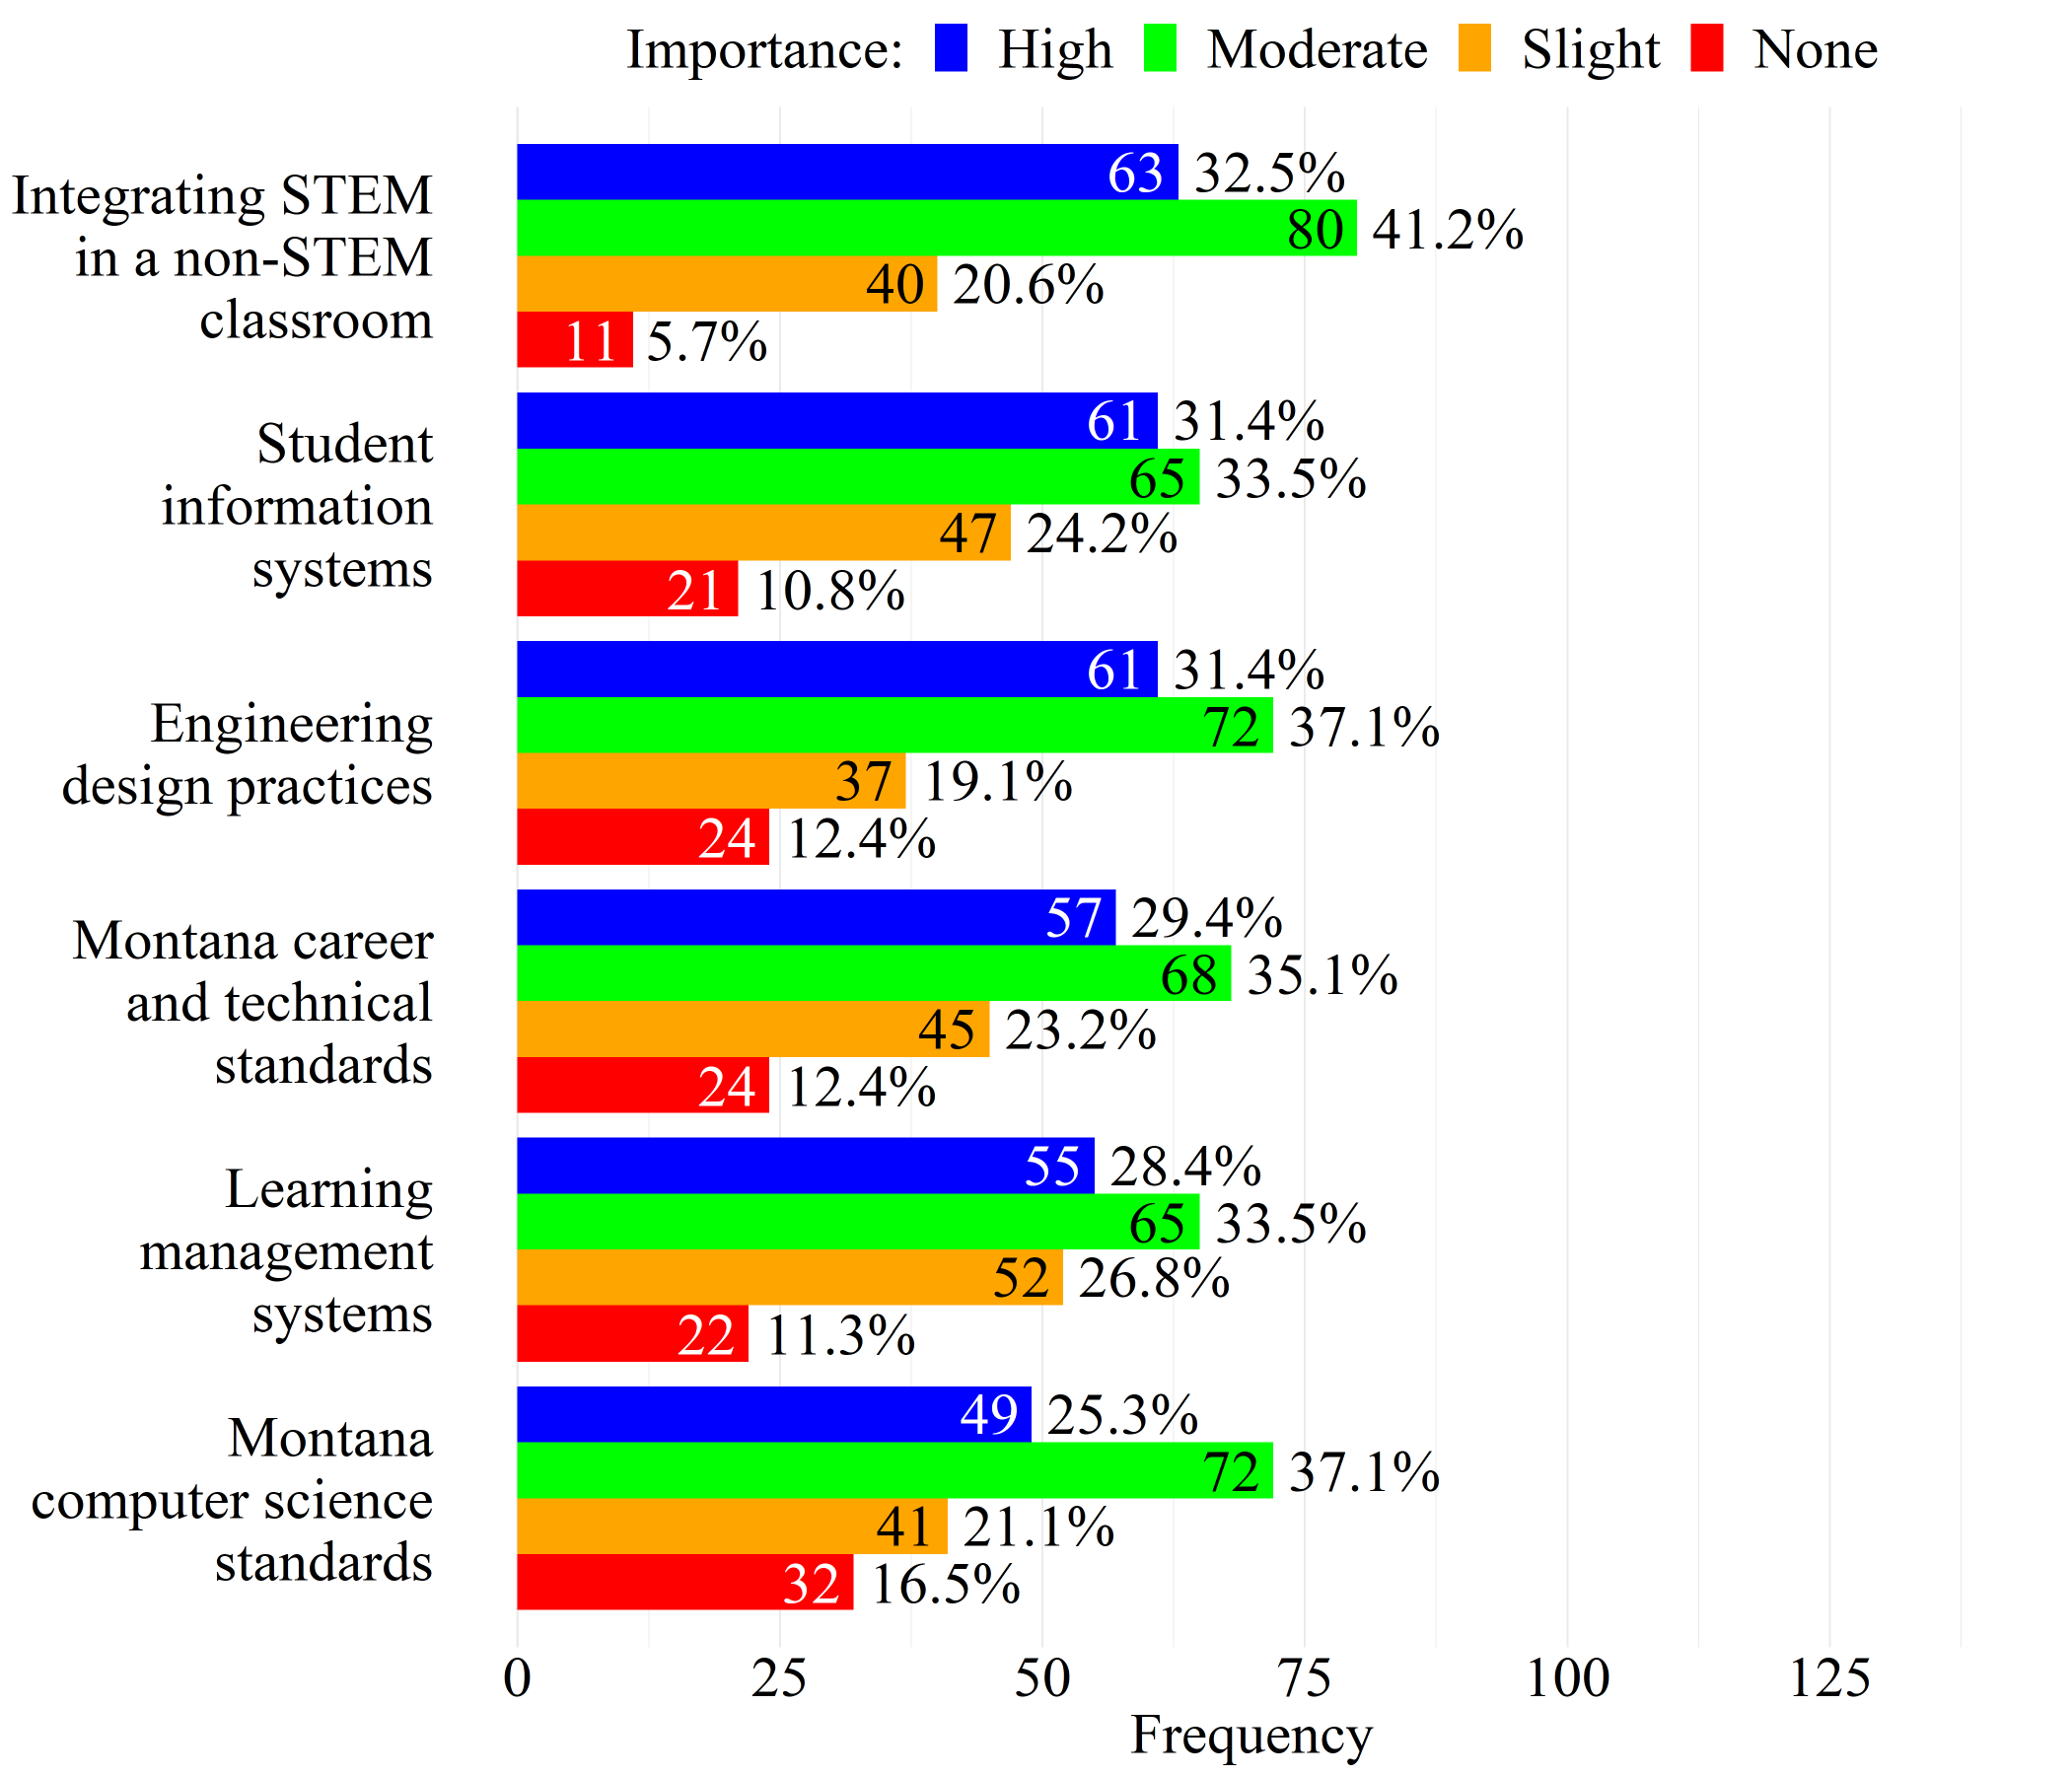
Note: Percents may not add to 100% due to rounding.
Interest in Professional Development Topics (n = 168)
In addition to the importance of PD topics, we collected descriptive statistics regarding interest in professional development topics. These are presented in Figure 13, Figure 14, and Figure 15. Figures 13-15 are displayed in descending order in respect to the percent of educators being definitely interested in participating in PD that is focused on the given topic. Educators also provided additional PD interests that were not explicitly listed in the survey (Appendix E).
FIGURE 13. Interest in PD Topics (Ranks 1-10 by “Definitely Interested” Percent)
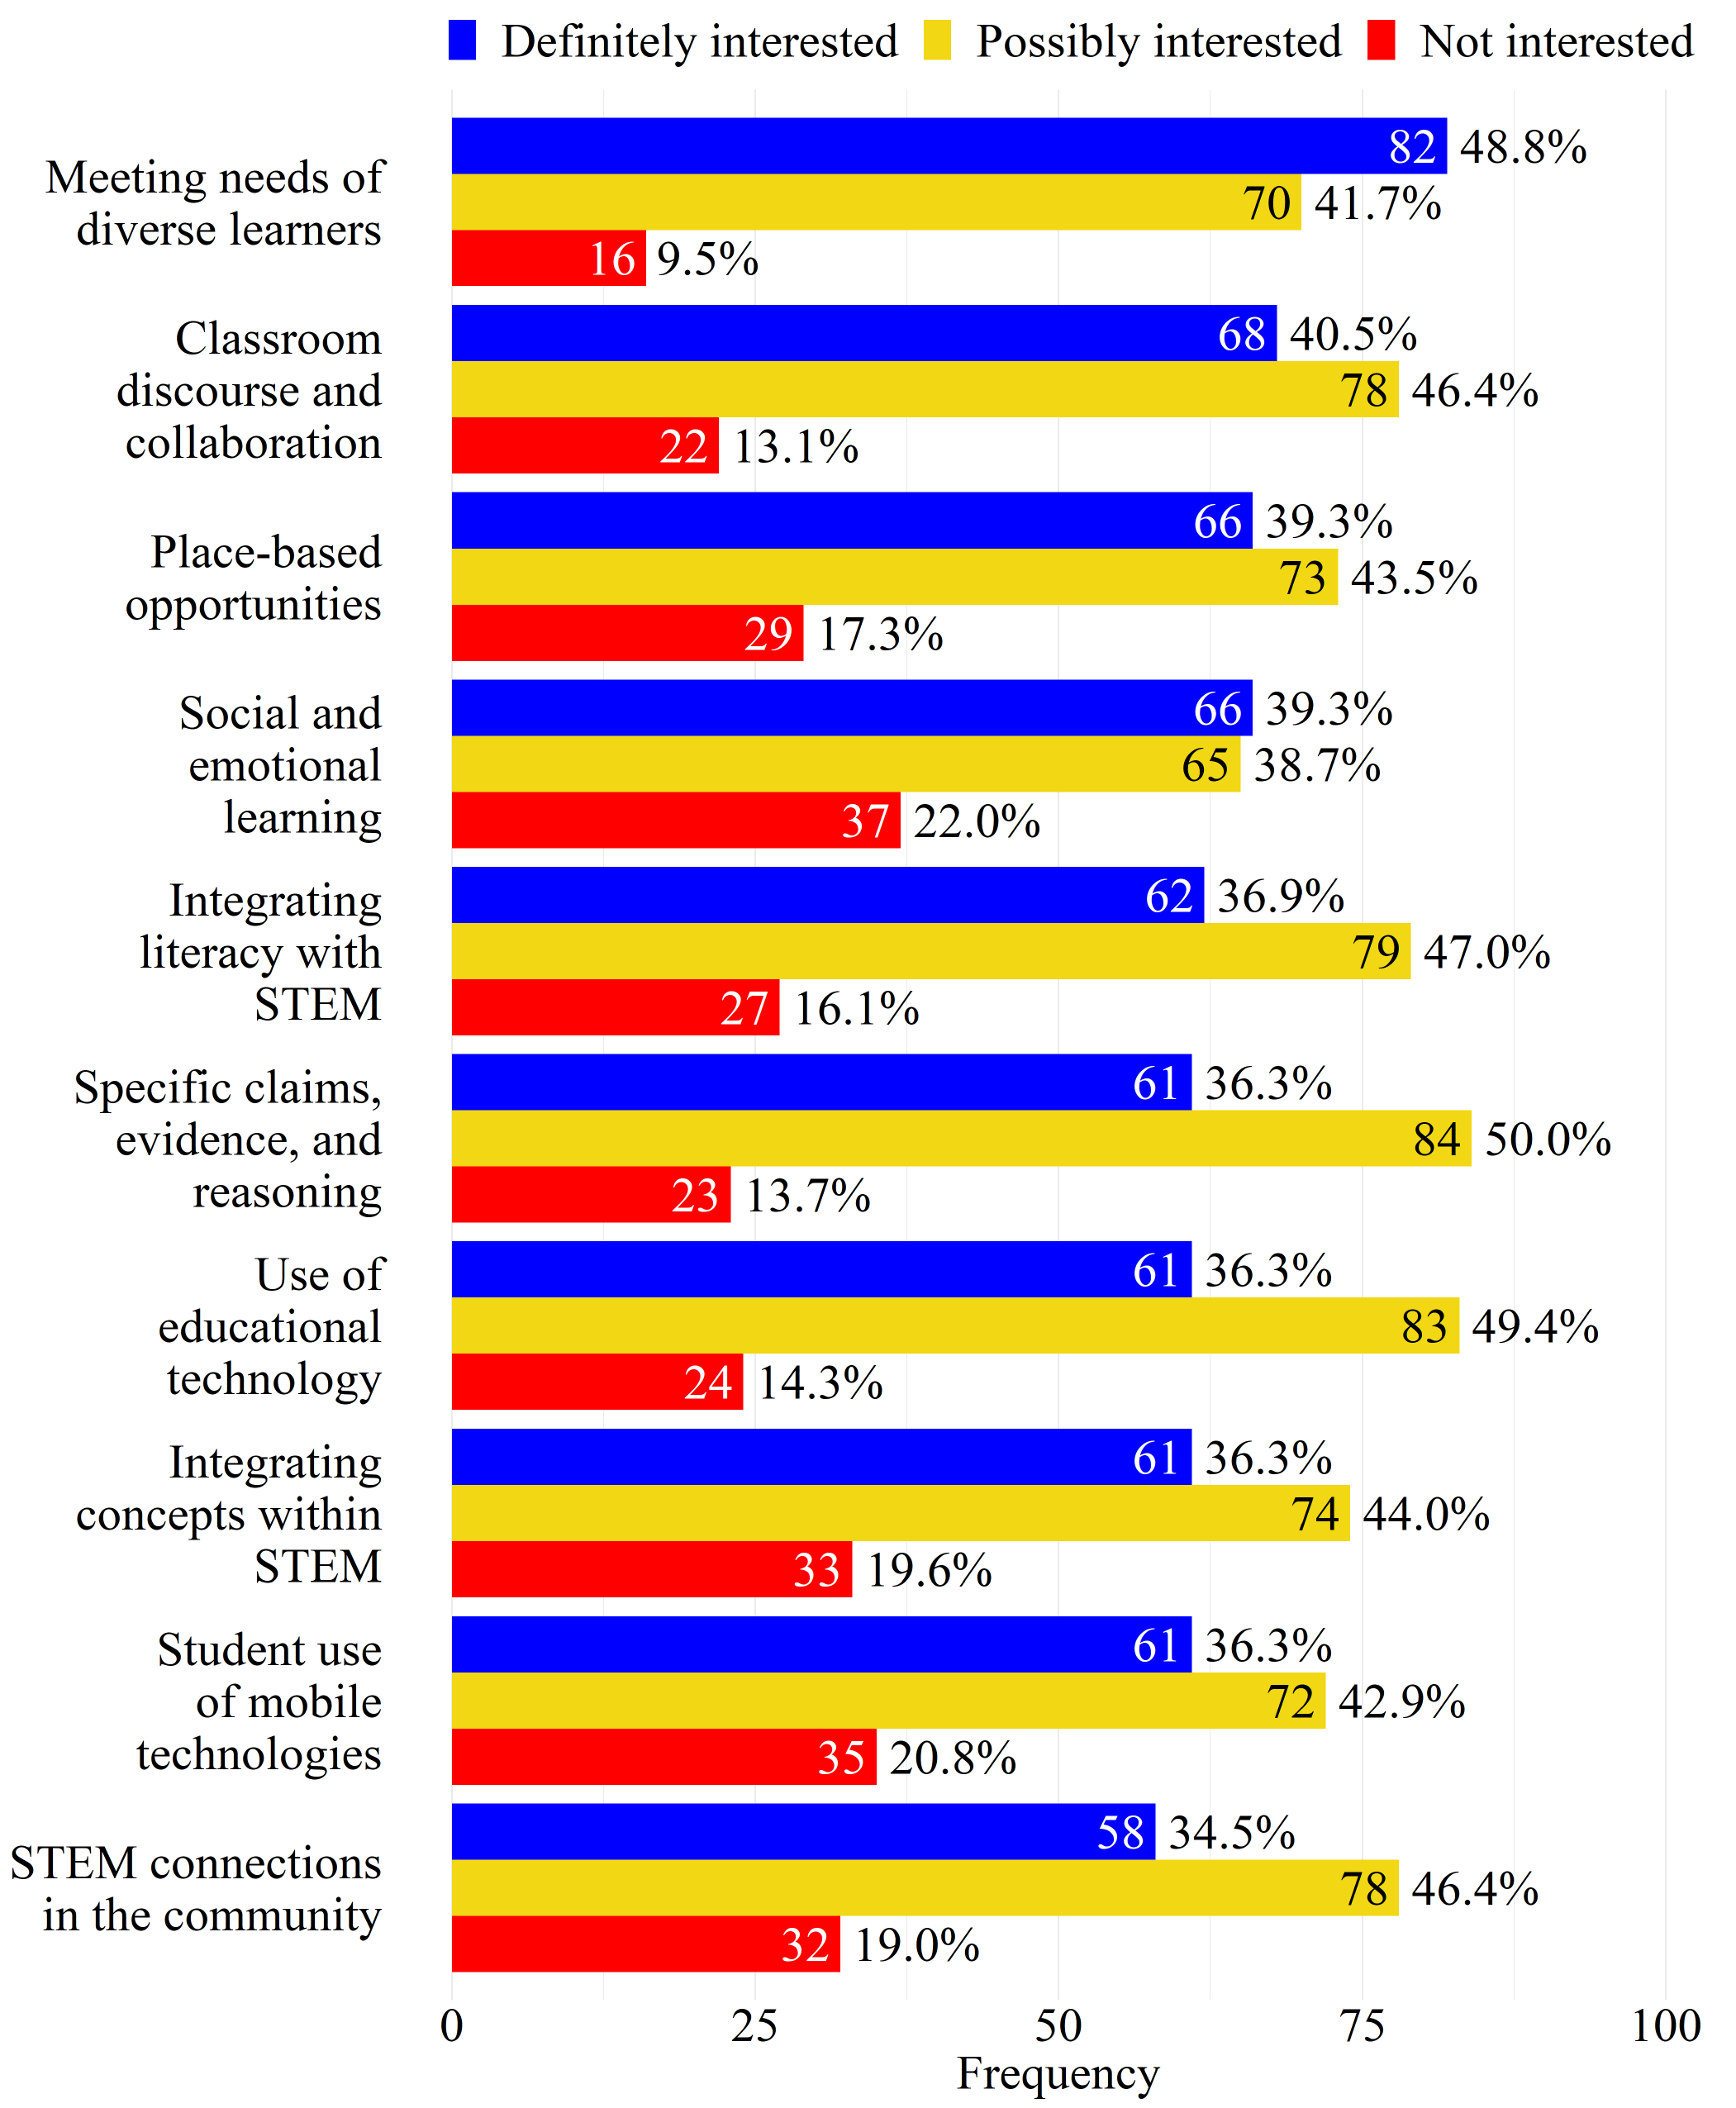
FIGURE 14. Interest in PD Topics (Ranks 11-20 by “Definitely Interested” Percent)
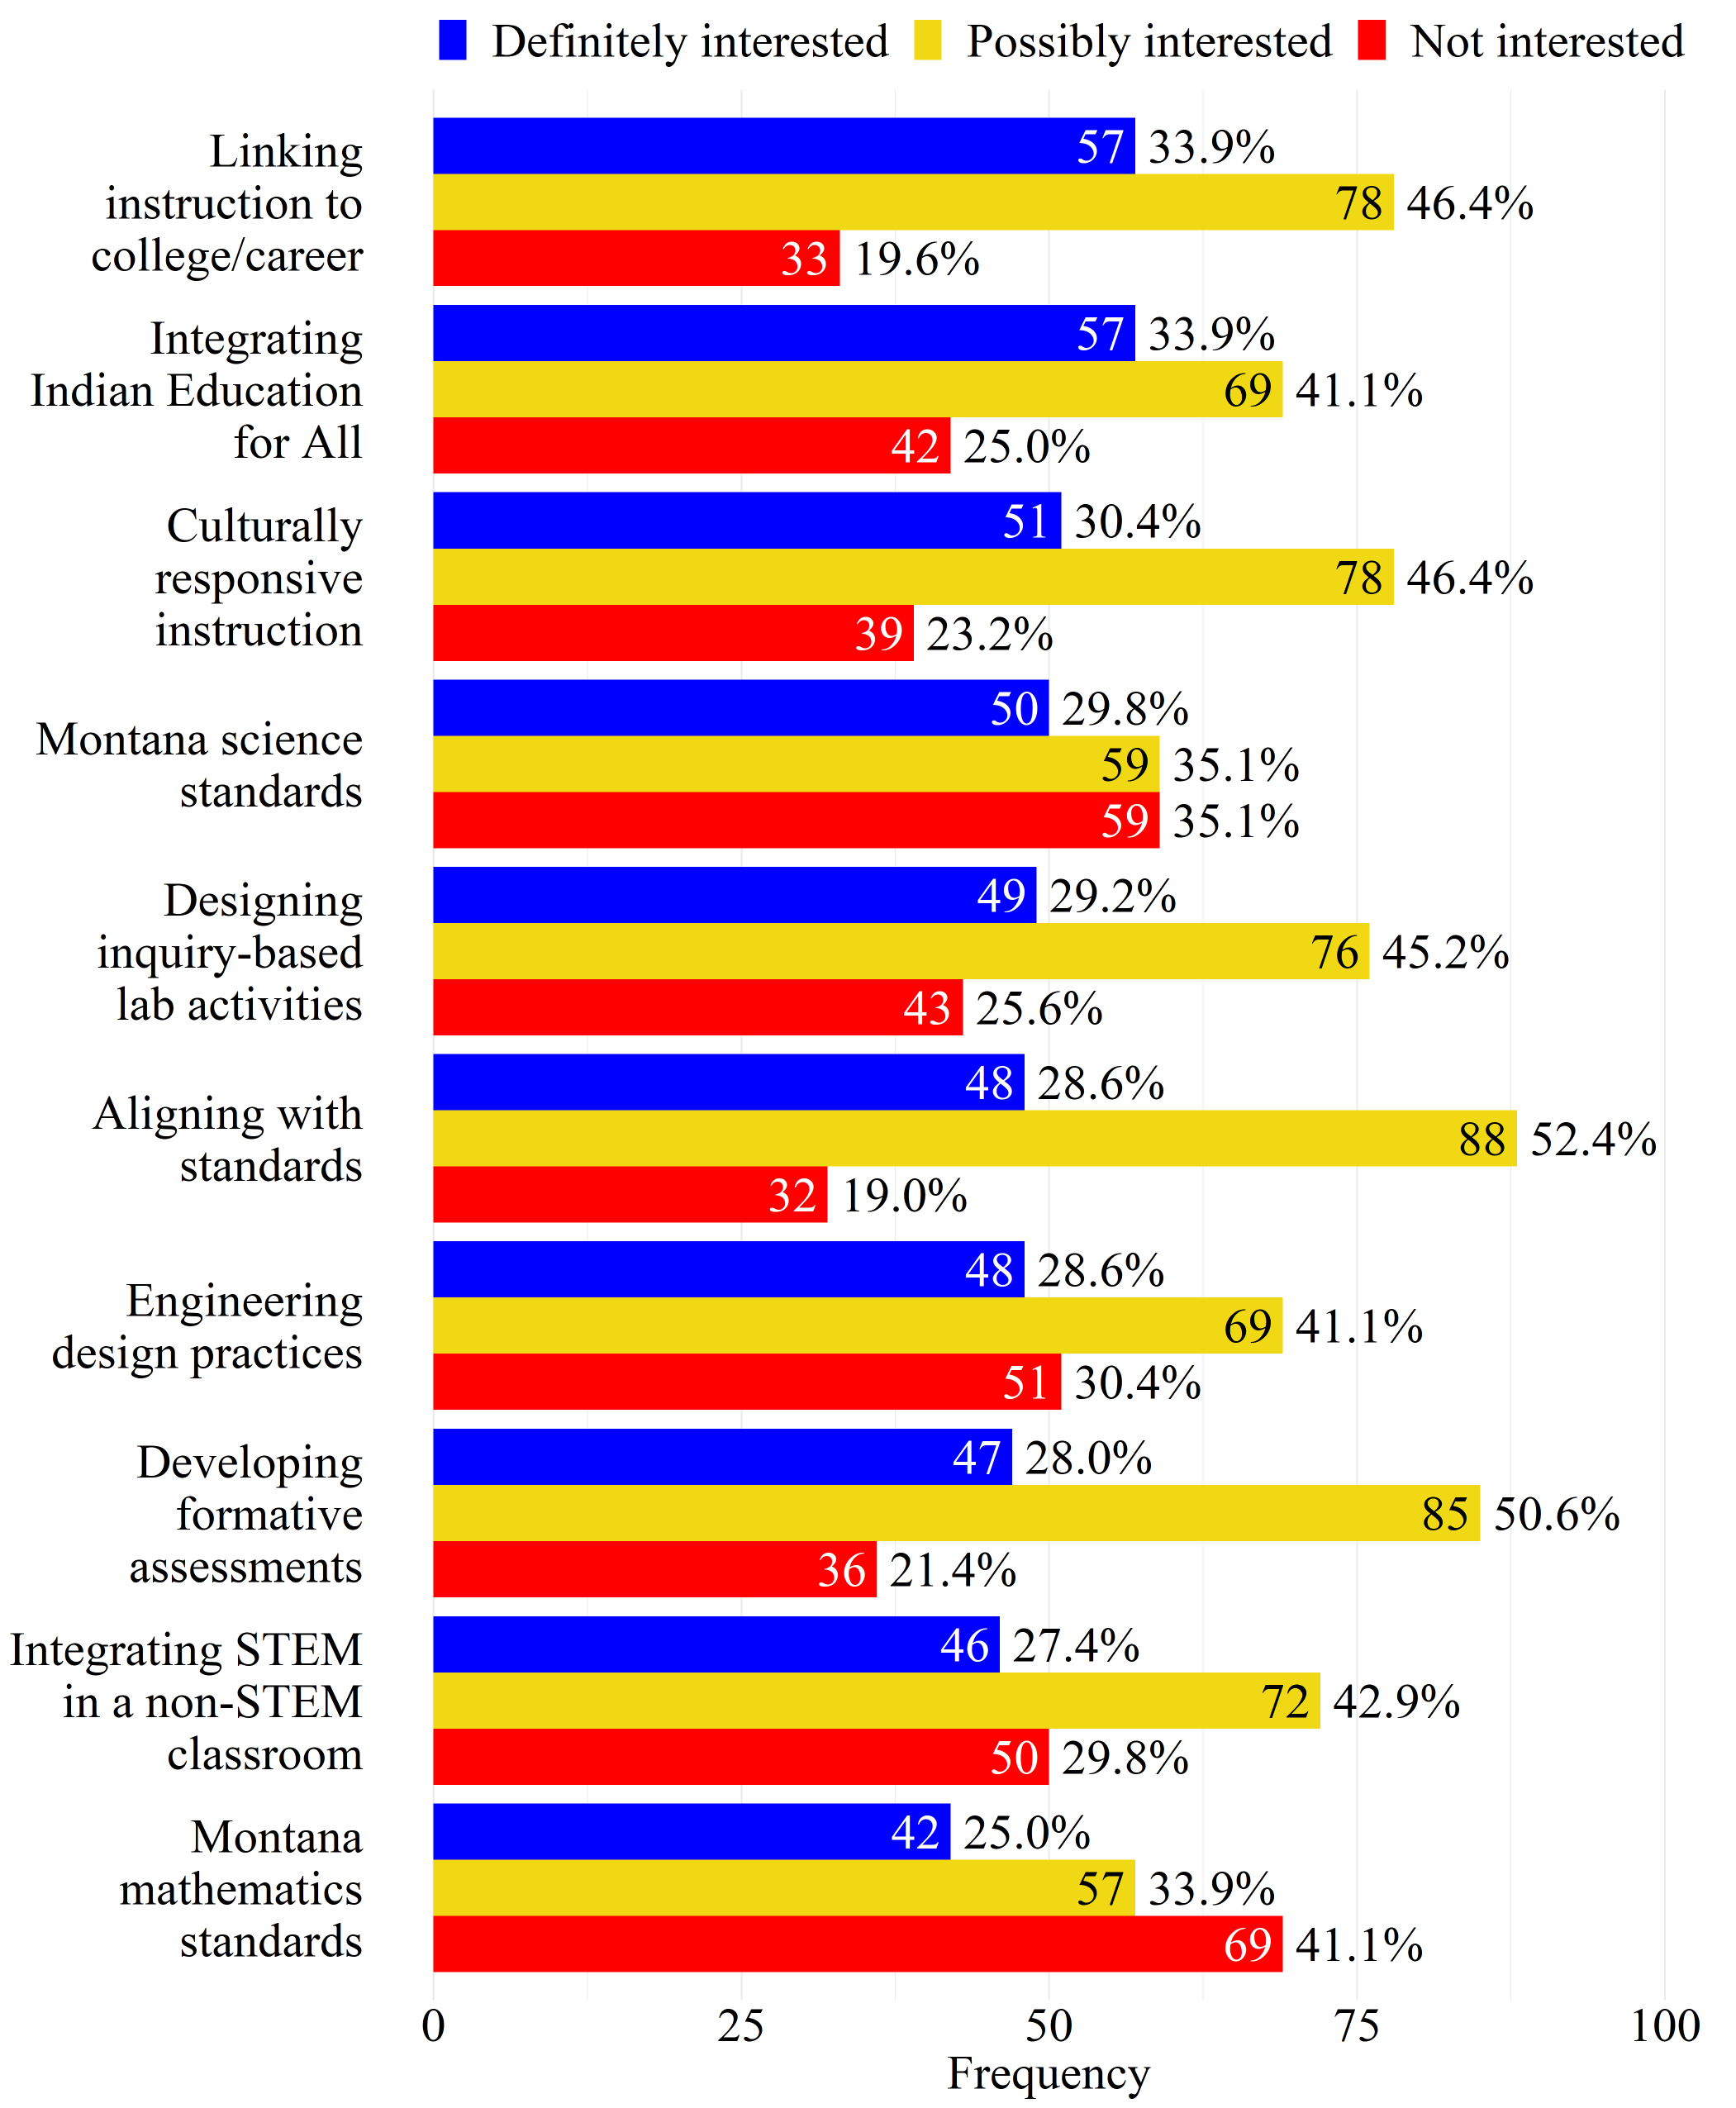
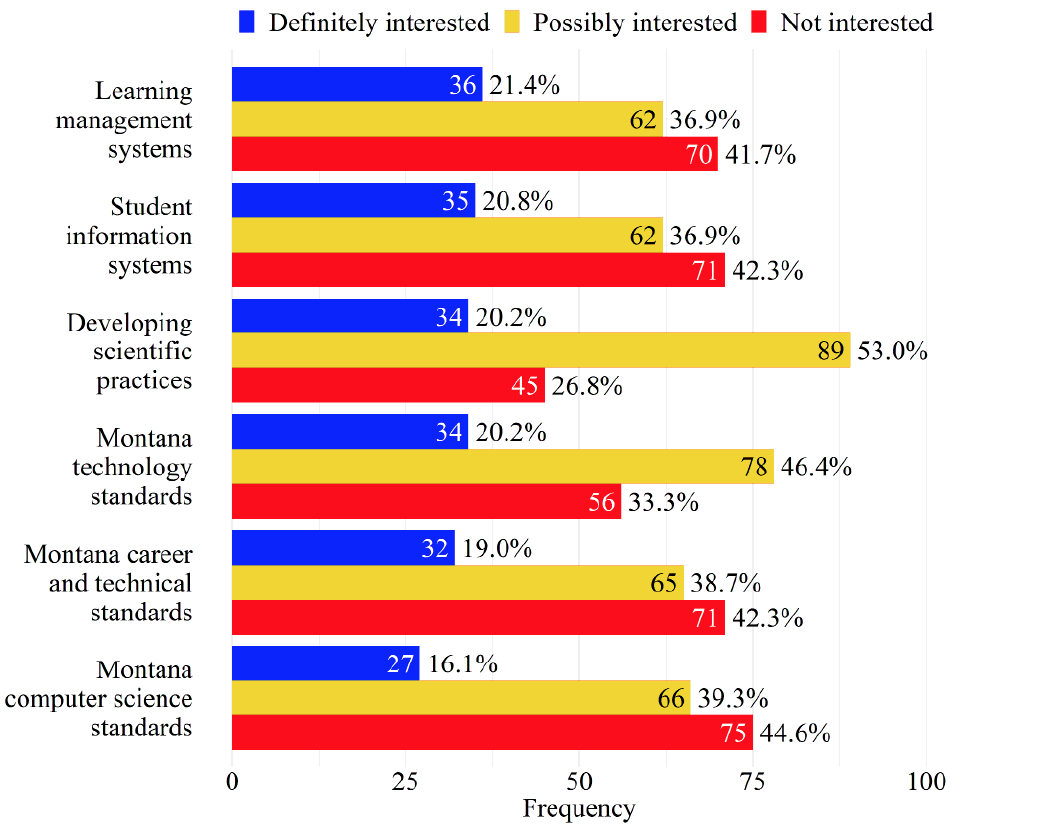
FIGURE 15. Interest in PD Topics (Ranks 21-26 by “Definitely Interested” Percent)
Note: Percents may not add to 100% due to rounding.
Usefulness of Data Set Resources and Interest in Water Quality Data Sets (n = 208, n = 180)
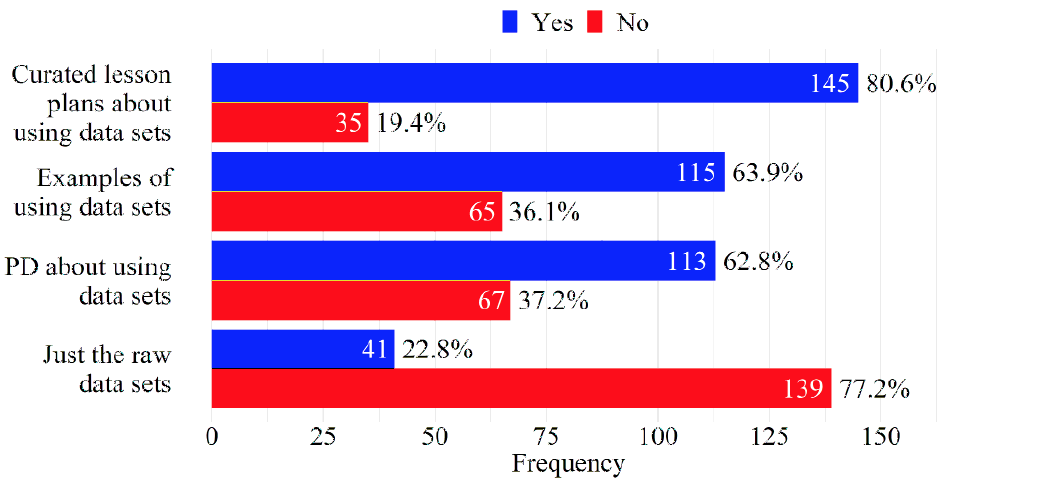
Because data collection and analysis are so important to research efforts such as Montana NSF EPSCoR, descriptive statistics regarding educators’ perceptions on the usefulness of data set resources are presented in Figure 16. Of the 208 educators in this sample, the vast majority were either possibly interested(n=119) or definitely interested(n=61)in having access to contemporary data sets that are currently being prepared and used by university researchers, while 28 educators were not intereste.Of the 180 with some level of interest in having access to data sets, educators most frequently report that curated lesson plans providing examples as to how data sets can be used and how they align with Montana standards are a useful resource (n=145).
In general, educators are not interested in receiving access to raw data sets, as most report this would not be useful (n=139).When asked if educators would like access to data sets related to how water quality is impacted by Montana activities such as mining, agriculture, and energy (the three focus areas of EPSCoR); 50 are definitely interested(24.0%), 82 are possibly interested(39.4%), and 47 are not interested(22.6%).
FIGURE 16. Usefulness of Data Set Resources
Note: Percents may not add to 100% due to rounding.
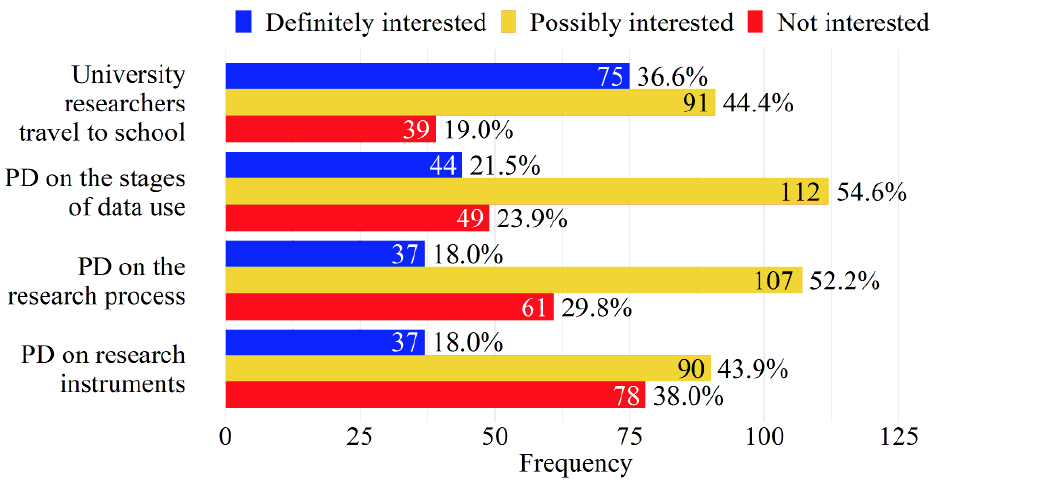
Interest in Resources Related to University Research (n = 205)
Descriptive statistics regarding interest in resources related to university research are presented in Figure 15. Gathering the most responses of being definitely interested is having university researchers travel to their school to interact directly with students regarding the research they are conducting (n = 75). Many educators are possibly interested in PD on: (a) how scientists collect, clean, visualize, and use data (n = 122); (b) the research process utilized by university researchers (n = 107); and (c) the design, manufacture, and testing of research instruments (n = 90).
FIGURE 17. Interest in Resources Related to University Research
Note: Percents may not add to 100% due to rounding.
Two-Way Relationships
Two-way heatmaps were created between educator/school district characteristics and survey questions about PD. Educator/school district characteristics included (a) teaching assignment subject type, (b) teaching assignment grade level, (c) hours of STEM PD, (d) locale, and (e) proximity to MUS campus. For each of these characteristics, a heatmap was created with each of the survey questions regarding the following topics: (a) access to technological resources, (b) barriers to PD, (c) attitudes toward STEM PD, (d) PD preferences, (e) importance of and interest in PD topics, (f) usefulness of data set resources, and (g) interest in resources related to university research.
Teaching assignment subject type and grade level were condensed into two categories due to small sample sizes. Subject type was condensed into either STEM (n = 175)—which includes career/technical, computer science, engineering, elementary education, mathematics, science, and technology—or non-STEM (n = 32)—which includes arts, music, etc.; English language arts, social studies/history, and all other subjects. Grade level was condensed into K-5 (n=58)—which includes K-2, 3-5, and K-5—or 6-12 (n = 132)—which includes 6-8, 9-12, and 6-12. Educators whose teaching assignment grade level included levels in both K-5 and 6-12 (e.g., 3-8, K-12, etc.; n=18) were omitted from the two-way analyses.
The following sections present heatmaps that display combinations of survey questions where a potential relationship was identified. Heatmaps that displayed combinations where a relationship was not evident were excluded from this report.
Findings by Teaching Assignment Subject Type
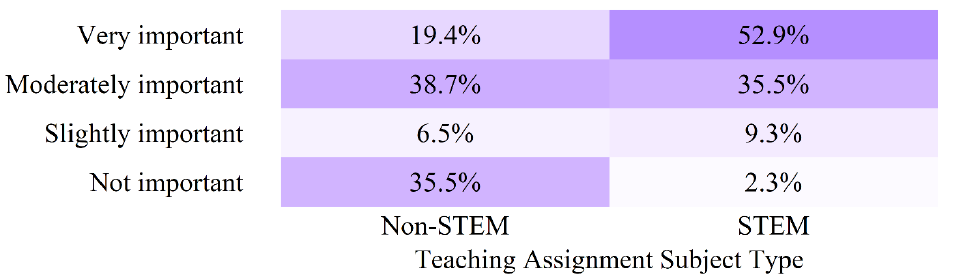
Importance of Professional Development Topics by Teaching Assignment Subject Type
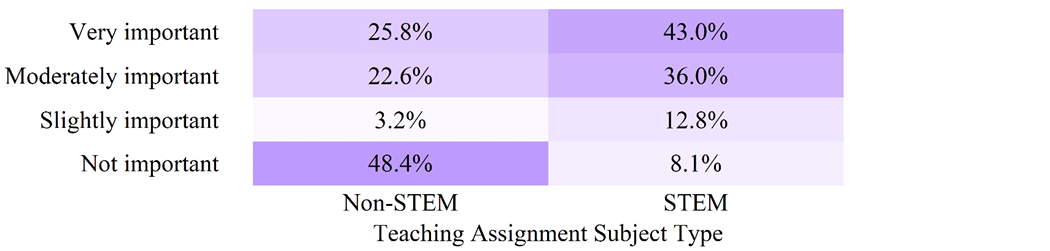
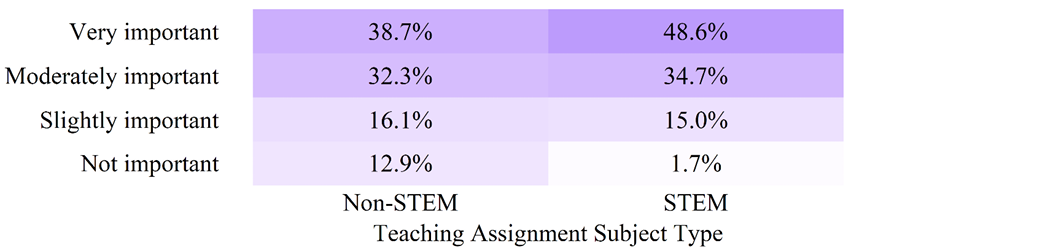
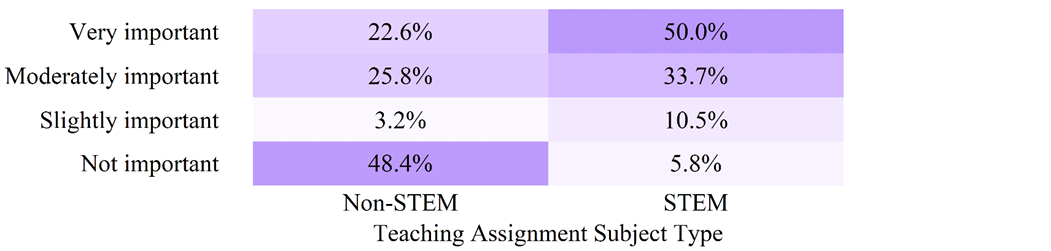
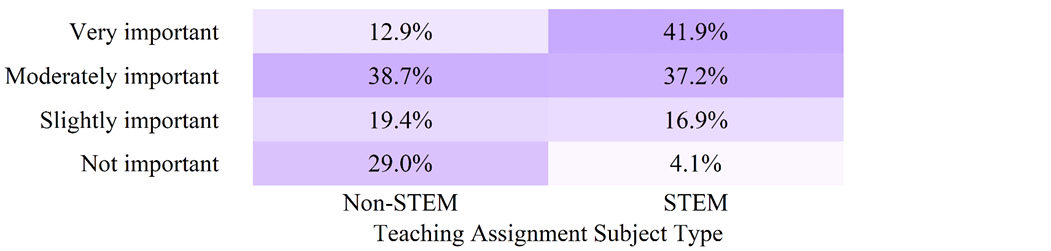
Figures 18-25 highlight the relationship between teaching a STEM subject and educators’ perceived importance of various STEM PD topics. These figures suggest that STEM educators place more importance on PD on several STEM topics when compared to non-STEM educators.
FIGURE 18. Subject Type and Importance of PD on STEM Connections in the Community (n=204)
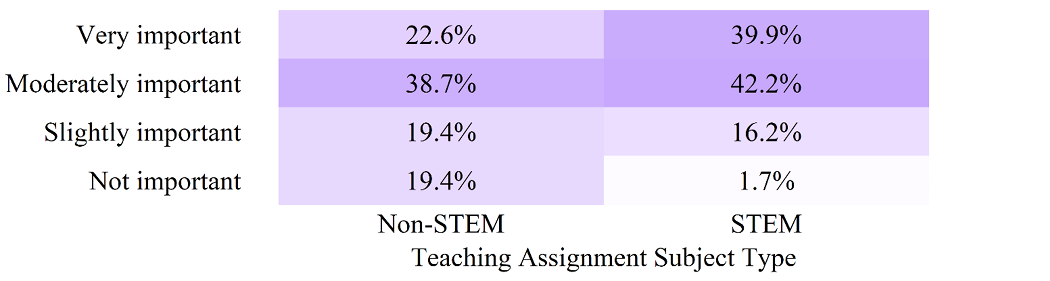
Note. Percents represent each column and may not add to 100% due to rounding.
FIGURE 19. Subject Type and Importance of PD on Engineering Design Practices (n=202)
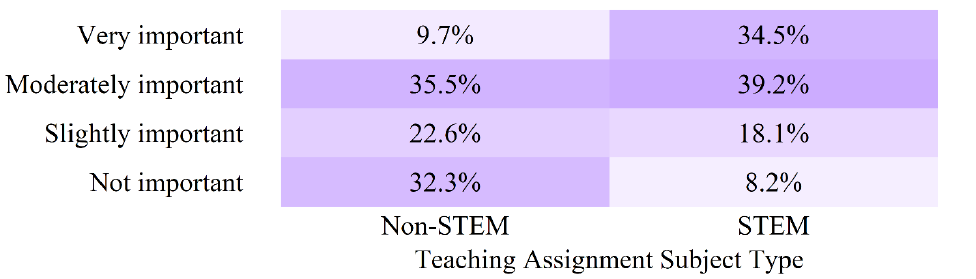
Note. Percents represent each column and may not add to 100% due to rounding.
FIGURE 20. Subject Type and Importance of PD on Designing Inquiry-Based Lab Activities (n=204)
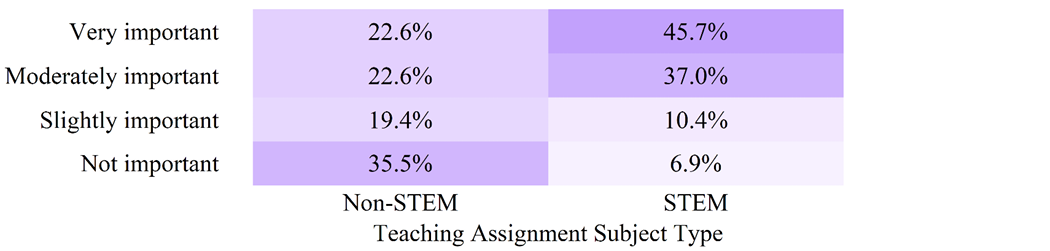
Note. Percents represent each column and may not add to 100% due to rounding.
FIGURE 21. Subject Type and Importance of PD on Montana Mathematics Standards (n=203)
Note. Percents represent each column and may not add to 100% due to rounding.
FIGURE 22. Subject Type and Importance of PD on Place-Based Opportunities (n=204)
Note. Percents represent each column and may not add to 100% due to rounding.
FIGURE 23. Subject Type and Importance of PD on Montana Science Standards (n=203)
Note. Percents represent each column and may not add to 100% due to rounding.
FIGURE 24. Subject Type and Importance of PD on Developing Scientific Practices (n=203)
Note. Percents represent each column and may not add to 100% due to rounding.
FIGURE 25. Subject Type and Importance of PD on Integrating Concepts Within STEM (n=203)
Note. Percents represent each column and may not add to 100% due to rounding.
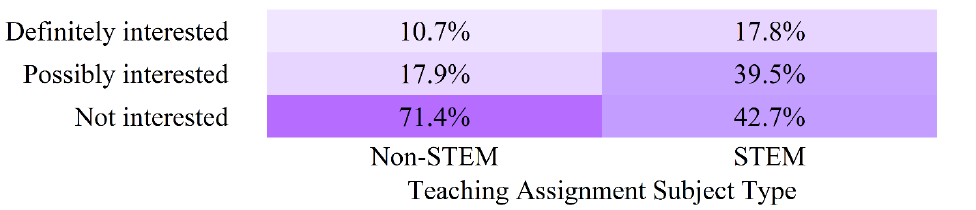
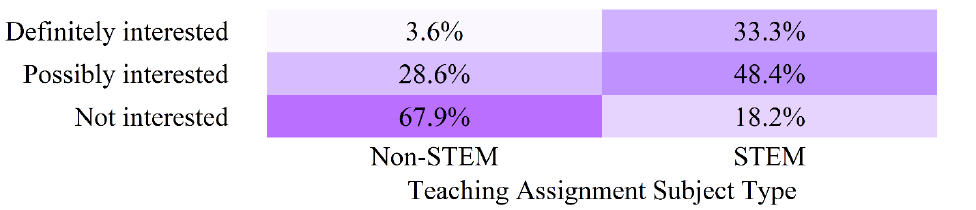
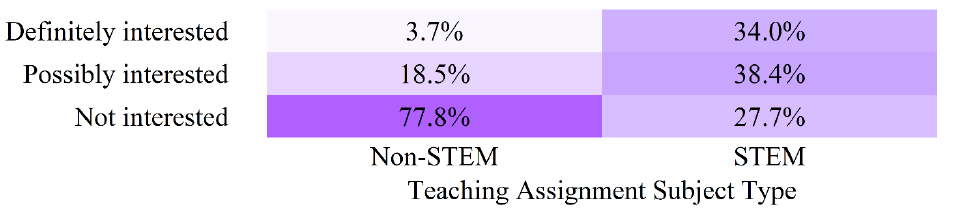
Interest in Professional Development Topics by Teaching Assignment Subject Type
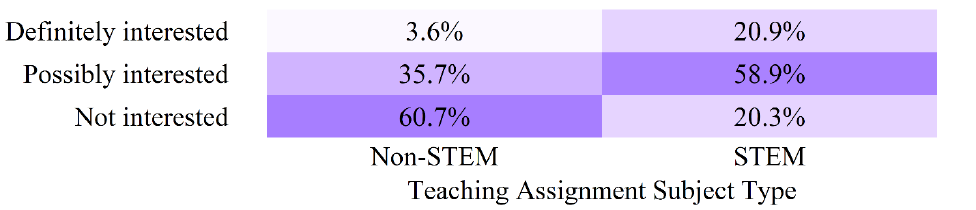
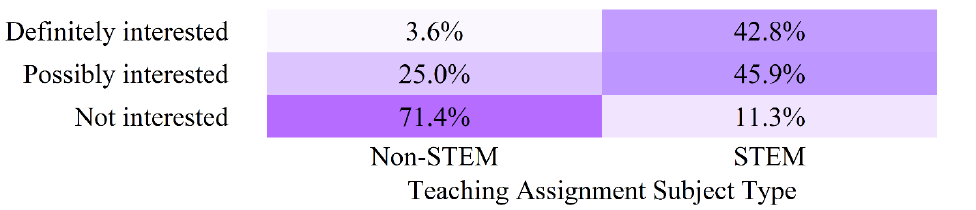
Similar to the findings in regard to the importance of PD topics, Figures 26-33 show that STEM educators are far more interested in attending PD on a variety of STEM topics when compared to non-STEM educators.
FIGURE 26. Subject Type and Interest in PD on STEM Connections in the Community (n = 185)

Note. Percents represent each column and may not add to 100% due to rounding.
FIGURE 27. Subject Type and Interest in PD on Montana Computer Science Standards (n = 185)
Note. Percents represent each column and may not add to 100% due to rounding.
FIGURE 28. Subject Type and Interest in PD on Engineering Design Practices (n = 185)

Note. Percents represent each column and may not add to 100% due to rounding.
FIGURE 29. Subject Type and Interest in PD on Designing Inquiry-Based Lab Activities (n = 187)
Note. Percents represent each column and may not add to 100% due to rounding.
FIGURE 30. Subject Type and Interest in PD on Montana Mathematics Standards (n = 185)

Note. Percents represent each column and may not add to 100% due to rounding.
FIGURE 31. Subject Type and Interest in PD on Montana Science Standards (n = 186)
Note. Percents represent each column and may not add to 100% due to rounding.
FIGURE 32. Subject Type and Interest in PD on Developing Scientific Practices (n = 186)
Note. Percents represent each column and may not add to 100% due to rounding.
FIGURE 33. Subject Type and Interest in PD on Integrating Concepts Within STEM (n = 187)
Note. Percents represent each column and may not add to 100% due to rounding.
Findings by Teaching Assignment Grade Level
Importance of Professional Development Topics by Grade Level
Figures 34-36 examine the relationship between educators’ grade level and their perceived importance of PD topics. Regarding PD on Montana mathematics and sciences standards, K-5 educators appear to view this topic as more important when compared to 6-12 educators. However, 6-12 educators seem to view PD on developing scientific practices as more important when compared to K-5 educators.
FIGURE 34. Grade Level and Importance of PD on Montana Mathematics Standards (n=187)
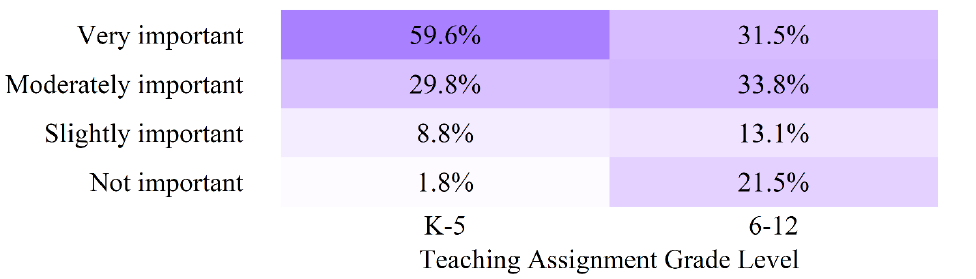
Note. Percents represent each column and may not add to 100% due to rounding.
FIGURE 35. Grade Level and Importance of PD on Montana Science Standards (n=188)
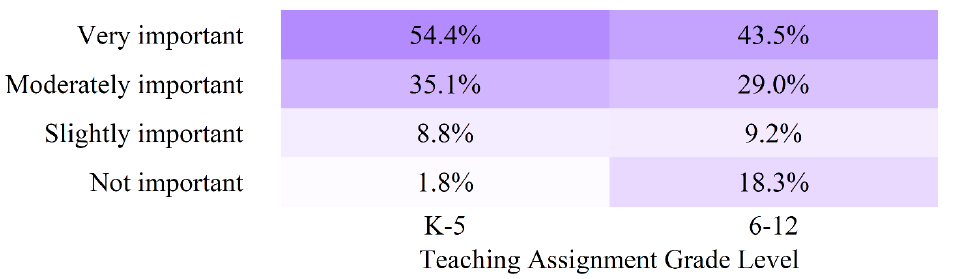
Note.Percents represent each column and may not add to 100% due to rounding.
FIGURE 36. Grade Level and Importance of PD on Developing Scientific Practices (n=187)
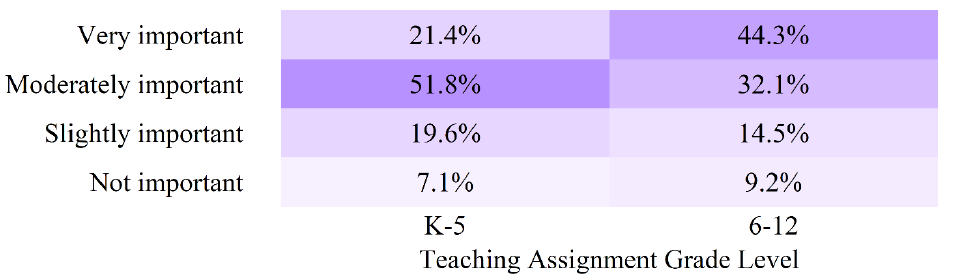
Note. Percents represent each column and may not add to 100% due to rounding.
Interest in Professional Development Topics by Grade Level
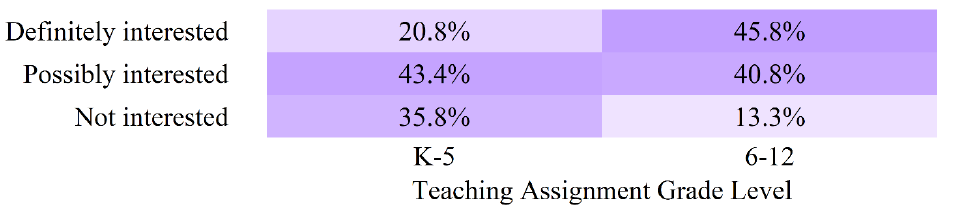
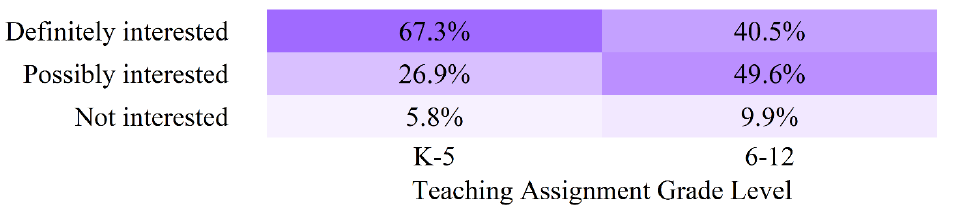
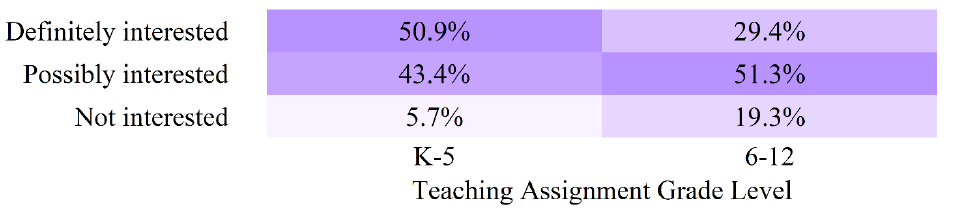
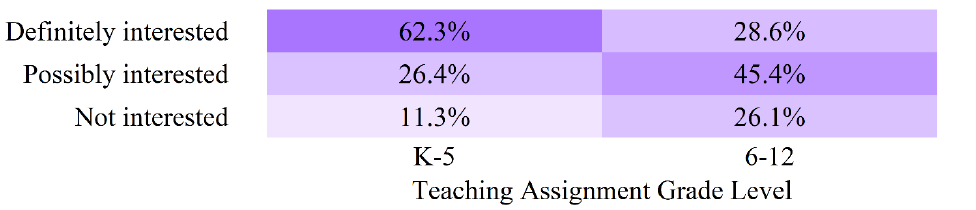
Figures 37-43 examine the relationship between educators’ grade level and their interest in various PD topics. Perhaps unsurprisingly, 6-12 educators reported more interest in PD on linking instruction to college/career when compared to K-5 educators. However, K-5 educators seem more likely to be interested in a variety of both STEM (e.g., Montana mathematics standards, Montana science standards) and non-STEM-specific (e.g., meeting needs of diverse learners, social and emotional learning) PD when compared to 6-12 educators.
FIGURE 37. Grade Level and Interest in PD on Linking Instruction to College/Career (n = 173)
Note. Percents represent each column and may not add to 100% due to rounding.
FIGURE 38. Grade Level and Interest in PD on Meeting Needs of Diverse Learners (n = 173)
Note. Percents represent each column and may not add to 100% due to rounding.
FIGURE 39. Grade Level and Interest in PD on Integrating Literacy with STEM (n = 172)
Note. Percents represent each column and may not add to 100% due to rounding.
FIGURE 40. Grade Level and Interest in PD on Montana Mathematics Standards (n = 171)
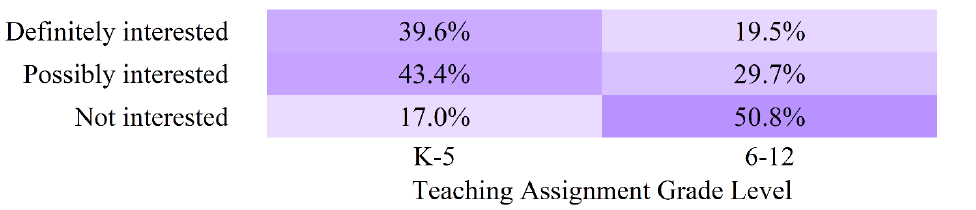
Note. Percents represent each column and may not add to 100% due to rounding.
FIGURE 41. Grade Level and Interest in PD on Montana Science Standards (n = 171)
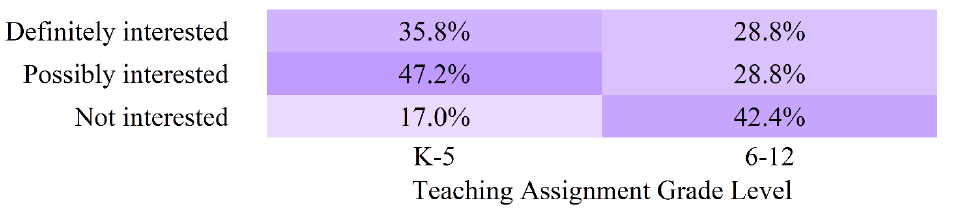
Note. Percents represent each column and may not add to 100% due to rounding.
FIGURE 42. Grade Level and Interest in PD on Social and Emotional Learning (n = 172)
Note. Percents represent each column and may not add to 100% due to rounding.
FIGURE 43. Grade Level and Interest in PD on Integrating STEM in a Non-STEM Classroom (n = 170)

Note. Percents represent each column and may not add to 100% due to rounding.
Findings by Hours of STEM Professional Development in the Past 12 Months
Attitudes Toward STEM Professional Development
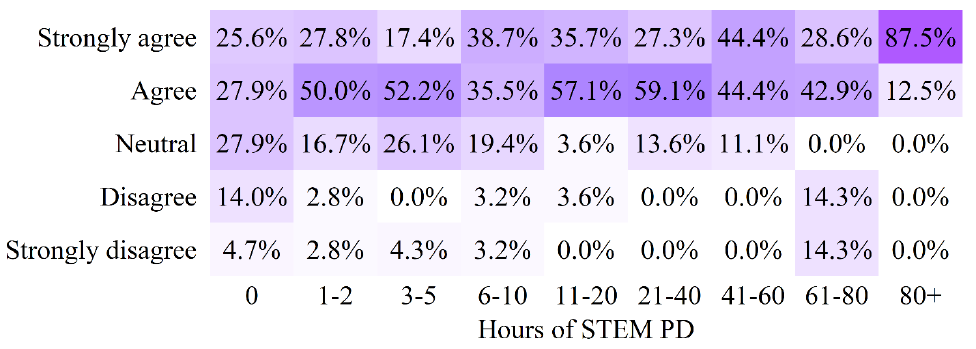
Figure 44 displays the relationship between educators’ interest in attending STEM PD and their hours of STEM PD in the past 12 months. The heatmap suggests a potential relationship, as educators with more hours of STEM PD in the past 12 months seem to be more likely to strongly agree or agree with being interested in attending STEM PD, as well as less likely to disagree.
FIGURE 44. Hours of STEM PD and Interest in Attending STEM PD (n = 207)
Note. Percents represent each column and may not add to 100% due to rounding.
Importance of Professional Development Topics and Hours of STEM PD
Figures 45-47 examine potential relationships between the importance of specific PD topics and hours of STEM PD in the past 12 months. In these figures, it appears that educators with more hours of STEM PD in the past 12 months are more likely to report the given STEM PD topics (designing inquiry-based lab activities, developing scientific practices, and integrating concepts within STEM) as more important when compared to educators with fewer hour of STEM PD.
FIGURE 45. Hours of STEM PD and Importance of PD on Designing Inquiry-Based Lab Activities (n = 205)
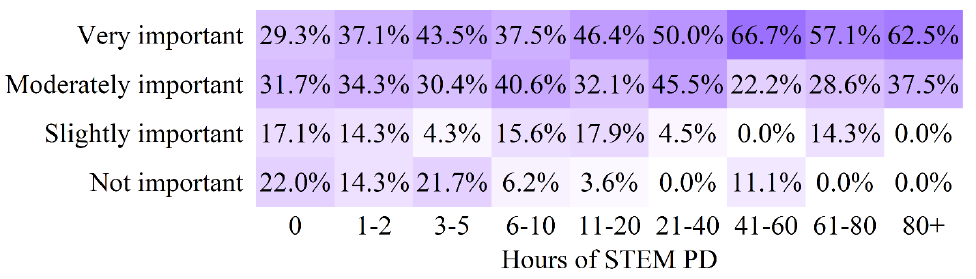
Note. Percents represent each column and may not add to 100% due to rounding.
FIGURE 46. Hours of STEM PD and Importance of PD on Developing Scientific Practices (n = 204)
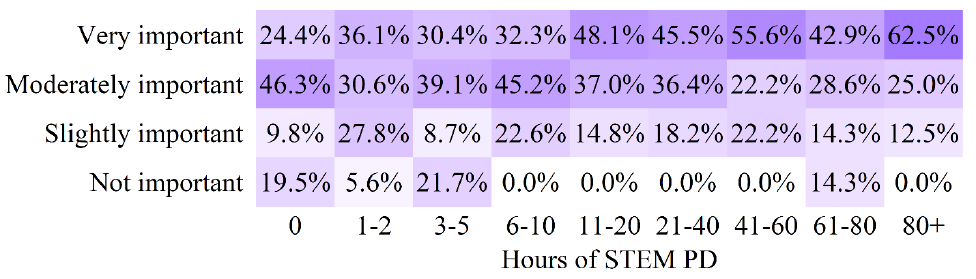
Note. Percents represent each column and may not add to 100% due to rounding.
FIGURE 47. Hours of STEM PD and Importance of PD on Integrating Concepts Within STEM (n = 204)
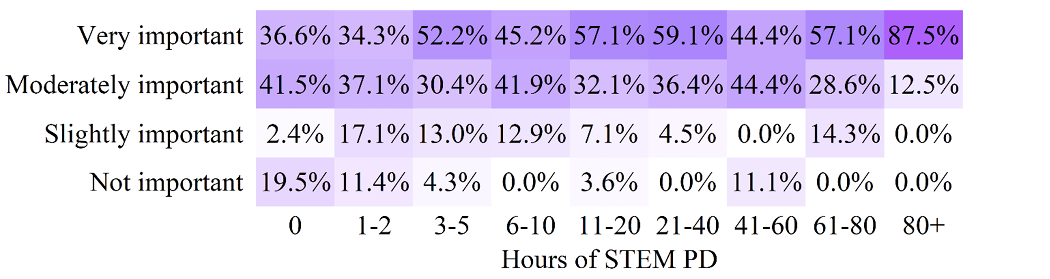
Note. Percents represent each column and may not add to 100% due to rounding.
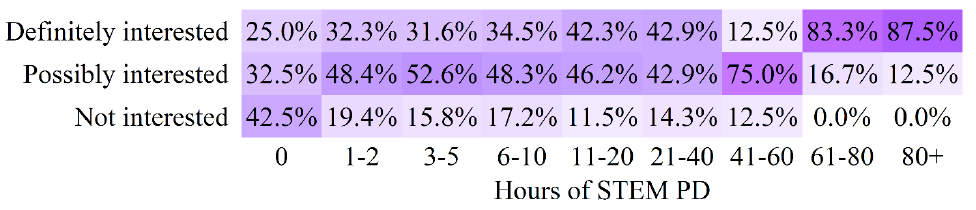
Interest in Professional Development Topics and Hours of STEM PD
Figures 48-50 examine potential relationships between interest (as opposed to importance) in participating in PD that is focused on the given topic and hours of STEM PD in the past 12 months. These heatmaps suggest that educators with more hours of STEM PD in the past 12 months are more likely to be interested in participating in PD that is focused on STEM topics (designing inquiry-based lab activities, developing scientific practices, and integrating concepts within STEM).
FIGURE 48. Hours of STEM PD and Interest in PD on Designing Inquiry-Based Lab Activities (n = 188)
This is the new one below for figure 48
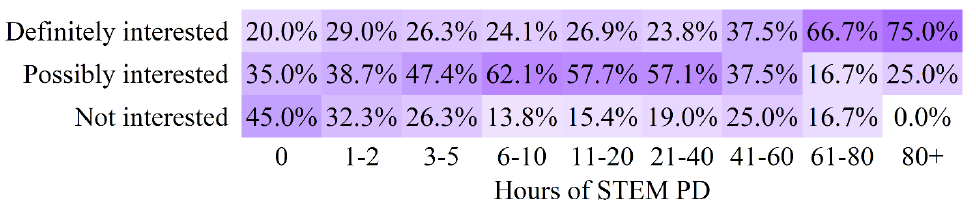
Note. Percents represent each column and may not add to 100% due to rounding.
FIGURE 49. Hours of STEM PD and Interest in PD on Developing Scientific Practices (n = 187)
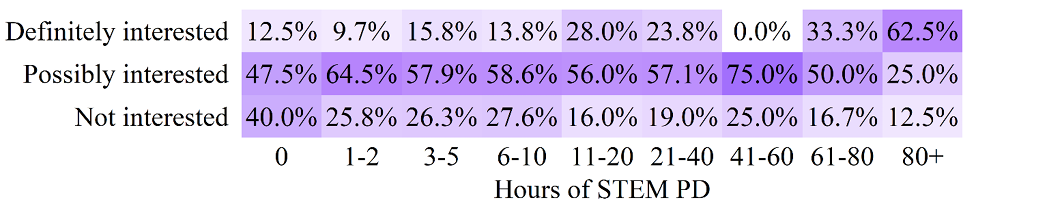
FIGURE 50. Hours of STEM PD and Interest in PD on Integrating Concepts Within STEM (n = 188)
Note. Percents represent each column and may not add to 100% due to rounding.
Findings by Locale
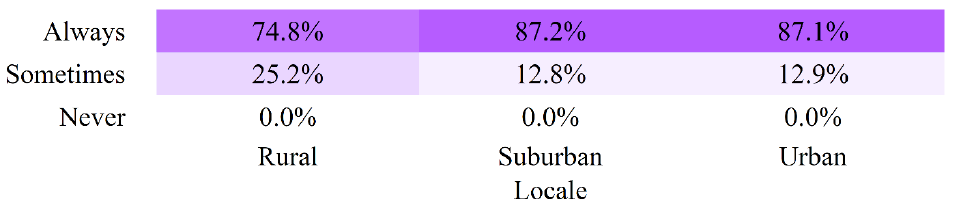
Access to Technological Resources by Locale
Though most educators reported that they always have access to a high-speed internet connection, Figure 51 shows that this access varies by school/district locale. While 87% of urban and suburban educators report that access to a high-speed internet connection is always available, just under 75% of rural educators report the same. Though no educators report that a high-speed internet connection is never available, nearly twice as many rural educators report that this connection is only sometimes available when compared to both urban and suburban educators.
FIGURE 51. Locale and Access to a High-Speed Internet Connection (n=205)
Note. Percents represent each column and may not add to 100% due to rounding.
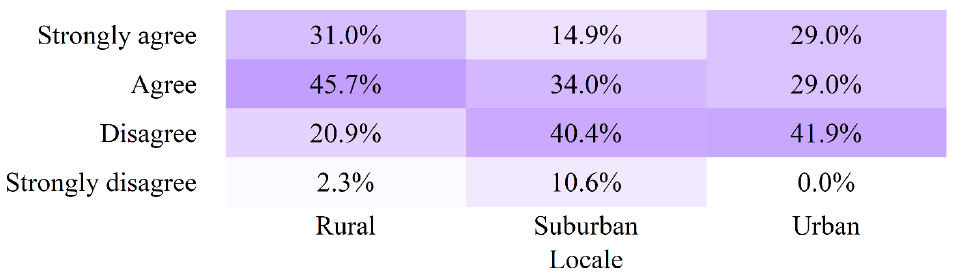
Barriers to Professional Development by Locale
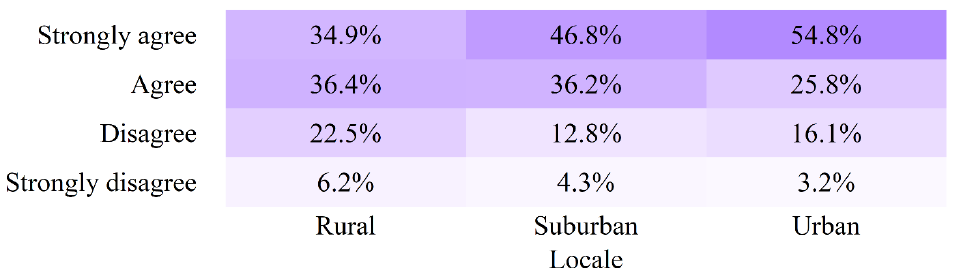
Figure 52 presents a heatmap with the PD barrier of significant travel distances and locale. In this figure, it seems that educators in rural areas are more likely to both strongly agree and agree with the statement that significant travel distances are a barrier to their PD participation.
Figure 53 examines the PD barrier of having to pay out of pocket to attend and locale. In this figure, it seems that educators in urban areas are more likely to strongly agree with the statement that having to pay out of pocket is a barrier to their PD participation.
Interestingly, availability of substitute teachers seems to be a more impactful barrier to PD for urban educators, as shown in Figure 54.
FIGURE 52. Locale and Significant Travel Distances are a Barrier to PD (n = 207)
Note. Percents represent each column and may not add to 100% due to rounding.
FIGURE 53. Locale and Having to Pay out of Pocket to Attend is a Barrier to PD (n = 207)
Note. Percents represent each column and may not add to 100% due to rounding.
FIGURE 54. Locale and Availability of Substitute Teachers is a Barrier to PD (n = 207)
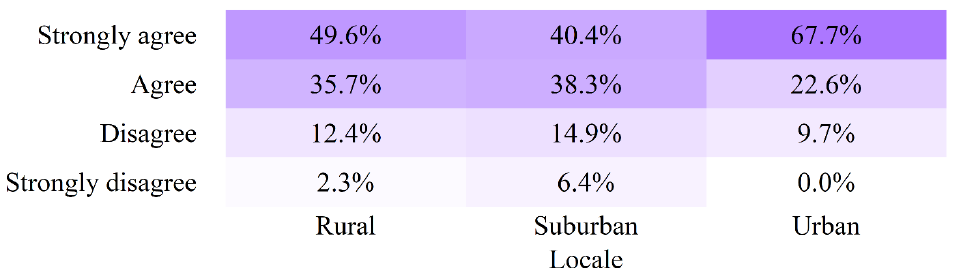
Note. Percents represent each column and may not add to 100% due to rounding.
Professional Development Preferences by Locale
The heatmap in Figure 55 suggests that educators have a stronger interest in traveling to a central location (Billings, Bozeman, or Missoula) to attend a face-to-face PD session as their locale size decreases. Evidence of this trend can be found in the row displaying responses of definitely interested.
FIGURE 55. Locale and Interest in Face-to-Face PD at a Central Location (n = 208)
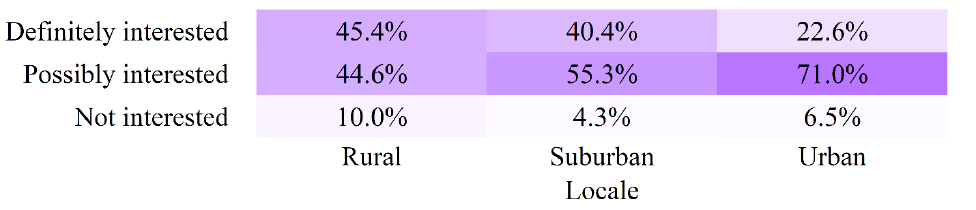
Note. Percents represent each column and may not add to 100% due to rounding.
Findings by Proximity to MUS Campus
Barriers to Professional Development by Proximity to MUS Campus
Figure 56 shows a potential relationship between the PD barrier of significant travel distances and proximity to MUS campus. This figure suggests that significant travel distances are a more impactful barrier to PD for educators that live farther from an MUS campus.
FIGURE 56. Proximity to MUS Campus and Significant Travel Distances are a Barrier to PD (n = 207)
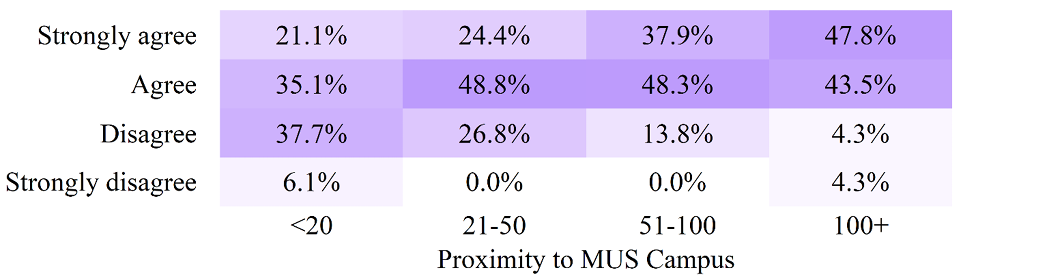
Note. Percents represent each column and may not add to 100% due to rounding.
Interest in Resources Related to University Research
In Figure 57, it appears that educators located farther from an MUS campus have a stronger interest in having university researchers travel to their school to interact directly with students regarding the research they are conducting.
FIGURE 57. Proximity to MUS Campus and Interest in University Researchers Traveling to School (n = 205)
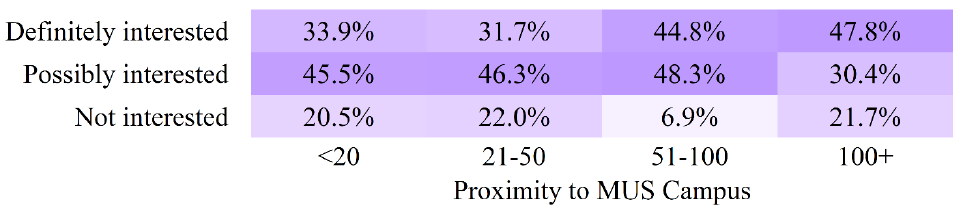
Note. Percents represent each column and may not add to 100% due to rounding.
Discussion and Implications
Hours of Professional Development in the Past 12 Months
A discrepancy between all hours of PD and hours of STEM PD is evident in this report. While 90.4% of educators have more than ten hours of PD over the past 12 months at the time of this survey, just 35.6% of educators have more than ten hours of STEM PD during the same time period. Furthermore, this lack of STEM PD hours also applies to STEM educators specifically, as just 41.1% of STEM educators have more than ten hours of STEM PD in the 12 months prior to this survey (Figure 58).
As shown when examining heatmaps with hours of STEM PD combined with other survey questions, additional hours of STEM PD appear to be associated with increased interest in attending STEM PD and increased importance of and interest in various STEM PD topics. This presents a dilemma, as it seems that educators with many hours of STEM PD do not need additional encouragement to attend more STEM PD, but those with few hours seem to not see as much value in STEM PD and may have little interest in attending.
This could be essentially a marketing issue, with split strategies: Educators with many hours of STEM PD need only be made aware of existing opportunities for more STEM PD, whereas those with few hours of STEM PD may need more information on how each STEM PD opportunity can benefit their classrooms and students. Teachers of non-STEM-specific subjects might need additional information on how the concepts and processes often included in STEM PD can enhance non-STEM-specific subjects.
FIGURE 58. Hours of STEM PD and Subject Type (n = 207)
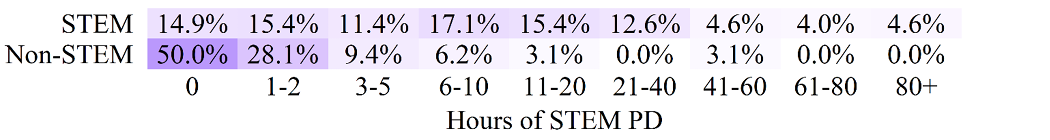
Note. Percents represent each row and may not add to 100% due to rounding.
Access to Technological Resources
Though access to technological resources did not appear to be a major concern overall, educators in rural locales reported less reliable access to a high-speed internet connection. Perhaps a fairly obvious focus ought to be to improve the high-speed internet infrastructure of rural school districts in Montana.
Barriers to Professional Development
The two primary barriers to educators’ participation in PD are availability of substitute teachers and having to pay out of pocket to attend, though the majority of educators strongly agree or agree with all of the proposed barriers in this survey (i.e., not enough time off from work, significant travel distances, and school has insufficient resources). Additionally, urban educators recognize both having to pay out of pocket and availability of substitute teachers as barriers more frequently than educators in other locales. Perhaps unsurprisingly, both rural educators and educators located farther from an MUS campus are more likely to demonstrate some level of agreement to significant travel distances acting as a barrier to PD participation. These findings indicate that to the extent possible, entities that offer PD for educators should consider ways to subsidize travel expenses and the costs of substitute teachers.
Attitudes Toward STEM Professional Development
Overall, educators report positive attitudes toward STEM PD—showing an interest in attending and recognizing the beneficial aspects of STEM PD. However, the majority of educators neither strongly agree nor agree that quality STEM PD is readily available. A solution to this lack of quality STEM PD ought to be pursued, perhaps in the form of additional STEM PD offerings or increased advertisement of STEM PD opportunities.
Professional Development Preferences
Educators’ top four preferences for PD locations and delivery methods are face-to-face at their school, collaborating with other teachers in a professional learning community, face-to-face in their district, and face-to-face at a central location (Billings, Bozeman, or Missoula). The four most prevalent PD times and durations are one-time sessions during school hours for either a half day, full day, or 1-2 hours; and intensive summer workshops for three or more days. Additionally, educators in rural locales are more likely to report interest in traveling to a central location to attend a face-to-face PD session.
Importance of and Interest in Professional Development Topics
PD topics that educators perceived to be most important include:
- meeting the needs of diverse learners;
- classroom discourse and effective collaboration;
- use of educational technology; and
- developing specific claims, evidence, and reasoning.
Topics that are the focus of PD that educators were most interested in attending include:
- meeting the needs of diverse learners;
- classroom discourse and effective collaboration;
- place-based opportunities; and
- social and emotional learning.
Table 2 presents each PD topic and its ranking in regard to both importance and interest. While rankings of importance and interest are quite similar in general, a few outliers are present. Two PD topics (aligning with standards and developing formative assessments) have much higher rankings for importance than interest while social and emotional learning has a higher interest ranking than importance.
Additionally, it is worth mentioning that meeting needs of diverse learners and classroom discourse and collaboration were ranked first and second for both importance and interest.
Lastly, Montana computer science standards was viewed as the least important PD topic and attracted the least interest. This is likely due to the fact that Montana’s K-12 computer science standards were not set to be implemented until July 1, 2021.
Table 2. RANKINGS FOR IMPORTANCE OF AND INTEREST IN PD TOPICS
(n=194, n=168)
|
PD Topic |
Ranking |
|
|
|
Importance |
Interest |
|
Meeting needs of diverse learners |
1 |
1 |
|
Classroom discourse and collaboration |
2 |
2 |
|
Use of educational technology |
3 |
7 |
|
Specific claims, evidence, and reasoning |
4 |
6 |
|
Integrating literacy with STEM |
5 |
5 |
|
Aligning with standards |
6 |
16 |
|
Integrating concepts within STEM |
7 |
8 |
|
Place-based opportunities |
8 |
3 |
|
Montana science standards |
9 |
14 |
|
Developing formative assessments |
10 |
18 |
|
Student use of mobile technologies |
11 |
9 |
|
Integrating Indian Education for All |
12 |
12 |
|
Designing inquiry-based lab activities |
13 |
15 |
|
Social and emotional learning |
14 |
4 |
|
Linking instruction to college/career |
15 |
11 |
|
Montana mathematics standards |
16 |
20 |
|
STEM connections in the community |
17 |
10 |
|
Culturally responsive instruction |
18 |
13 |
|
Developing scientific practices |
19 |
23 |
|
Montana technology standards |
20 |
24 |
|
Integrating STEM in a non-STEM classroom |
21 |
19 |
|
Student information systems |
22 |
22 |
|
Engineering design practices |
23 |
17 |
|
Montana career and technical standards |
24 |
25 |
|
Learning management systems |
25 |
21 |
|
Montana computer science standards |
26 |
26 |
Usefulness of Data Set Resources
For those educators who indicated an interest in having access to contemporary data sets that are currently being prepared and used by university researchers, the resource that educators find most useful is curated lesson plans providing examples as to how data sets can be used and how they align with Montana standards. Educators report some usefulness of both examples demonstrating how data sets can be used to demonstrate real-world problems and PD designed to stimulate ideas as to how data sets can be used in the classroom, but generally do not perceive access to raw data sets as useful. For those seeking to incorporate statistics education and/or authentic university research into the K-12 curricula, curated lesson plans will likely be received positively by educators.
Interest in Resources Related to University Research
Educators are primarily interested in having university researchers travel to their school to interact directly with students regarding the research they are conducting, with the most interested group of educators being those who are far from an MUS campus. Additionally, many educators state that they are possibly interested in PD on:
(a) how scientists collect, clean, visualize, and use data;
(b) the research process utilized by university researchers; and
(c) the design, manufacture, and testing of research instruments.
These findings suggest that researchers who wish to share their work with K-12 teachers and students could make headway by planning and budgeting for travel to schools and to share information about their processes and instruments used. These strategies should be included in Broader Impacts (BI) plans.
Conclusion and Recommendations
This report presents useful information regarding educators’ PD preferences and interests, attitudes toward and interest in STEM PD, and interest in data sets and research practices. Additionally, several specific PD needs have been identified for both rural educators and educators located far from an MUS campus.
In future surveys of K-12 educators, it is recommended that the survey be as concise as possible and that responses to each survey question are required. It is very likely that the length of this survey and the ability to skip questions contributed to the excessive number of missing responses. Due to the quite coincidental timing of this survey release in relation to the COVID-19 pandemic, the researchers believe a post-COVID-19 repeat of some questions—particularly those related to interest in and acceptance of online PD—would yield a useful contrast.
References
Grimberg, B. I., & Hendrikx, S. (2013). Montana STEM educator needs assessment survey report. Science Math Resource Center, Montana State University.
Appendix A: Montana NSF EPSCoR Strategic Plan
The NSF EPSCoR strategic plan Objective 2.3.b activities are listed below:
• Activity 1: Work with K-12 teachers to identify appropriate content and format for teacher professional development opportunities.
• Activity 2: Develop course content and media for K-12 educators that present project findings and related concepts, incorporating ecological, molecular, and social science.
• Activity 3: Develop and implement teacher professional development opportunities based on identified content and format from Activity 1.
Appendix B: Survey Questions
Question 1
Reporting only on your current teaching assignment, which subject(s) do you teach at the following grade levels? Please check all that apply.
1. Arts (Fine Arts, Visual Arts, Music, etc.)
2. Career/Technical
3. Computer Science
4. Elementary Education
5. Engineering
6. English Language Arts
7. Mathematics
8. Science
9. Social Studies/History
10. Technology
11. All other subjects
Response Options*
Grades K-2, Grades 3-5, Grades 6-8, and/or Grades 9-12
*Separated into two variables (subject and grade) in analysis.
Question 2**
What proportion of your current teaching assignment is in each subject area?
1. Arts (Fine Arts, Visual Arts, Music, etc.)
2. Career/Technical
3. Computer Science
4. Elementary Education
5. Engineering
6. English Language Arts
7. Mathematics
8. Science
9. Social Studies/History
10. Technology
11. All other subjects
**Omitted prior to analysis due to an excessive number of missing responses.
Response Options
No teaching, Less than half, About half, More than half, or All of my teaching
Question 3
Including this school year, how many years have you taught at the K-12 level?
Response Options
0-2 years, 3-5 years, 6-10 years, 11-15 years, 16-20 years, or Over 20 years
Question 4
Approximately how many hours of professional learning have you participated in during the past 12 months?
Response Options
0 hours, 1-2 hours, 3-5 hours, 6-10 hours, 11-20 hours, 21-40 hours, 41-60 hours, 61-80 hours, or More than 80 hours
Question 5
Approximately how many of these hours emphasized STEM (science, technology, engineering, or math) teaching and learning or STEM integration?
Response Options
0 hours, 1-2 hours, 3-5 hours, 6-10 hours, 11-20 hours, 21-40 hours, 41-60 hours, 61-80 hours, or More than 80 hours
Question 6
In my own terms, I would classify my school district as:
Response Options
Rural, Suburban, or Urban
Question 7
My school district is located in:
Response Options
Northwest Montana, North Central Montana, Northeast Montana, Southwest Montana, South Central Montana, or Southeast Montana
Question 8
How close is the nearest Montana University System (MUS) campus to your school district? The MUS is comprised of all Montana Community Colleges, the University of Montana and its satellite campuses, and Montana State University along with its satellite campuses.
Response Options
Less than 20 miles, 21-50 miles, 51-100 miles, or More than 100 miles
Question 9
From the following types of online access, please rate how often each type is available in your school building:
1. Reliable access to an internet connection at my school for email and web browsing.
2. Reliable access to high speed internet at my school for viewing videos, streaming content, or participating in web conferences (e.g., Zoom).
3. Reliable access to online learning management systems at my school (e.g., Infinite Campus Learning, Blackboard, Moodle, etc.).
4. Access to social media sites like Twitter, Facebook, or LinkedIn at my school.
Response Options
Never available, Sometimes available, or Always available
Question 10
What are the strengths of your school site and/or district that could positively contribute to the implementation of high-quality professional development? Please check all that apply.
1. Good school/organizational climate
2. Supportive administrators
3. School/district is willing to change/adapt
4. School/district maintains fidelity to professional learning plans/goals
5. Good Parent Teacher Association support
6. Experienced, supportive colleagues
7. Adequate release time
8. Adequate technology
9. Adequate resources (books, materials for experiments/labs, etc.)
10. Adequate funding for professional learning
11. Adequate facilities and equipment
12. Appropriate school/district size
13. Other strengths (please describe)*
Response Options
No or Yes or *Open response
Question 11
What are the weaknesses of your school site and/or district that could contribute to high-quality professional development not being implemented? Please check all that apply.
1. Poor school/organizational climate
2. Non-supportive administrators
3. School/district is not willing to change/adapt
4. School/district does not maintain fidelity to professional learning plans/goals
5. Lack of Parent Teacher Association support
6. Inexperienced or unsupportive colleagues
7. Inadequate release time
8. Inadequate technology
9. Inadequate resources (books, materials for experiments/labs, etc.)
10. Inadequate funding for professional learning
11. Inadequate facilities and equipment
12. Inappropriate school/district size
13. Other weaknesses (please describe)*
Response Options
No or Yes or *Open response
Question 12
Please select your level of agreement with the following statements:
1. I would like to attend professional development for STEM teaching and learning or STEM integration to improve my instructional practices.
2. Quality professional development programs for STEM teaching and learning and STEM integration are readily available to me.
3. I am able to adopt or adapt strategies learned from STEM or STEM integration professional development into my teaching practice.
4. I have support from my building principal to pursue professional development for STEM teaching and learning or STEM integration.
5. My participation in STEM or STEM integration professional development would help to improve my teaching.
6. The students in my school stand to benefit from teacher professional learning focused on STEM or STEM integration.
7. Professional development focused on STEM or STEM integration would be received positively within my school.
8. Professional development focused on STEM or STEM integration would be received positively within my community.
Response Options
Strongly disagree, Disagree, Neither agree nor disagree, Agree, or Strongly agree
Question 13
There are a variety of on-site, off-site, and virtual ways to participate in professional learning. Assuming the subject matter is relevant to you, to what extent would you be interested in participating in the following modes of professional learning?
1. Attending face-to-face programs offered at my school site
2. Traveling to face-to-face programs offered in my district or local region
3. Collaborating with other teachers in my school/district in a Professional Learning Community
4. Traveling to face-to-face programs offered at a central location (Billings, Bozeman, or Missoula)
5. Receiving mentorship from an expert teacher in my subject area
6. Viewing virtual training or webinars
7. Completing online, self-paced learning modules (e.g., the OPI learning hub)
8. Using online communities and forums like discussion boards, wikis, and/or blogs
9. Participating in a hybrid model that incorporates some face-to-face time along with online follow-up opportunities
Response Options
Not interested, Possibly interested, or Definitely interested
Question 14
Timing is often a factor when deciding to attend a professional learning session. Assuming the subject matter is relevant to you and the location is convenient, to what extent would you be interested in participating in professional learning delivered in the following ways?
1. One-time training or workshops during school hours (1-2 hours)
2. One-time training or workshops during school hours (half-day)
3. One-time training or workshops during school hours (full day)
4. One-time training or workshops outside regular school hours (evenings)
5. Recurring sessions during school hours
6. Recurring sessions outside of school hours (evenings)
7. Weekend training or workshops
8. Intensive summer workshops (3+ days)
9. Ongoing support programs (initial face-to-face training with ongoing support)
Response Options
Not interested, Possibly interested, or Definitely interested
Question 15
How much do you agree or disagree that the following are barriers to your professional learning?
1. The availability of substitute teachers.
2. Significant travel distances.
3. Not enough time off from work.
4. Have to pay out of pocket to attend.
5. My school/school district does not have sufficient resources for me to attend.
Response Options
Strongly disagree, Disagree, Agree, or Strongly agree
Question 16
Do you have any additional comments to share about your professional learning preferences beyond what was stated above?
Response Options
Open response
Question 17
(For each statement below, please record two responses – one for Importance and one for Interest.) Based on your current teaching assignment, how important are the following teaching and learning topics AND how interested would you be in participating in professional learning focused on these topics.
1. Developing scientific practices (e.g., modeling and argumentation)
2. Designing inquiry-based laboratory activities
3. Engineering design practices
4. Developing formative assessments
5. Supporting classroom discourse and effective collaboration
6. Instructional strategies for meeting the needs of diverse learners
7. Supporting students in developing specific claims, evidence, and reasoning
8. Integrating literacy practices with STEM learning
9. Integrating STEM concepts in a non-STEM classroom
10. Integrating concepts within STEM (e.g., science and math)
11. Integrating the Essential Understandings regarding Montana Indians (IEFA) in the classroom
12. Learning about connections in my community/region to STEM-related industries and organizations
13. Place-based instructional opportunities (e.g., inquiry projects related to local/regional real world issues)
14. Effectively linking classroom instruction to college and careers
15. Social and emotional learning
16. Delivering culturally responsive instruction (including all aspects of students’ culture)
17. Montana career and technical education standards
18. Montana computer science standards
19. Montana math standards
20. Montana science standards
21. Montana technology integration standards
22. Aligning instruction and curriculum with standards
23. Effective use of educational technologies to support student learning
24. Improving strategies for student use of mobile technologies (e.g., iPads, Chromebooks, smartphones)
25. Effective and efficient use of a Student Information System (e.g., Infinite Campus, Power School, etc.)
26. Effective and efficient use of a Learning Management System (e.g., Campus Learning, Blackboard, Moodle, etc.)
Response Options
Not important, Slightly important, Moderately important, or Very important AND Not interested, Possibly interested, or Definitely interested
Question 18
Do you have any additional professional learning that interests you that were not stated above?
Open response
Question 19
Based on your current teaching assignment, would you be interested in having access to contemporary data sets that are currently being prepared and used by university researchers?
Response Options
Not interested, Possibly interested, or Definitely interested
Question 20***
Because you are interested in access to contemporary data sets from university researchers, which of the following would you find most useful? Please check all that apply.
1. Just the raw data sets
2. Examples demonstrating how the data sets can be used to demonstrate real-world problems (e.g., how nitrate pollution impacts agriculture, how water quality is correlated with other economic factors, etc.)
3. Curated lesson plans providing examples as to how the data sets can be used and how they align with Montana standards
4. Professional learning sessions designed to stimulate ideas as to how such data sets can be used in the classroom
***Conditional question (i.e., only visible to those who responded with Possibly interested or Definitely interested on Question 20).
Response Options
No or Yes
Question 21***
Much of the research being conducted by university researchers pursuant to this project relates directly to water quality and how water quality is impacted by Montana activities such as mining, agriculture, and energy. Based on your current teaching assignment, please indicate your level of interest in having access specifically to contemporary data sets related to water quality in this context.
***Conditional question (i.e., only visible to those who responded with Possibly interested or Definitely interested on Question 20).
Response Options
Not interested, Possibly interested, or Definitely interested
Question 22
Based on your current teaching assignment, please indicate your level of interest in the following resources or professional learning opportunities.
1. University researchers travel to my school site to interact directly with students regarding the research they are conducting
2. Professional learning focused on how scientists collect, clean, visualize, and use data
3. Professional learning focused on the research process utilized by university researchers
4. Professional learning focused on the design, manufacture, and testing of research instruments
Response Options
Not interested, Possibly interested, or Definitely interested
Appendix C: Additional School/District Strengths/Weaknesses that Impact PD Implementation
Strengths
• Open to outside school district PD.
• Awesome students!
• Professional organizations in the state.
• Excellent staff.
• Our location at the entrance to Yellowstone National Park.
• We have a technology integration professional development program (TILT).
• A professional attitude and atmosphere in striving to do whatever it takes to assist students in learning.
Weaknesses
• Lack of vision for STEAM.
• Not handicapped accessible.
• We need to create more ACTIVE learners.
• As a special education teacher, hence the odd hour and subject list, I always feel that a more creative approach is needed to help my students. The academic programs suggested don’t always meet what we need and online is often required to meet our goals.
• I was asked to present at a national conference for my research I conducted while at MSU. Although it was a wonderful opportunity, there were no funding opportunities to help me attend. I was unable to fund myself as I have 2 children of my own and am a first-year teacher. I was not surprised due to fact that we are a low-income school and professional development is placed on the back burner.
• Inadequate IT support.
• Over-crowded classes.
• Lack of communication.
• Not so much that they aren’t willing to change, but change takes SOOO LONG!
• Would like to travel to out-of-state conferences.
• Overly prescriptive administrative control.
• Release time is okay but finding subs [substitute teachers] is sometimes difficult, and the time it takes to prepare for a sub and being gone is a concern and always on personal time away from family.
• Extremely remote.
• Low student involvement.
• Our PD seems to be predetermined despite the use of survey tools to see what teachers need/want.
• Overcrowded classrooms.
• Lack of time in general.
• We need curriculum work.
• Reliability of internet.
• We could use design tech resources and vocational tech resources. However, a group is working on a bond issue to support that.
• Small school rural district that is hours away from university resources and teachers have to teach all grade levels, subjects and organize/coach multiple extracurricular activities.
• Mostly TIME and money.
• NO TIME.
Appendix D: Additional Comments About PD Preferences
• Finding subs [substitute teachers] is definitely a huge barrier these days.
• When asked how many PD hours I have related to science I have that many because I am in a Master of Science in Science Education right now, so I have plenty.
• I am the only Special Education teacher so it makes it very difficult to leave the school when I have 30+ students that utilize my services throughout the day.
• Local trainings during school day, 1/2 day, 2 hr. block multiple days, or full day.
• I don’t mind paying out of pocket for a great professional development. However, sometimes it is hard for me to know if the PD will be worthwhile. Therefore, I am often hesitant to spend my money and time on it unless I know for sure that it will be helpful. Our school system does not provide money for us to attend workshops and training (unless they pick the PD). I believe that I can take one day off to attend a PD and that will not count as a personal day.
• Rural focused information would be nice. We often attend workshops where our needs are significantly different than those science teachers who teach only one discipline.
• I am very much that teacher more comfortable being in the classroom as scheduled and learning on my time. This is why online is favored. Too often my students have needed consistent instruction and I was gone. I also have completed 3 online degrees that support this point.
• I am tired of “professional development” that is low grade, basic quality. I want rigorous and demanding PD that challenges the way we currently do things. “Professional development” is not geared towards rising up our profession but is a rather weak excuse for even a free community workshop. I’m tired of it. I can’t imagine other highly trained professionals are subject to the poor quality of trainings we are.
• I love doing professional development and spent a few years researching mathematical modeling and the implications of utilizing STEM competencies to build agency in elementary students. It is a real passion of mine. That being said, many school districts have to put their funding in other areas. I live in a low-income community that I absolutely love. Parents and staff are receptive to new ideas and seem to really enjoy the professional development opportunities that we do. Although I have asked to do professional development opportunities, I figured they would not be approved because the funding is just not available. I had no issue receiving the time off. I struggled to find funding opportunities and I could not pay for it out of pocket. I hope my input has helped!
• I am totally interested in STEM professional development but my district is more toward scores in math and language arts to the point of science getting pushed out of the daily routine in learning.
• Well, I am retiring at the end of the school year, so although I don’t need any more professional development, I would be interested in helping provide it to others.
• There is always room to learn new ideas! Thanks.
• It is difficult to complete a significant amount of outside work/learning during a school week.
• I have had a great deal of STEM education for professional development. So, at this time, I’m not extremely interested in doing more. We’ve already had lots of required professional development with the online suicide courses and a book study.
• It really is about funding. Teaching is the only profession I can think of where employees are required to pay to become better at their jobs. Even planning for a substitute is typically done on our own time and takes far longer than the actual lesson! It’s also about applicability. It’s hard to tailor a workshop that is useful to a wide variety of disciplines and levels of experience.
• I do not have a car for traveling beyond my town. I do not have funds for shops nor for purchasing equipment.
• Some things do not apply to me so much. It is my intention to retire at the end of this school year, even if I am doing things entirely differently!
• There is not much incentive to pay for some of the training when the district will not give you step-up credit. There is really no point in OPI credits, you can get 60 in 5 years with no effort.
• Cost is a big issue when deciding on whether to do professional development. Also, most teachers do not want to use personal days to take time off school to attend professional development.
• We need more support for teachers to interact with their professional organizations and to attend state, regional, and national content (ex: mathematics for mathematics teachers) conferences on a regular basis.
• The self-paced programs have been difficult to find the time to complete.
• I have a STEM volunteer who is not a school staff member but implements a lot of my STEM lessons for me. He works at a university as tech support and has a background in engineering. I would love if there were trainings available that we could also bring volunteers to, as he and I collaborate a lot on ideas for my STEM lessons.
• STEM all the way. We need to prepare our kids for the future!
• It would be nice for something to not be “seasonal,” but to pick one PD topic and dive deeper.
• Teachers are very busy, and many feel the Internet works fine.
• In science we are fortunate because there seems to be a lot of opportunities to get professional development without costs to the teachers.
• Collaboration time is very important. It would be very beneficial to have that time built into the schedule. Thank you.
• I provide most of the STEM training in our district and would be greatly appreciative of training for trainers. I wonder in the survey if you meant STEM and STEAM. I also think many teachers are tired for the push for STEM when their demands of the curriculum in ELA and math have only increased.
• Recently took a class via the OPI Learning Hub and enjoyed it. It was worthwhile.
• As a new educator to the state of Montana, all of the professional development STEM opportunities have been hosted in Bozeman—a travel of 6 hours in one direction. Are there opportunities to have events in Billings or in the east-central part of the state?
• I love professional development opportunities (especially when they actually apply to what I teach)—TIME and MONEY are always issues.
• It is easier to take a full day off than a half-day or for a few hours. Recurring sessions would have the most impact, scheduling is more difficult for this but then the PD would stick and have accountability rather than a one-time shot.
Appendix E: Additional PD Topic Interests
• Curricular area instruction.
• Mathematical modeling within place-based science contexts.
• Applying for classroom grants and outdoor education ideas.
• Infinite Campus is a sore spot for me. I feel confidential documents cannot be protected properly and have little use for it more than I already must.
• I am very interested in learning how to incorporate more hands-on science STEM activities in my classroom. I love anything to do with the outdoors but I feel I could do a much better job with STEM/STEAM projects all around.
• Teaching in a blended learning environment.
• Fine motor development through STEM (for early grades).
• Personalization of STEM content.
• Once again, I am not interested in attending PD because of upcoming retirement.
• Developing innovative lessons in mathematics for mathematics teachers. Fund teams of teachers to train other teachers to innovate.
• How to most effectively use classroom blogs to improve scores on the Smarter Balanced test.
• Creating units.
• Side note: You need money to pay teachers to attend these.
• Developing innovative lesson plans for classroom use.
• Most of the above are available in Billings if teachers have the time to attend.
• Integrating STEM into rural, multigrade classrooms more effectively.
• Integration of math AND ELA standards in my high school biology classroom.
• Using differentiation strategies in the classroom.
September, 2021
Montana State University Science Math Resource Center